 Continuation from yesterday……..(Cyclical Composition Of The Stock Market)
THE 5 YEAR CYCLE IN THE STOCK MARKET
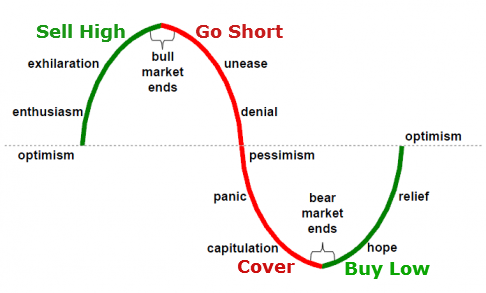
One other easily identifiable cycle within the stock market is the 5 year cycle. These 5 year cycles represent one completed growth pattern or one completed Bull or Bear cycle. Typically, they tend to appear for 5 years, disappear and then reappear at a certain point in the future. And while they are not as sequential as the 17-18 year cycle above, once their place within the overall stock market is understood, they show up at exactly the right time. For instance, …..
- 1914 -1920: Bull Market
- 1924-1929: Bull Market (followed by a 1929 crash)
- 1932-1937: Bull Market (followed by a 1937 crash)
- 1937-1942: Bear Market
- 1966-1971: Bear Market
- 1982-1987: Bull Market (followed by a 1987 crash)
- 1994-2000: Bull Market (followed by a 2000 crash)
- 2002-2007: Bull Market (followed by a 2007 crash)
- 2009-2014: Bull Market
One thing to understand about these 5 Year cycles is that they are exact. They have much lower level variance as compared to their longer counterparts. Essentially, we are NOT talking about 5 years +/- 6 months. We are talking about 5 years +/- a few days. For instance, the 2002-2007 cycle started on October 10th, 2002 (at 2002 bottom) and terminated on October 11th, 2007. If you are counting, that is exactly 5 Years and 1 day. In other words, scary accurate. I encourage you to study the other cycles outlined above in order to prove to yourself how shockingly accurate they all are.
With such cyclical understanding clearly imbedded in our minds, we can now apply this work to our analysis. Those familiar with the 17-18 year cycle would have known that the most recent secular bull market started at a clearly defined long-term bottom in August of 1982. Thereafter, by applying 1st grade algebra, any investors should have figured out that this secular bull market is likely to end sometime in 1999 or 2000.
Further, an analyst familiar with the cyclical composition of the stock market would have been aware that most secular bull markets end with powerful 5-Year run ups. Represented, of course, by the 5-year cycle. For example, 1924 to 1929, 1961 to 1966 and 1994 to 2000. As such, it would have prudent to assume that a secular bull market of 1982 to 1999/2000 would end in exactly the same fashion.
More credence towards this scenario would have been obtained by studying the stock market in 1994. The market topped out in early February and then sold off into the end of March. Recovering somewhat between March and September before initiating its final sell off into November 23rd, 1994.
Thereafter, by simply adding a 5-Year cycle to the date of this November bottom, an analyst would have been able to ascertain that the stock market would likely top out around the end of November of 1999 +/- a few months. As you very well know the actual top had occurred in January of 2000 on the Dow and March of 2000 on the Nasdaq. Not a bad analytical tool considering that it took two simple cycles, some grade school algebra and about 15 seconds to figure it all out.
To be continued tomorrow…….
