InvestWithAlex.com 

Investment Heavyweights Load Up On The Short Side. Should You?

Daily Update June 10th

6/10/2016 – A negative day with the Dow Jones down 118 points (-0.66%) and the Nasdaq down 64 points (-1.29%) 

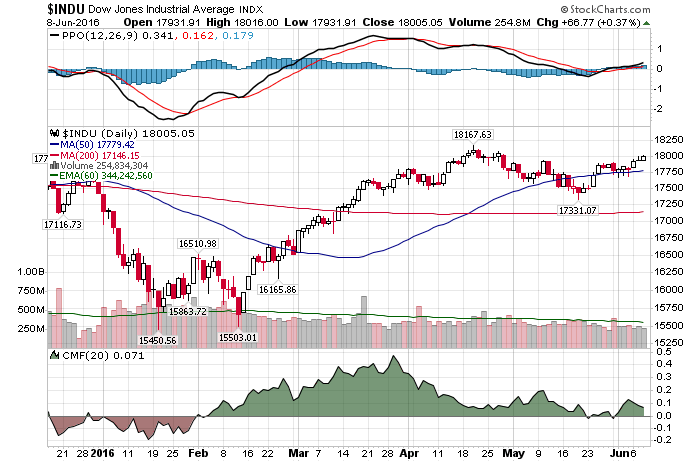
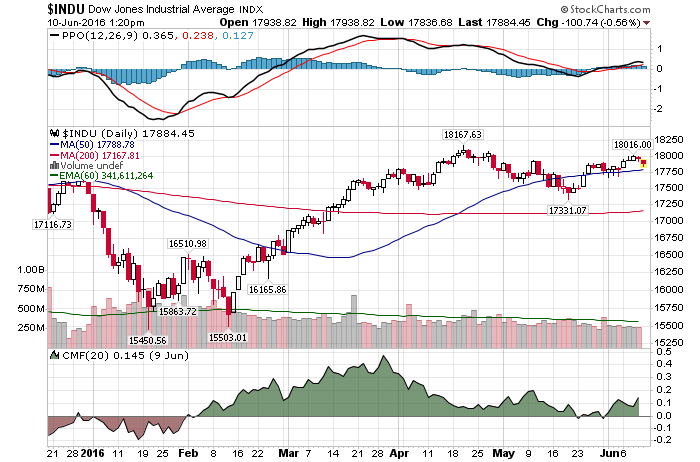
The Dow closed today just about where it was on April 1st and well below its lower top achieved on April 20th at 18,168. But you wouldn’t even consider this tight trading range if you have been following mainstream financial media. According to them, new all time highs and a massive breakout rally are just around the corner.

Perhaps.

Here is what’s troubling about all of this. While CNBC’s talking heads continue on with their perpetual pom pom waving exercise, some of the best investors of our time went on to increase their already massive short positions. Icahn, Soros, Rogers, Druckenmiller, etc…..   I wrote about this before Icahn, Soros, Rogers, Faber, Druckenmiller All Warned…..No One Paid Attention

Let’s take a look at the latest.

Worried about the outlook for the global economy and concerned that large market shifts may be at hand, the billionaire hedge-fund founder and philanthropist recently directed a series of big, bearish investments, according to people close to the matter.

“I don’t think you can have near zero interest rates for much longer without having these bubbles explode on you,” Icahn did say. “You also need fiscal stimulus from Congress”

“Global yields lowest in 500 years of recorded history,” Gross, 72, wrote Thursday on the Janus Capital Group Inc. Twitter site. “$10 trillion of neg. rate bonds. This is a supernova that will explode one day.”

If you participate in financial markets the interview below is a MUST watch. Not only does Jim Rogers talks about a ton of outstanding investment ideas, what the future holds, politics and macroeconomic data, for the first time he acknowledges that war will be the likely outcome of today’s macroeconomic/financial imbalances.

“With the S&P 500 close to all-time highs, stretched valuations and a lack of growth, drawdown risk appears elevated.”

Now, here a billion dollar question. Can all of the above be interpreted as bullish?

At least one man thinks so. Tom Lee: The best investment decisions are characterized by 1 word

One of the lessons I learned over the past 24 years as a research analyst (first job was Kidder Peabody), is the best investment decisions are ‘uncomfortable,‘” Lee said in a note to clients on Friday.

And there is you have it ladies and gentlemen. You can follow the likes of Soros, Icahn, Gross, Rogers, Druckenmiller –OR- you can stand alongside Mr. Lee. An analyst who believes the market will rally. Pushing 10%+ higher by the end of the year because most investors might be “uncomfortable” in going long here.

The choice, as always, is yours.  Invest accordingly.

This conclusion is further supported by my mathematical and timing work. It clearly shows a severe bear market between 2015-2017. In fact, when it starts it will very quickly retrace most of the gains accrued over the last few years.  If you would be interested in learning when the bear market of 2015-2017 will start (to the day) and its internal composition, please CLICK HERE.

(***Please NoteA bear market might have started already, I am simply not disclosing this information. Due to my obligations to my Subscribers I am unable to provide you with more exact forecasts. In fact, I am being “Wishy Washy” at best with my FREE daily updates here. If you would be interested in exact forecasts, dates, times and precise daily coverage, please Click Here). Daily Stock Market Update. June 10th, 2016  InvestWithAlex.com

Did you enjoy this article? If so, please share our blog with your friends as we try to get traction. Gratitude!!!

COT Reports & Weekly Market Calendar – June 10th, 2016

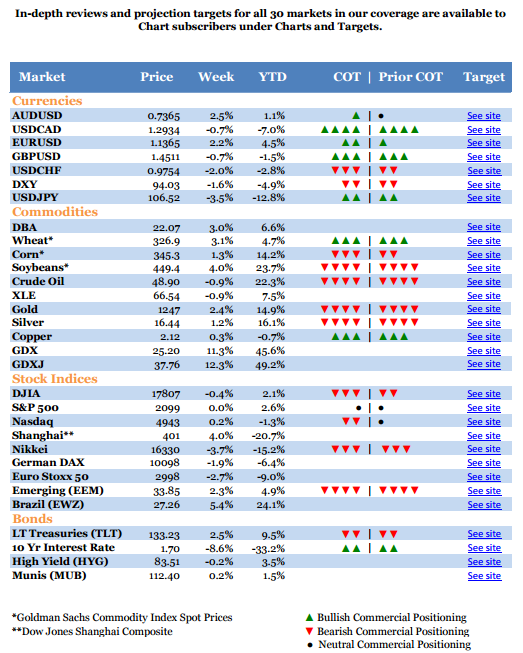
COT Reports: If you are not familiar, the Commitments of Traders (COT) reports provide a breakdown of each Tuesday’s open interest for markets in which 20 or more traders hold positions. In other words, it gives us a preview of what commercial interests are buying or selling. As the theory goes, we want to be on the same side of the trade as the big guys.

While not a good timing tool, currencies, commodities and the stock market (to a lesser extent) tend to move in the direction of the bets made by the commercial players. Not always, but often enough.

Latest data, as of June 7th, 2016

Currencies: 

  • USD:  1K Long Vs. 25K Short – No changes. Substantial short interest remains.
  • Canadian Dollar: 5K Long Vs. 67K Short – Significant short interest.
  • British Pound: 150K Long Vs. 42K Short – No changes. British pound remains bullish.
  • Japanese Yen: 16K Long Vs. 27K Short – Neutral.
  • Euro: 74K Long Vs. 33K Short – Euro remain bullish.
  • Australian Dollar: 42K Long Vs. 17K Short – Bullish.

Conclusion: Based on the information above, commercial interests expect the US and Canadian Dollars to decline while British Pound, Australian Dollar and Euro to rally. Japanese Yen remains neutral. 

Markets/Commodities/Volatility: 

  • E-Mini S&P 500: 443K Long Vs. 336K Short – Net neutral position remains.
  • Nasdaq 100-Mini: 27K Long Vs. 72K Short – Small net short position.
  • VIX: 153K Long Vs. 15K Short –  Record net long VIX position. VIX is at extreme bullish levels. That is net bearish for the market.
  • Gold: 41 Long Vs. 181K Short – Large net short position against the gold.

Conclusion: Based on the information above, commercial interests are now net neutral the S&P. Short the Nasdaq and gold, long the volatility. It is important to note a record breaking net long position in VIX. 

Next Week’s Market Calendar: 

  • June 14th: Retail Sales
  • June 15th: Fed Interest Rate Decision 

Z30

COT Reports & Weekly Market Calendar – June 10th, 2016 Googles

Demeter Capital Weekly Report & COT

As you already know, Matt Demeter’s (Demeter Capital) weekly coverage concentrates on some of the most popular worldwide indices, futures, bonds, stocks, commodities and currencies. Matt’s work is some of the most accurate I have ever seen and it shows. The table below represents just a small portion of work available from Demeter Research. To learn more and to see Matt’s work in action, please Click Here.

Report Date: June 6th, 2016  (Including COT Reports). 

For up to the minute long-term and short-term analysis on all of the markets below, please matt cot

Just A Few Charts To Think About

Daily Update June 9th6/9/2016 – A negative day with the Dow Jones down 20 points (-0.11%) and the Nasdaq down 16 points (-0.32%)

Consider the following charts.

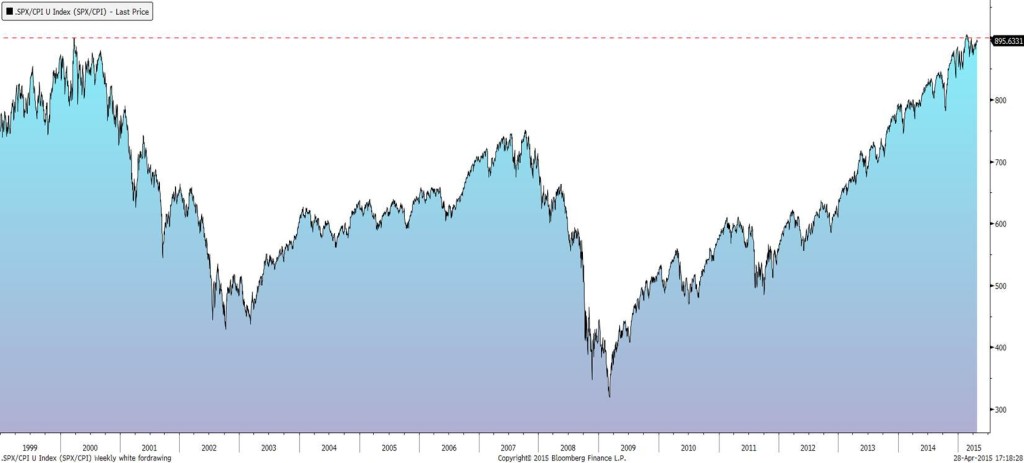
Chart #1: Inflation Adjusted S&P. Despite all of the hoopla about all time highs, the Dow/S&P are sitting at double tops achieved in early 2000. Over 16 years ago. Inflation adjusted that is. The Nasdaq is still down 20%. You would have been the smartest person in the room if you bought 20-30 year Treasury in 2000 yielding 4.5%.

S&P inflation adjusted

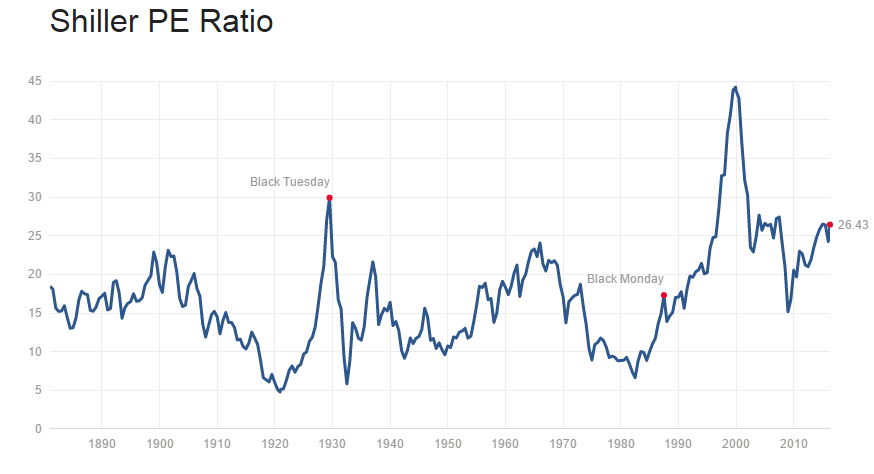
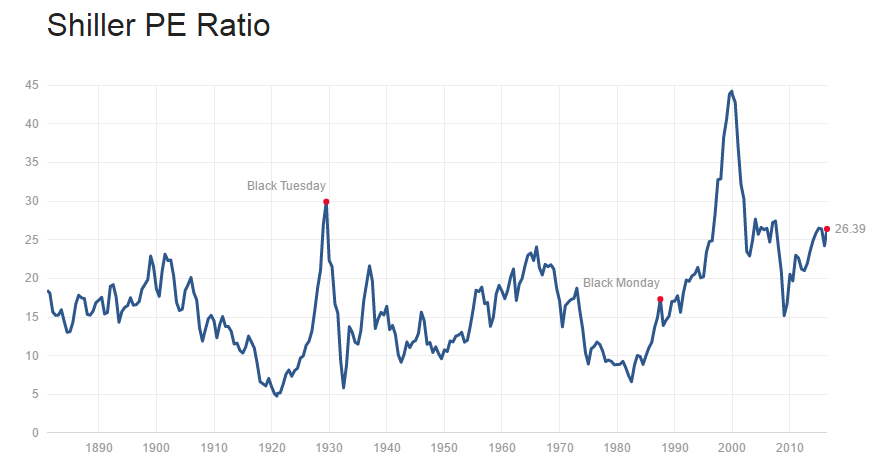
Chart #2: Shiller’s Adjusted S&P P/E ratio. Shows the stock market that is selling at the third highest valuation level in history. Right behind 1929 and 2000 tops and on par with 2007 top. Do I really have to remind you what had happened shortly after those valuation peaks reversed?

shiller 2

Where am I going with this?

I will let John Hussman tell you.

John Hussman: Expensive Stocks Will Lead to Losses, Paltry Returns

“From present valuations, a market loss of that magnitude would not be a worst-case scenario, but merely a run-of-the-mill completion of the current market cycle. Since the dividend yield on the S&P 500 exceeds 2 percent here, that also implies that we fully expect the S&P 500 Index to trade at a lower level in 10-12 years than it does today.”

Most bulls are extremely happy with what Janet Yellen and the FED where able to accomplish over the last few weeks. Particularly, Why Short Sellers Should Send Janet Yellen a “Thank You” Card

Well, they shouldn’t be. All they have done is set up a massive “bull trap” in what is otherwise the last stage of a secular bear market that started in 2000. And considering valuation/earnings imbalances we are witnessing today, long side investors might be in for a beating of a lifetime.

This conclusion is further supported by my mathematical and timing work. It clearly shows a severe bear market between 2015-2017. In fact, when it starts it will very quickly retrace most of the gains accrued over the last few years.  If you would be interested in learning when the bear market of 2015-2017 will start (to the day) and its internal composition, please CLICK HERE.

(***Please Note: A bear market might have started already, I am simply not disclosing this information. Due to my obligations to my Subscribers I am unable to provide you with more exact forecasts. In fact, I am being “Wishy Washy” at best with my FREE daily updates here. If you would be interested in exact forecasts, dates, times and precise daily coverage, please Click Here). Daily Stock Market Update. June 9th, 2016  InvestWithAlex.com

Did you enjoy this article? If so, please share our blog with your friends as we try to get traction. Gratitude!!!

Just How Big Is China’s Credit Bubble?

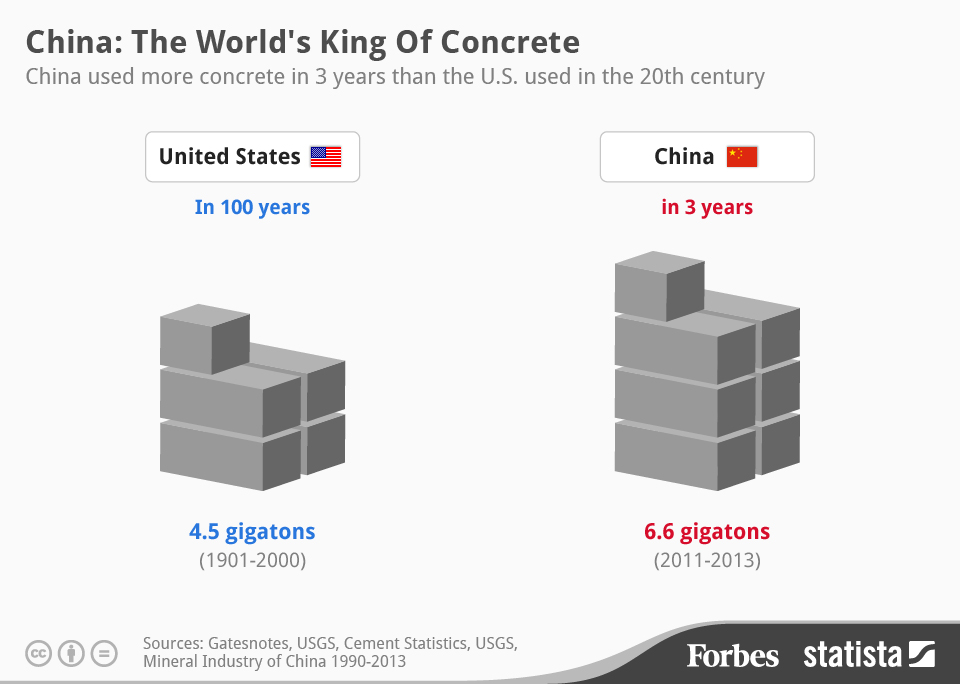
china concrete

The problem is, no one really knows.

The chart above is truly jaw dropping. I have written about China quite a few times last year. For instance, Is China About To Collapse – Drag Us All Down

Recently, there has been quite a bit of news that China’s credit bubble might be much bigger than anyone believes. That shouldn’t come as a surprise to the readers of this blog.

Hedge fund manager Kyle Bass has a very good take on the same subject matter. A view worth studying.

Over the last ten years, China’s banking system has grown from less than $3 trillion to $34 trillion, equivalent to around 340% of Chinese GDP. To put it in perspective, the US banking system had about $16.5 trillion of assets heading into the financial crisis, equivalent to 100% of US GDP. “Credit has never grown faster or larger than it has in China over the past decade,” Bass wrote in a letter to investors dated February 10. There is no precedent.

He goes on to say….

What does this mean for Chinese banks? There is a bad answer and a worse answer. The bad answer is that Chinese bank capital – the equity buffer – is significantly overstated. A TBR requires much less capital to be set aside (only 2.5c as opposed to 11c for an on-balance sheet loan) at the time of origination (anyone thinking Fannie and Freddie?). Adjusting reported bank capital ratios for this effect changes reasonable 8-9% Core Tier 1 capital ratios (CT1) to undercapitalized 5-6% levels. Now, the worse news. TBRs are one of the biggest ticking time bombs in the Chinese banking system because they have been used to hide loan losses.

Finally…..

“One can make many assumptions regarding the collectability of such loans, but our takeaway is that the system is already full of massive losses,” he said. WMPs, TBRs, and the 8,000+ credit guaranty companies constitute the majority of China’s shadow banking system. This system has grown 600% in the last 3 years alone. This is where the first credit problems are emerging, away from the eyes of regulators. The Chinese government has the capacity and the willingness to do what it needs to do to prevent a banking system collapse. China will save its banks, and the renminbi will be the valve for normalization. It is what any and every government would do if put into a similar situation. China should stop listening to Kuroda, Lagarde, Stiglitz, and Lew and start thinking about how to save itself from the impending disaster in its banking system.

What does all of that mean? 

China only has two options. An outright banking and economic blowup/collapse or substantial Yuan devaluation. Invest accordingly.

Z31

Will Interest Rates Stay Low Forever?

Daily Update June 8th

6/8/2016 – A positive day with the Dow Jones up 68 points (+0.38%) and the Nasdaq up 13 points (+0.26%) 

One of the effects of today’s low interest environment is bubble level valuations we see in the stock market. In fact, according to some, zero interest rates mean an infinite valuation range for all stocks. At least in theory.

The sad reality is that until and unless the U.S. posts employment metrics that are consistently strong, or inflation rises significantly and stays elevated, there simply isn’t a case for hiking interest rates this month, this year — and even next year.

Forever is a long time. Many investors also assume, wrongfully I might add, that the Fed can control the entire yield curve.

We have been arguing here for about 2.5 years or since the 10-Year Note hit 3% in early 2014, that the 35 year bull market in bonds will put in a double bottom before surging higher. Well, we are nearly there.

Sure, the Fed will attempt to keep interest rates low, flooding the market with excess cash at onset of any trouble, but I still believe in the market. That believe leads me to a simple conclusion. When long side of the yield curve bottoms, and we are nearly there, yields will eventually surge higher.

On their own and no matter what the Fed does. It is at that time that the illusion of “infinite valuations” will come crashing down back to Earth.

This conclusion is further supported by my mathematical and timing work. It clearly shows a severe bear market between 2015-2017. In fact, when it starts it will very quickly retrace most of the gains accrued over the last few years.  If you would be interested in learning when the bear market of 2015-2017 will start (to the day) and its internal composition, please CLICK HERE.

(***Please NoteA bear market might have started already, I am simply not disclosing this information. Due to my obligations to my Subscribers I am unable to provide you with more exact forecasts. In fact, I am being “Wishy Washy” at best with my FREE daily updates here. If you would be interested in exact forecasts, dates, times and precise daily coverage, please Click Here). Daily Stock Market Update. June 8th, 2016  InvestWithAlex.com

Did you enjoy this article? If so, please share our blog with your friends as we try to get traction. Gratitude!!!


Need Some Extra Cash? Head To The Philippines

As the US Presidential race heats up, it could be worse.

Philippine’s president-elect Rodrigo Duterte is now offering big cash awards for vigilante style killings of drug lords, rapists and other criminals. If you are wondering, killing a drug lord would net you about $100,000, but not a small time distributor. That offer stands at only $42,000. So, grab your AR-15 and book a flight to Manila. Duterte raises bounty for killing drug lords to P5 Million

Not to be outdone by a small Island nation, in whatever category it might be, the US Presidential candidates might want to step up their game. Either way, it will be a fascinating election season to watch. Get your popcorn ready.

z32

Who Cancelled Financial Armageddon?

Daily Update June 7th

6/7/2016 – A mixed day with the Dow Jones up 18 points (+0.10%) and the Nasdaq down 7 points (-0.14%).

If you have no short-term memory, as is the case with most “professionals” on Wall Street, investment sentiment was downright scary just a few months ago. On or around February 11th low to be exact. With numerous investors and market pundits calling for an all out crash and financial Armageddon. I wrote about it at that time.

Financial Media Predicts Armageddon – Time To Go Long? (Feb 10th)

Today, the situation is entirely reversed. You would be hard pressed to find a bear. With most market participants and pundits already celebrating new all time highs.

Too soon…..time to go short? Perhaps.

Before we can answer that question with any degree of certainty we have to ask ourselves the following question……has anything changed since February 11th bottom?

Not fundamentally, but the investment sentiment did swing in the opposite direction.

Now, one can argue that the Fed’s inability or unwillingness to raise interest rates is what’s driving this market higher. It might be, but you won’t find me in that analytical camp. I have been posting for over a year here that the Fed will not raise interest in any meaningful way going forward. Why The FED Will NOT Be Raising Rates Next Year That should have been clear a long time ago.

In short, the fundamental backdrop we have faced in February of this year remains there. With a few notable exceptions. The US Economy, earnings and guidance continue to deteriorate, all while valuations remain at sky high bubble valuations levels. The chart below just about says it all.shiller 3

Invest accordingly.

This conclusion is further supported by my mathematical and timing work. It clearly shows a severe bear market between 2015-2017. In fact, when it starts it will very quickly retrace most of the gains accrued over the last few years.  If you would be interested in learning when the bear market of 2015-2017 will start (to the day) and its internal composition, please CLICK HERE.

(***Please Note: A bear market might have started already, I am simply not disclosing this information. Due to my obligations to my Subscribers I am unable to provide you with more exact forecasts. In fact, I am being “Wishy Washy” at best with my FREE daily updates here. If you would be interested in exact forecasts, dates, times and precise daily coverage, please Click Here). Daily Stock Market Update. June 7th, 2016  InvestWithAlex.com

Did you enjoy this article? If so, please share our blog with your friends as we try to get traction. Gratitude!!!