Does NSA Spy On Your Sex Life As Well?

Bloomberg Writes: Banning Spying Would Be as Effective as a Ban on Sex

scared_little_boy_investwithalex

The uproar in Europe over spying by the U.S. National Security Agency has led to calls for a treaty or code of conduct to limit espionage. To understand why this is naive, imagine a treaty to ban sex. It would be honored in the breach. States, too, have an overwhelming natural impulse: to spy.

Spying is (or was until Edward Snowden) largely covert; no one freely admits to doing it. It is also one of the last preserves of the absolute sovereign, unconstrained by law — think Louis XIV in a trench coat. This is one reason why there are international laws for trade, travel and warfare, but almost none governing espionage, except the one that allows spies to be shot if captured in civilian clothes.

Read The Rest Of The Article

It is mind boggling to me that we live in a country that has a massive surveillance program that essentially spies on everyone in the world, yet this same country can’t put together a working healthcare website after spending $500 Million on it. Something doesn’t add up. Either way, let’s take a look at this issue from a different perspective. 

The question is, why does the US need to spy at all?

Of course a certain level is of spying in necessary, but to do it to the extent that NSA does it is absolutely crazy. For example, I am sure the NSA will scan this blog post, identify various keywords (like NSA), assign it to my profile and probably run it through some sort of a filter to determine if someone needs to look into it further. Okay, but why?

Powerful nations or people do not do this. They are confident enough in their abilities to control their environment. Only those who are scared (politically and economically), reserve to these types of behaviors. Unfortunately, somehow the US became the nation of fear propagated by its own government.

The upcoming Bear Market will only make things worse. Oh, and of course they know everything about your sex life as well. 

Did you enjoy this post? If so, please share our blog with your friends as we try to get traction. Gratitude!!! 

Bill Gross Shares A Valuable Tip

CNBC Writes: Gross: The stock market and asset prices are ‘bubbly’

 drastically-overpriced-investwithalex

Bill Gross, the co-chief investment officer of Pimco, said he thinks the stock market and “all asset prices are bubbly.”

“Bond prices, stock prices … and profit margins are bubbly to the extent that [if] any of them can be sustained, I guess, is the ultimate test,” Gross said on CNBC Wednesday.

He said the Federal Reserve‘s QE program is a “rather blunt instrument in terms of elevating, and perhaps, bubbling stock prices.”

“Margin debt is at historic levels to the extent that they want to simmer down equity prices [but] they don’t have to attack it through tapering … they can raise margin requirements.”

“The bond market is bubbly because the policy rate at 25 basis points is artificially suppressed. Investors and savers are not receiving what they have historically … in historical terms would probably be around 2 to 2.5 percent,” he said.

I have very little to add here. Mr. Gross is right on the money. I have been saying this for a while as well, everything is overpriced. Big time. The only thing I will add into the mix is my timing and mathematical work. Once again, it is predicting the beginning of a severe Bear Market that will only end  in 2016. There is no stopping it. 

Did you enjoy this article? If so, please share our blog with your friends as we try to get traction. Gratitude!!! 

How To Avoid Losing $30 Billion In 16 Months

BusinessWeek Writes: Brazil’s Once-Richest Man Gets Ready for Oil Company Bankruptcy

how to lose billions 

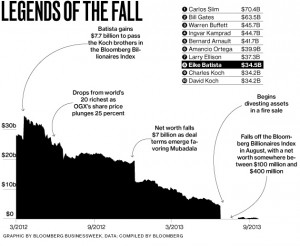
OGX Petróleo e Gás (OGXP3:BZ), the oil company controlled by Eike Batista, is preparing to file for bankruptcy protection, putting $4 billion in bonds and loans into default. The filing could come as early as today, according to Bloomberg News, and would be the largest corporate debt debacle in all of Latin America.

It would also mark the latest chapter in the ignominious comedown of Batista, once the eighth-richest man in the world and the poster boy of Brazilian entrepreneurialism. During his glory days, he seemed to find rich gold mines with blithe ease, courted supermodels, and charmed and cajoled hard-bitten New York money men to throw in their lot with him.

Read The Rest Of The Article Here

I wanted to bring your attention to this cautionary tale for a couple of reasons.

1.  If you want to make it big you have to play big. Sometimes you crash and burn, but that is all part of a game. Mr. Batista has tried his best, but things didn’t work out. Trading in the stock market is exactly like that. Learn from it.

2.  You can be worth $30 Billion one day and lose it all in 16 months. At times markets don’t mess around. They can take everything you have within a short period of time.  This of course is my subtle way to warn you about today’s highly speculative and overpriced financial markets.   

3.  His demise might be the blueprint for the upcoming US decline. In fact, his financial setup prior to the collapse is the mirror image of the US Financial System and the Economy.

Too much debt, too much hype, too much manipulation and empty promises. The only difference is that the US has the ability to print unlimited amounts of money and the consent from its creditors to do just that (so far). Once that consent runs out (and it will), the US financial system will find itself in a very similar situation.

Did you enjoy this article? If so, please share our blog with your friends as we try to get traction. Gratitude!!! 
Secret Stock Market Structure That Is Truly Mind Blowing (Part 2).

Long Term Dow Structure


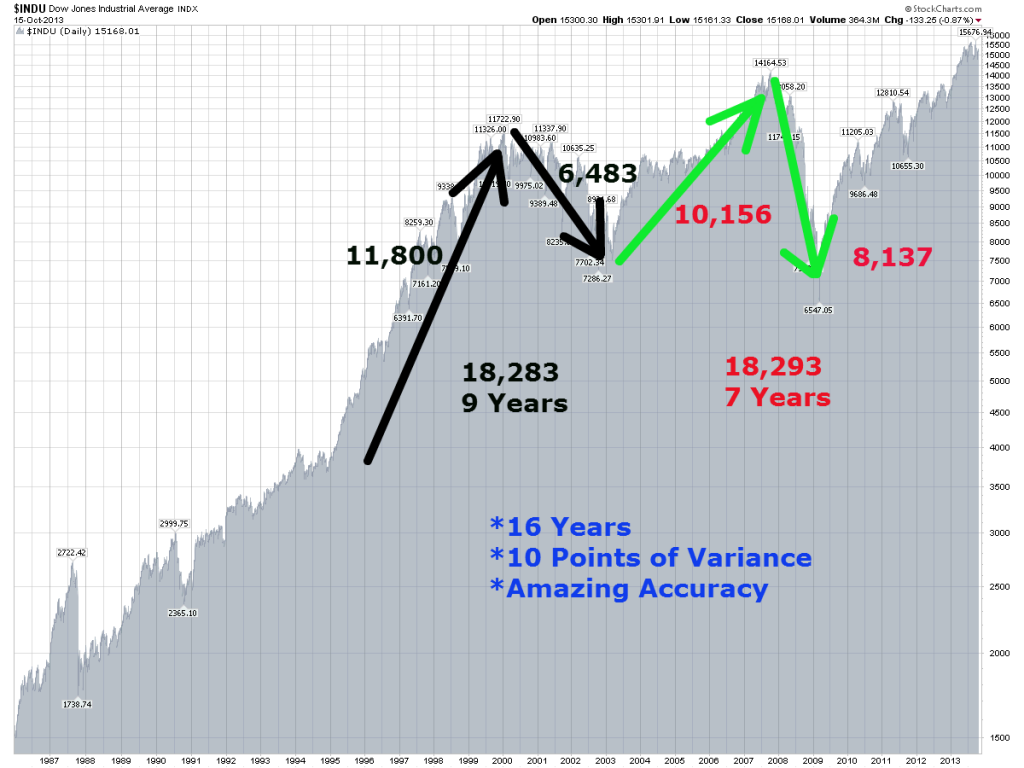
This post continues to look into the mathematical work that I have been doing. Once again, indicating prefect structure in the financial markets. 

The numbers derived above stem from my own unique way of looking at the stock market. They are 3 dimensional calculations that combine price and time into one number. The calculation itself is basic high school math, but I will let you figure it out if you want to pick it up from here.  

I cannot overstate how amazing this chart is. Just a few points. 

  • The move between 1994 bottom and 2000 top was 11,800 UNITS. The Dow topped at exactly 11,800 in January of 2000. Amazing!!! 
  • The up move between 1994 bottom and 2000 top was 11,800 UNITS. The down move between 2000 top and 2002 bottom was 6,483 UNITS. When you combine both values together you end up with a value of 18,283 UNITS. The move took 9 years. 
  • The up move between 2002 bottom and 2007 top was 10,156 UNITS. The down move between 2007 top and 2009 bottom was 8,137 UNITS. When you combine both values together you end up with a value of 18,293 UNITS.  The move took 7 years. 

So, the combined move took 16 years and there was only 10 UNITS of variance between the moves. And you still want to argue with me that the market is random? It Is Not. Once you know and understand this structure you can time the market with great precision. 

For example, if you understand the structure you know that the move from 2007 top will be exactly 8,127 UNITS. With such knowledge you can know the exact time and point location of the bottom in 2009. I mean to the day and long before it happens. Just as I predicted in 2008. So, while everyone is freaking out and trying to figure out where the bottom is you can be laying on the beach while making crazy amounts of money shorting the market. 

The sample structure above is just a small sample of how the market truly works. This type of measurement is available on the daily charts as well as the long term charts. 

Did you enjoy this article? If so, please share our blog with your friends as we try to get traction. Gratitude!!! 
Largest Money Manager Reveals An Outrageous Secret

Bloomberg Writes: BlackRock’s Fink Says There Are ‘Bubble-Like Markets Again’

overdose investwithalex 

BlackRock Inc. (BLK) Chief Executive Officer Laurence D. Fink, whose company is the world’s largest money manager with $4.1 trillion in assets, said Federal Reserve policy is contributing to “bubble-like markets.”

“It’s imperative that the Fed begins to taper,” Fink said today at a panel discussion in Chicago, referring to the central bank’s $85 billion in monthly bond purchases. “We’ve seen real bubble-like markets again. We’ve had a huge increase in the equity market. We’ve seen corporate-debt spreads narrow dramatically.”

“We have issues of an overzealous market again,” Fink said at the event, which was sponsored by the Paulson Institute and the University of Chicago Institute of Politics. 

He is of course absolutely right. The markets have been distorted by the FED to an amazing degree. The situation is truly unprecedented as we have never seen anything even close to that.

I would go even further and argue that we have backed ourselves into a corner from which no easy exit is possible. As I have mentioned before the velocity of $85 monthly QE is slowing down drastically as all of that money no longer has as much of a impact as it did in the past. Simply put, as the velocity slows down, the overall economy/markets follow and interest rates go higher. On the flip side, should the FED cut back by any amount (even a small one) the impact to the downside will be as described above, only much more severe. There is no easy answer, we will all have to suffer.

Not that I would know, but it is like going through a cocaine withdrawal. Your normal dose no longer has the kick, yet if you decrease the dose….withdrawal symptoms begin to show up.

Either way, only two outcomes are possible. Going through a withdrawal or ODing. Not a pretty picture for the US Economic future either way you look at it.   

Did you enjoy this article? If so, please share our blog with your friends as we try to get traction. Gratitude!!! 
A Little Known Way To Blow $1 Billion

Obamacare Website Trainwreck

Shocking data released Thursday by a highly regarded Bloomberg government analyst put the Obamacare website rollout cost at over $1 billion. This represents a $600 million increase over the price tag usually associated with the Affordable Care Act, according to the Government Accountability Office. 

Unfortunately, the bad news does not end here. Due to the multitude of kinks and glitches so far encountered and the anticipated overload of problems yet to be exposed, the website costs will continue to escalate.

Bloomberg’s Peter Gosselin offered, “Given the seriousness of the IT problems and the fact that most of the contracts are on a cost-plus basis, the companies almost certainly are in line for another burst of spending aimed at quickly making repairs.”

Just yet another sign that the US Government has completely broken down.  How can anyone spend $500 Million (with cost estimated to balloon to $1 Billion) on a website that doesn’t even work is beyond me. 

As someone who has build a number of fairly complex websites I cannot understand how the website they have built can cost anywhere close to that much money. They could have outsourced it to India or Russia or they could have found a few college kids who would have built them a killer application for as little as $10 Million. I guarantee you that.  The cost that they are paying is astronomical and just shows how broken down the system is.

It is just another symptom of complete mismanagement and fraud that is the US Government. They borrow money they do not have and repay it with money printed out of thin air, they wage wars against cave dwellers with AK-47 by shooting at them with Million dollar missiles,  they spent $1 Billion on a website that should only cost $10 Million and they goose the economy with cheap credit at the expense of a future collapse. How is any of this going to end well?

 It will not. 

Did you enjoy this article? If so, please share our blog with your friends as we try to get traction. Gratitude!!! 

Here Is A Quick Way To Destroy Confidence

Bloomberg Writes: Is JPMorgan Getting a Bad Deal?

 bailout investwithalex

In resolve a handful of state and federal investigations, JPMorgan Chase (JPM) has tentatively agreed to pay $13 billion—more, as my colleague Nick Summers points out, “than the combined salaries of every athlete in every major U.S. professional sport, with enough left over to buy every American a stadium hot dog.” Thirteen billion is also equal to 61 percent of the bank’s profit for 2012, so it’s a significant sum. But does that make it a “shakedown,” as some have suggested?

But there’s no getting away from the fact that the Obama Administration has taken a great deal of criticism over the lack of accountability pertaining to the financial crisis and for not punishing those who had a role in bringing the economy near collapse.

Read The Rest Of The Article Here

I am no fan of big banks nor the bailout of said banks in 2008. In fact, I was a big proponent then, as I am now, that those banks should have failed. Yes, it would have caused a lot of economic pain, but we would have been on the way to a real economic recovery now.  Instead, they have created even a bigger moral hazard.

With that said, I am troubled by this settlement. The US Government is now going after the those who were  willing to step in and backstop the economic collapse by taking over failed financial institutions on request from the US Government. It’s like begging your neighbor for money to buy food (because you are starving) only to slap him with a lawsuit a few years later for lending you that money.  Not only is it unfair, it is downright idiotic as it brings even more risk into the financial system.

Listen, I understand that there was a lot of back room dealings and billions of dollars changing hands that we do not know about. Yet, one thing is clear. If this is to happen again, good luck finding anyone willing to step in. Yes, I am talking to you US Government.  

Did you enjoy this article? If so, please share our blog with your friends as we try to get traction. Gratitude!!! 

Stock Market Update, October 25th, 2013

daily chart Oct 25, 2013

Summary: Continue to maintain a LONG/HOLD position

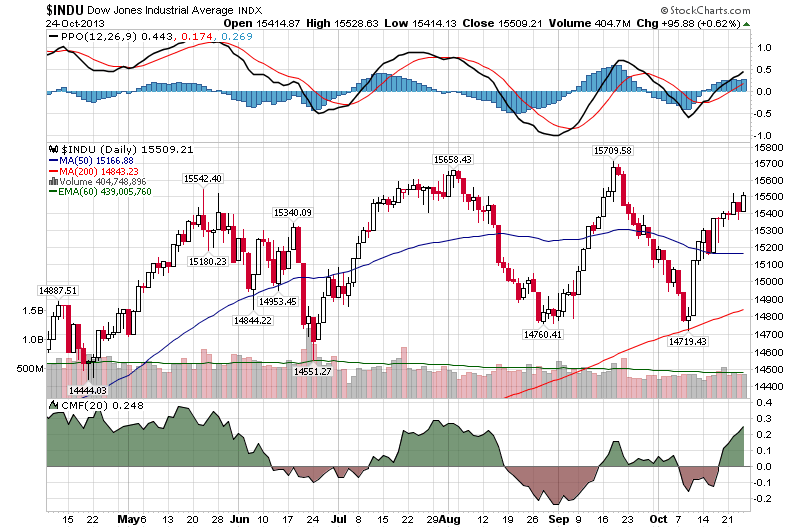
In the last couple of updates I have mentioned that the market will bounce to the 15,300-15,500 on the DOW in order to close all the gaps and to satisfy all of my requirements. Well, we are here, what’s next?

This is where the picture gets a little bit fuzzy.  According to my mathematical work there is no doubt that we are at the inflection point with two possible outcomes.

  1. September 2013 top was indeed the top and the bear market down leg will resume shortly.
  2. The final top (a little bit higher or lower than September 2013 top) will be set in March of 2014. Thereafter the market will roll over and begin its bear phase.

As I have mentioned many times before, my mathematical work is clearly showing that the bull is ending and the 2-3 year Bear market is just beginning.  I would call the exact date, but there is just too much interference right now.  Unless a severe down leg starts over the next 2 weeks, we will have to wait until March of 2014 for the Bear to start. Until that happens a lot of ups and downs without so much as going anywhere.  The rest of my analysis remains the same.

Over the next few weeks we will find out if the if the bear market has already started or will start in March of 2014. Should the market break below 14,600 over the next two weeks, the probability is high that we have already started the bear market leg into the final 2016 bottom.  The market is certainly going back into the 14,800 as it left a huge gap there, but a firm break below 14,600 will give us a confirmation that the bear is back.

At the same time we cannot yet ignore the technical picture with the market being near an all time high. As such, I continue to advise you to maintain a LONG/HOLD position while waiting for the confirmation that the bear market has indeed started.  

Did you enjoy this article? If so, please share our blog with your friends as we try to get traction. Gratitude!!! 

How To Determine The Intrinsic Value Of Any Company (Part 3)

valuation2-investwithalex

Further Notes & Valuation Explanation

Based on the calculation above there are 2 important dynamic areas that require our further attention and explanation.  They are an integral part of the calculation and just a small adjustment can have a significant impact on the overall Intrinsic Value outcome. These variables are…

1. Estimated Future Growth Rate:  Determines the future growth rate of the company over the next 10 years. It is an impossibly difficult number to get right. We can look at the historic growth of the company and use that number OR we can use the existing (last few quarters) growth rate OR we can use our future projected growth rate based on our understanding of the fundamental factors, the economy, company products and so forth.

Whatever your decision might be, understand that you are somewhat guessing here. The future is fuzzy. In 10 years the company might be collapsing with negative growth rates or it might be growing at an

+40% rate due to new product introduction. I often find it helpful to concentrate on the historic/average growth rate and then reduce it by a few percentage points to reduce Intrinsic Value output.  This give me a little bit more margin of safety and a little bit more room if I have made a mistake. 

2. Average P/E Rate:  Very similar situation to the Estimated Future Growth Rate discussed above. While we can look at the average P/E  ratio of the company over the last 10 years and perpetuate it over the next 10 years, in reality we have no idea what that ratio will be in 10 years.  In Microsoft’s example above we have estimated that the P/E ratio will be at P/E= 15 in 10 years.

Yet, no analyst can say that with 100% certainty.  Once again, the company might stumble over the next 10 years and find itself with a P/E Ratio of 5 OR it might surge its growth and find itself with a P/E Ratio of 35. Of course, that greatly impacts the Intrinsic value calculation and any perceived Margin of Safety that you have.  As discussed in the previous point you are better off using historic/average P/E Ratio and then reducing it by a few points to give yourself some extra margin of safety.

It is often helpful to play around with different inputs for these variables based on your research. It will give you a range of Intrinsic Values (Best Case, Average, Worst Case) type of scenarios that can give you a better understanding of what the company is really worth.

For example, in Microsoft’s case you can have a range of ($45.15 I  $54.82 I $59.28) based on playing around with a few numbers.  These prices can act as markers for future developments.  If the company is performing better than your original research has indicated, a higher range IV is appropriate. If worse,  the lower one.  In either case, you are at least aware that the Intrinsic Value is not an exact number, but a constantly changing one.

Once again, the formula above is a highly simplified version of a standard Intrinsic Value calculation.  It can be made a lot more complicated for the purposes of being more precise. Plus, there are multiple ways to calculate the Intrinsic Value.  Whatever the situation is I want you to understand that an Intrinsic Value number cannot be determined with exact precision.  It is your best guess based on the past and the research that you have done.  

Finally, some of the most important variables in the Intrinsic Value calculation rely on the future performance. While the future can be estimated, any such estimate is rarely accurate. As such, you must have a clear understanding that you are making predictions based on unknown future developments that might or might not be anywhere close to what you have originally estimated. 

Did you enjoy this article? If so, please share our blog with your friends as we try to get traction. Gratitude!!! 
How To Determine The Intrinsic Value Of Any Company (Part 2)

That is why I argue that most investors out there do not need a complex “discounted cash flow Intrinsic Value calculation”.  Yes it will give you a more precise answer, but a much easier valuation technique can give you the same answer within 5 minutes. Here is what you have to do.

Coins and plant, isolated on white background

First, let’s take a look at Microsoft Inc and estimate its Intrinsic Value.

We need the following inputs easily available from any financial website (Ex: Yahoo Finance)

  1. Stock Market Price: $33.75 (Oct 23, 2013)
  2. Current EPS (Earnings Per Share): $2.58
  3. Estimated Future Growth Rate:  10.8%
  4. Weighted Average Cost Of Capital (WACC): 7 to 8%
  5. Average P/E (Price/Earning) Ratio To Use:  15

STEP#1:  Figuring out EPS in 10 years.

  • Formula:  (Annual EPS x Estimated Growth rate^10)
  • Microsoft:  $2.58 x  10.8%^10 = $7.19

Explanation:  If Microsoft continues to grow its EPS at 10.8% over the next 10 years,  in 2023 its earnings per share will be equal to $7.19

STEP #2:  Figuring out stock value at year 10

  • Formula (EPS at year 10 x Average P/E Ratio)
  • Microsoft:  $7.19 x 15 = $107.85

Explanation: This means that if EPS and Average P/E ratio hold, the price of Microsoft stock will be $107.85 in the year 2023.

STEP #3:  Discounting future value to determine today’s Intrinsic Value

  • Formula (Future Stock Value/ WACC^10)
  • Microsoft $107.85/(1.07^10)=$107.85/1.9671=$54.82

Explanation: That means the stocks Intrinsic Value today should be is $54.82. With the stock price being $33.75 today, it appears that Microsoft is selling at about 38% discount to its Intrinsic Value.

The Weighted Average Cost Of Capital (WACC) used in the calculation above was 7%. In simple terms WACC is the average combined cost of debt and equity. It is not a particularly hard calculation, but it does require some work.  I do not believe that you need to do this calculation.  

Instead, there are two other ways to think of WACC.  You can think of it as ROI % required by you for this investment or as the average stock market return over the last 50 years. To simplify things even further I tend to use 7-8% WACC at this time, unless there are company specific issues that lead me to either increase or decrease the cost of capital.   

To be continued…..