What You Ought To Know About Today’s Stock Market Composition.
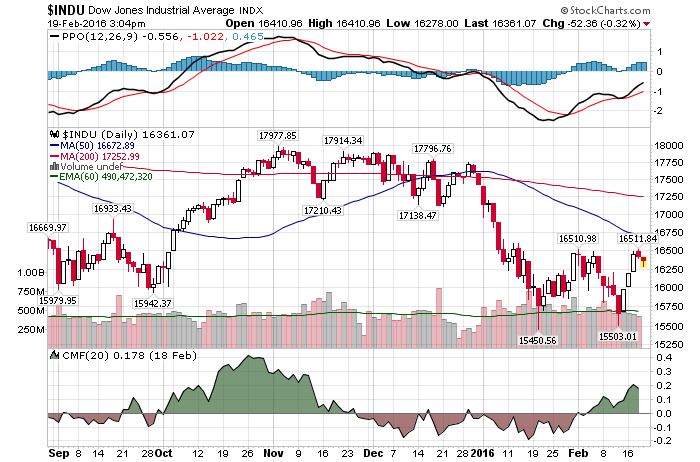
2/19/2016 – A mixed day with the Dow Jones down 22 points (-0.13%) and the Nasdaq up 17 points (+0.38%)
Let’s start with today’s long-term picture.
Quite a few investors today,particularly permabears, make the fatal mistake of assuming that today’s imbalances are so great that they will surely lead to a crash of historic proportions. Think in terms of 1929, 1937, 1972, 1987, 2000, etc…
Case and point……Chilling ways the global economy echoes 1930s Great Depression era
Let me tell you something, they are dead wrong and they will pay dearly for it. That is, when this bear market bottom comes and they are caught with their pants down shorting everything in sight.
Their misunderstanding stems from not fully understanding where we are in the overall cyclical composition of the market.
And where are we?
We are nearing completion of a 2000-2017 secular bear market. An exact analysis was outlined here previously….Year End #1 – Why This Analysis Scares The Bejesus Out Of Bulls
That is to say, we are in a period of time similar to 1912-1914, 1946-1949 and 1980-1982. And NO, we are NOT in danger of a major collapse suffered in 1929 or 1937 or 1972 or 1987, etc… Those tend to appear in early stages of bull/bear cycles. Not at the end.
In other words, those who expect financial Armageddon might have to wait a little bit longer. We won’t get one here. But don’t get me wrong, I am not saying that a substantial decline is not possible here.
Now, let’s take a look at the short-term composition.
Here is a good look at the subject matter…..Bearish engulfing’ pattern vies for financial-sector sway with bullish ‘abandoned baby’
Not bad, but I am sticking to my own and much more accurate/superior analysis. Here is the analysis presented to you a few weeks ago. Notice, we remain within the confines of my trading range.
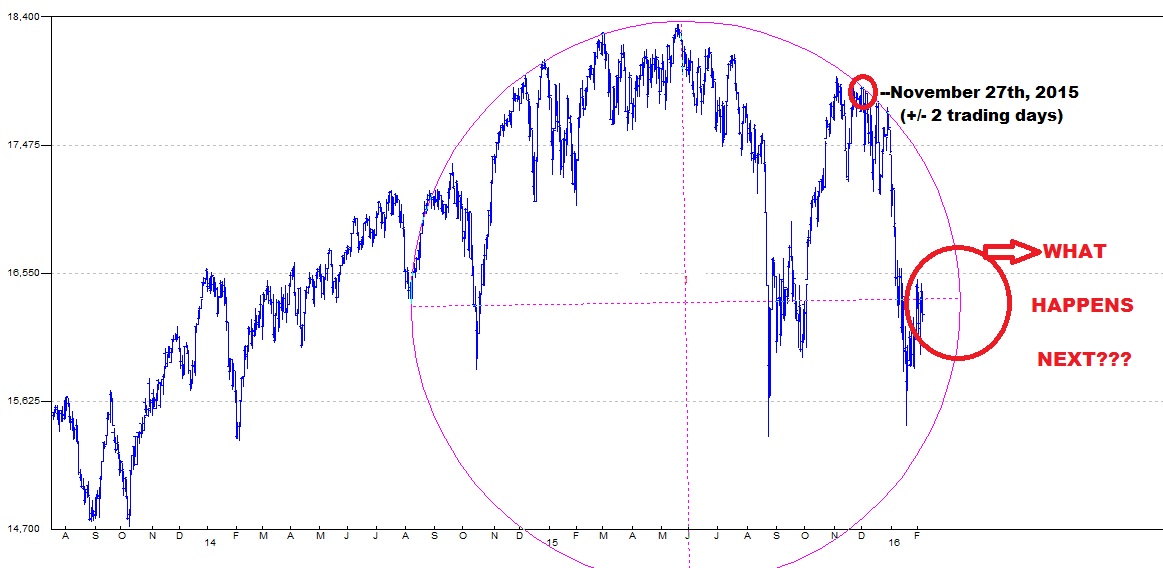
We remain in a very complex market environment. Here is the chart I presented to you almost two weeks ago. Suggesting at the time that the market will remain within a certain trading range until the structure below (sphere) completes itself on a certain date and price. When it does, a powerful directional move will start. If you would like to find out when that PRICE/TIME arrives (to the day) and where the market will push next, please Click Here.
Finally, you might want to listen to what David Stockman is saying here. I don’t know what the bulls are smoking:
“I think your traders are smoking something stronger than what I can legally buy here in Colorado. Everywhere trade is drying up, shipping rates are at all-time lows,” he said. “There is a recession that’s going to engulf the entire world economy, including the United States.”
And while I am not sure what the bulls are smoking either, they are surely inhaling a lot of greed while exhaling a lot of BS.
This conclusion is further supported by my mathematical and timing work. It clearly shows a severe bear market between 2015-2017. In fact, when it starts it will very quickly retrace most of the gains accrued over the last few years. If you would be interested in learning when the bear market of 2015-2017 will start (to the day) and its internal composition, please CLICK HERE.
(***Please Note: A bear market might have started already, I am simply not disclosing this information. Due to my obligations to my Subscribers I am unable to provide you with more exact forecasts. In fact, I am being “Wishy Washy” at best with my FREE daily updates here. If you would be interested in exact forecasts, dates, times and precise daily coverage, please Click Here). Daily Stock Market Update. February 19th, 2016 InvestWithAlex.com
Did you enjoy this article? If so, please share our blog with your friends as we try to get traction. Gratitude!!!
What You Ought To Know About Today’s Stock Market Composition. Google
Investment Wisdom Of The Day
Further Yuan Devaluation Imminent
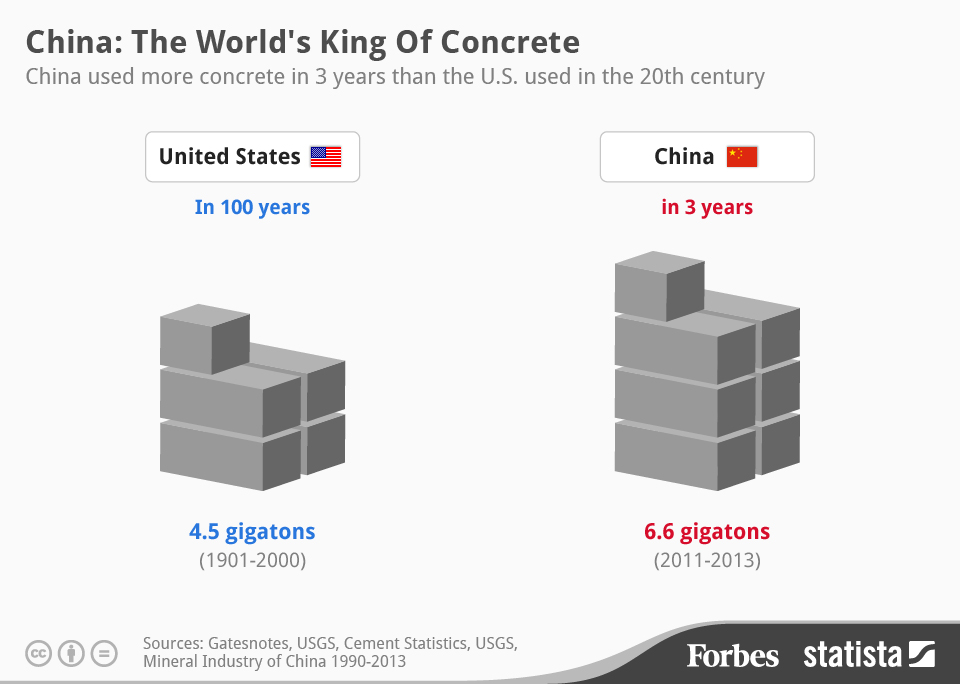
The chart above is truly jaw dropping. I have written about China quite a few times last year. For instance, Is China About To Collapse – Drag Us All Down
Hedge fund manager Kyle Bass has a very good take on the same subject matter. A view worth studying.
Over the last ten years, China’s banking system has grown from less than $3 trillion to $34 trillion, equivalent to around 340% of Chinese GDP. To put it in perspective, the US banking system had about $16.5 trillion of assets heading into the financial crisis, equivalent to 100% of US GDP. “Credit has never grown faster or larger than it has in China over the past decade,” Bass wrote in a letter to investors dated February 10. There is no precedent.
He goes on to say….
What does this mean for Chinese banks? There is a bad answer and a worse answer. The bad answer is that Chinese bank capital – the equity buffer – is significantly overstated. A TBR requires much less capital to be set aside (only 2.5c as opposed to 11c for an on-balance sheet loan) at the time of origination (anyone thinking Fannie and Freddie?). Adjusting reported bank capital ratios for this effect changes reasonable 8-9% Core Tier 1 capital ratios (CT1) to undercapitalized 5-6% levels. Now, the worse news. TBRs are one of the biggest ticking time bombs in the Chinese banking system because they have been used to hide loan losses.
Finally…..
“One can make many assumptions regarding the collectability of such loans, but our takeaway is that the system is already full of massive losses,” he said. WMPs, TBRs, and the 8,000+ credit guaranty companies constitute the majority of China’s shadow banking system. This system has grown 600% in the last 3 years alone. This is where the first credit problems are emerging, away from the eyes of regulators. The Chinese government has the capacity and the willingness to do what it needs to do to prevent a banking system collapse. China will save its banks, and the renminbi will be the valve for normalization. It is what any and every government would do if put into a similar situation. China should stop listening to Kuroda, Lagarde, Stiglitz, and Lew and start thinking about how to save itself from the impending disaster in its banking system.
What does all of that mean?
China only has two options. An outright banking and economic blowup/collapse or substantial Yuan devaluation. Invest accordingly. The problem is, everyone is trying to devalue their own currency, with the FED/USD about to join the party.
Is Janet Yellen Being Tested?
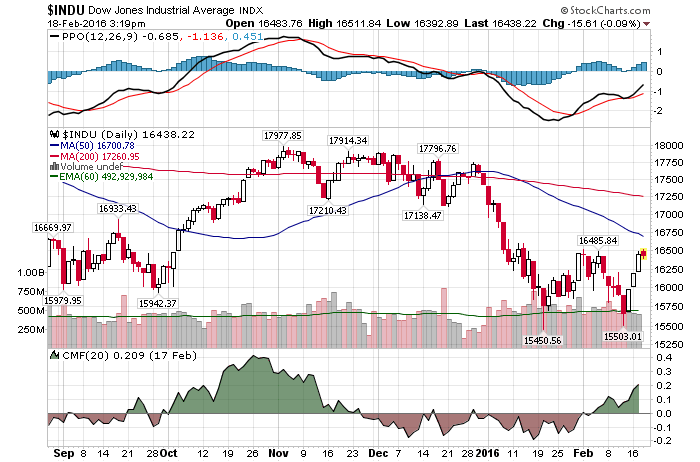
2/18/2016 – A negative day with the Dow Jones down 41 points (-0.26%) and the Nasdaq down 46 points (-1.03%)
Here is something that I haven’t seen anyone cover. Basically, every FED Chairman since Paul Volcker, and to a certain extent before, has been baptized by fire of a large scale market sell-off. Let me give you an example.
- Paul (The Iron Will) Volcker: Took office in August of 1979. Last down leg of a 1966-1982 bear market started in April of 1981. Baptized by fire 1.5 years into his tenure.
- Alan (The Master Printer) Greenspan: Took office in August of 1987. Baptized by fire just two months later, when the crash of 1987 took place.
- Ben (The Savior) Bernanke: Took office in February of 2006. The 2007-2009 bear leg started in October of 2007. Baptized by fire 1.75 years into his tenure.
- Janet (Everything is Peachy) Yellen: Took office in February of 2014. Now exactly two years into her tenure.
I am sorry to tell you this Ms.Yellen, but if the trend above holds true, you are about to get creamed along with every other bull out there.
Not only that, it appears that Ms. Yellen’s test might have actually started last year and right on schedule (1.5 years into her tenure).
This conclusion is further supported by my mathematical and timing work. It clearly shows a severe bear market between 2015-2017. In fact, when it starts it will very quickly retrace most of the gains accrued over the last few years. If you would be interested in learning when the bear market of 2015-2017 will start (to the day) and its internal composition, please CLICK HERE.
(***Please Note: A bear market might have started already, I am simply not disclosing this information. Due to my obligations to my Subscribers I am unable to provide you with more exact forecasts. In fact, I am being “Wishy Washy” at best with my FREE daily updates here. If you would be interested in exact forecasts, dates, times and precise daily coverage, please Click Here). Daily Stock Market Update. February 18th, 2016 InvestWithAlex.com
Did you enjoy this article? If so, please share our blog with your friends as we try to get traction. Gratitude!!!
Investment Grin Of The Day
This Shocking Analysis Clarifies What The Market Will Do Next

A couple of interesting things to consider this morning.
First, Global downturn spurred Fed to consider changing rate path: minutes
Federal Reserve policymakers worried last month that a global slowdown and financial market selloff could hurt the U.S. economy and considered changing the central bank’s planned interest rate hike path for 2016.
Well, that was fast. Mind you, this sudden change of heart comes after a laughable 25 bps increase. What a bunch of fools (at the Fed). This should not come as a surprise to the readers of this blog. I have been talking about this very aspect throughout 2015. Why The FED Will Not Raise Interest Rates
Now, in consideration of today’s market environment.
- This indicator suggests this week’s stock-market rally won’t last
- Longtime bull turned bear says S&P 500 could tumble 34.1%
- Is there enough blood in the streets to buy stocks?
I suggest you read all of the above and come to your own conclusion. As for me, I will simply repeat what I have said here last night.
We remain in a very complex market environment. Here is the chart I presented to you almost two weeks ago. Suggesting at the time that the market will remain within a certain trading range until the structure below (sphere) completes itself on a certain date and price. When it does, a powerful directional move will start. If you would like to find out when that PRICE/TIME arrives (to the day) and where the market will push next, please Click Here.

This Shocking Analysis Clarifies What The Market Will Do Next Google
What You Ought To Know About “Buying The Dip” Here
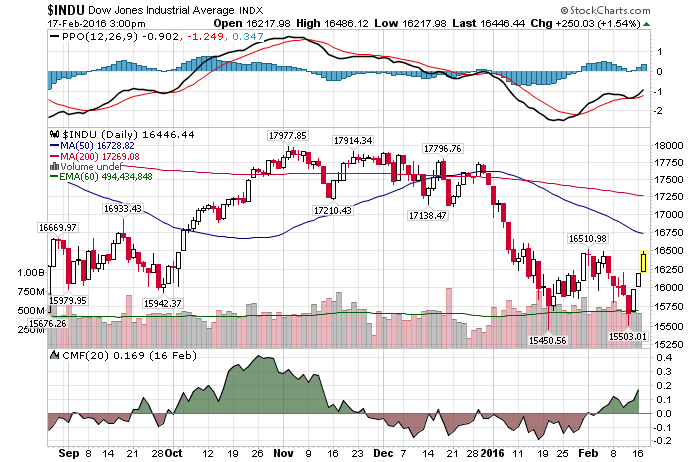
2/17/2016 – Another positive day with the Dow Jones up 257 points (+1.59%) and the Nasdaq up 98 points (+2.21%)
What a difference a few trading days make. Last Wednesday, or right before an important bottom, I wrote the following. Financial Media Predicts Armageddon – Time To Go Long?
Open any financial media outlet and you will be hard pressed to find anything positive. So much so that quite a few prominent market “pundits” are calling for an outright financial Armageddon. Soup lines in tow.
Today, bottom callers are once again out in force. For instance, Cramer: Bullish signals to spot a raging buy Although, even though the market is now overbought, the sentiment is not as bullish as it was at the end of December or right before the most recent market collapse.
What does all of that mean?
We remain in a very complex market environment. Here is the chart I presented to you almost two weeks ago. Suggesting at the time that the market will remain within a certain trading range until the structure below (sphere) completes itself on a certain date and price. When it does, a powerful directional move will start. If you would like to find out when that PRICE/TIME arrives (to the day) and where the market will push next, please Click Here.

Now, here is a very good technical take on today’s market. I would have to agree with most things Mr.Griffiths talks about.
This conclusion is further supported by my mathematical and timing work. It clearly shows a severe bear market between 2015-2017. In fact, when it starts it will very quickly retrace most of the gains accrued over the last few years. If you would be interested in learning when the bear market of 2015-2017 will start (to the day) and its internal composition, please CLICK HERE.
(***Please Note: A bear market might have started already, I am simply not disclosing this information. Due to my obligations to my Subscribers I am unable to provide you with more exact forecasts. In fact, I am being “Wishy Washy” at best with my FREE daily updates here. If you would be interested in exact forecasts, dates, times and precise daily coverage, please Click Here). Daily Stock Market Update. February 17th, 2016 InvestWithAlex.com
Did you enjoy this article? If so, please share our blog with your friends as we try to get traction. Gratitude!!!
Investment Grin Of The Day
Russian Vs. The American Propaganda Machine
Most Americans will consider RT a Russian propaganda media outlet. Perhaps. Yet, one must then realize that western “corporate” medial outlets, all of them, do the exact same thing.
When I first told people, in 2006, that NATO will eventually wage war against Russian/China, people thought I just escaped from a mental asylum. When I first published my report Nuclear World War 3 Is Coming Soon.When, How & Why 2.5 years ago, no one believed me.
Today, NATO/US puppets Turkey and Saudi Arabia are about to find out what it is like to be on the receiving end of Russian military might. But don’t worry, the timing for the big war is not yet right, as was outlined in the report above. We still have 12-14 years to enjoy life before ICBMs star crisscrossing the oceans.
Who is to blame?
Well, I highly encourage you to watch the video below (in full) and come to your own conclusion. We are all intelligent people here it is a sad day in America when Russian media makes the hell of a lot more sense than its American counterparts.


