Disaster In The Making – Bill Gates, Jeff Bezos And Warren Buffett Are Wealthier Than Poorest Half Of US

While most Americans would celebrate the notion of being filthy stinking rich, in hopes of one day hitting it big as well, this particular situation is a disaster.  Consider the following…..

Bill Gates, Jeff Bezos and Warren Buffett are wealthier than poorest half of US

The three richest people in the US – Bill Gates, Jeff Bezos and Warren Buffett – own as much wealth as the bottom half of the US population, or 160 million people.

Analysis of the wealth of America’s richest people found that Gates, Bezos and Buffett were sitting on a combined $248.5bn (£190bn) fortune. The Institute for Policy Studies said the growing gap between rich and poor had created a “moral crisis”.

Moral crisis would be an understatement. 

The game is rigged. Sure, the individuals above are successful in their own right, but the overall wealth disparity should never approach these levels.

Again, you can blame the FED for that. The individuals above have access to zero interest rates and unlimited financing. Further, the FED’s experiment in monetary insanity we are witnessing today has inflated a financial bubble of massive proportions. Pushing the wealth of equity holders to unimaginable and highly speculative levels.

I have said this before and I will say it again. This is a disaster in the making for America and its economy. When only a few people control so much wealth, the overall economy eventually implodes. Considering the fact that most Americans are carrying heavy debt loads, the above becomes a foregone conclusion. Just a matter of time.

If you would like to find out when that happens, based on our mathematical and timing work, please Click Here.

Daily Stock Market Update & Forecast – November 8th, 2017

– State of the Market Address:

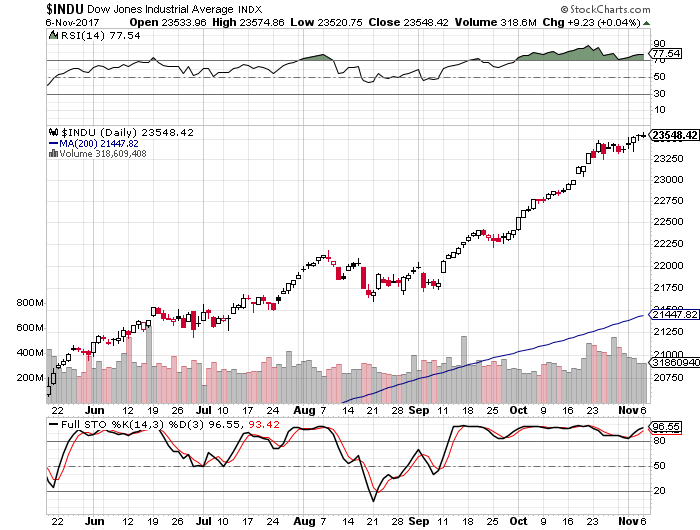
  • The Dow remains well above 23,000.
  • Shiller’s Adjusted S&P P/E ratio is now at 31.60 Now at arguably the highest level in history (if we adjust for 2000 distortions) and still above 1929 top of 29.55.
  • Weekly RSI at 82 – overbought. Daily RSI is at 78 – overbought.
  • Prior years corrections terminated at around 200 day moving average. Located at around 18,300 today (on weekly).
  • Weekly Stochastics at 98 – severely overbought. Daily at 92 – overbought.
  • NYSE McClellan Oscillator is at -22. Neutral.
  • Volatility measures VIX/VXX remains at suppressed levels. Commercial VIX long interest decreased slightly to 83K contracts net long. 
  • Last week’s CTO Reports suggest that commercials (smart money) are shifting their positioning back to net short. Short interest has shifted slightly higher during the week. For now, the Dow is 7X, the S&P is at 3X net short, Russell 2000 is now at 7.5X net short and the Nasdaq is net neutral.

In summary: For the time being and long-term, the market remains in a clear bull trend. Yet, a number of longer-term indicators suggest the market might experience a substantial correction ahead.  Plus, the “smart money” is positioning for some sort of a sell-off.

If you would like to find out exactly what happens next based on our Timing and Mathematical work, please Click Here. 


ATTENTION!!! Please note, we have moved most of our free editorial content to our new website MarketSpartans.com Please Click Here to view it.


Bond Bubble? Why The Long End Of The Yield Curve Is Likely To Collapse

Most market participants are amazed by the size of today’s so call bond market bubble. Suggesting that as soon as it blows up, yields will skyrocket and that its self will wreak havoc on the rest of the world.

Very well, but before we get to that, let’s see what Mish had to say.

I Expect New Record Low Long Bond Yield

Every attempt of the 30-Year long bond to break out of a decades-long downtrend fails. At the end of October, the long bond yield was 2.96%. Six days into November, it’s back at 2.80%. Meanwhile, short-term rates continue to rise. We are a recession away from a new record low yield on the long bond.

Despite all the economic cheerleading about the allegedly strengthening economy, I see things differently. Job growth is shrinking. Average the last two months to smooth out the hurricanes and you get growth job growth of 114,000. For now, it’s still positive.

The stock market and the 30-Year long bond yield are at odds. I believe the long bond. If the economy was truly strengthening, the yield on the long bond would not be acting like it is.

We are one recession away from a new record low yield on the long bond, and it’s coming.

We couldn’t agree more, but from a different vantage point.

The ultimate debt collapse everyone is anticipating will eventually happen, but it might not happen during this cycle.

Why? 

The massive amount of debt the FED and other central bankers have pumped into the world economy is deflationary in nature. Meaning, when the next recession comes, as it surely will, the FED will once again flood the market with free/cheap capital. Adding to already unsustainable debt levels.

For long yields to surge higher we need accelerating economy and inflationary expectations. Something we deem as impossible with most of the recent growth coming from debt. When the next recession hits, debt defaults will skyrocket. And that in itself is deflationary.

Sure, yields will eventually break  out, but it might not happen until and unless the FED begins an outright monetization of the debt. Which could be the only final solution out of this mess.

Well, in terms of the stock market, the situation is incredibly complex. If you would like to find out what happens next, based on our mathematical and timing work, please Click Here.
Daily Stock Market Update & Forecast – November 6th, 2017

– State of the Market Address:

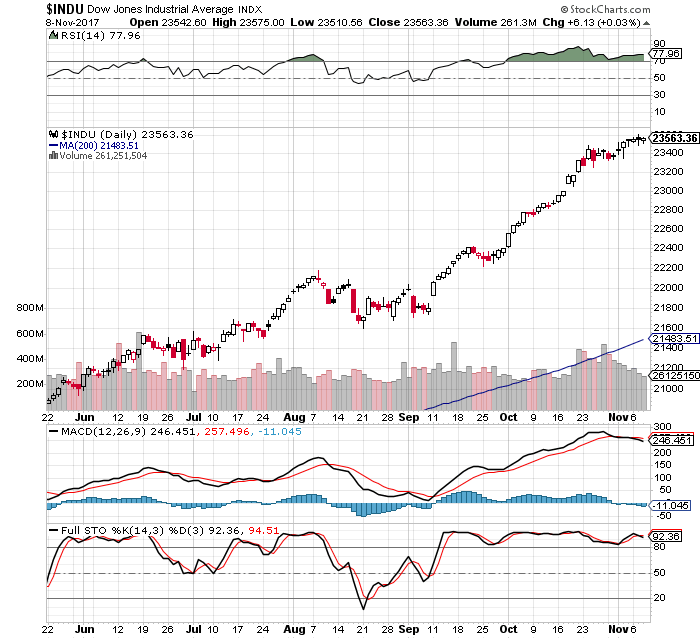
  • The Dow remains well above 23,000.
  • Shiller’s Adjusted S&P P/E ratio is now at 31.60 Now at arguably the highest level in history (if we adjust for 2000 distortions) and still above 1929 top of 29.55.
  • Weekly RSI at 82 – overbought. Daily RSI is at 77 – overbought.
  • Prior years corrections terminated at around 200 day moving average. Located at around 18,300 today (on weekly).
  • Weekly Stochastics at 99 – severely overbought. Daily at 96 – overbought.
  • NYSE McClellan Oscillator is at -14.Neutral.
  • Volatility measures VIX/VXX remains at suppressed levels. Commercial VIX long interest decreased slightly to 83K contracts net long. 
  • Last week’s CTO Reports suggest that commercials (smart money) are shifting their positioning back to net short. Short interest has shifted slightly higher during the week. For now, the Dow is 7X, the S&P is at 3X net short, Russell 2000 is now at 7.5X net short and the Nasdaq is net neutral.

In summary: For the time being and long-term, the market remains in a clear bull trend. Yet, a number of longer-term indicators suggest the market might experience a substantial correction ahead.  Plus, the “smart money” is positioning for some sort of a sell-off.

If you would like to find out exactly what happens next based on our Timing and Mathematical work, please Click Here. 


ATTENTION!!! Please note, we have moved most of our free editorial content to our new website MarketSpartans.com Please Click Here to view it.


Congratulations Janet Yellen – You Have Done The Impossible

You have inflated the largest financial bubble in human history and you’ve gotten away with it, clean and clear.  Are you going to Disneyland?

First, a rather brief history lesson…….

  • Paul  (The Iron Will) Volcker: Took office in August of 1979. Last down leg of a 1966-1982 bear market started in April of 1981. Baptized by fire 1.5 years into his tenure.
  • Alan (The Master Printer) Greenspan: Took office in August of 1987. Baptized by fire just two months later, when the crash of 1987 took place.
  • Ben (The Savior) Bernanke: Took office in February of 2006. The 2007-2009 bear leg started in October of 2007. Baptized by fire 1.75 years into his tenure.
  • Janet (Everything is Peachy) Yellen: Took office in February of 2014 to continue on with Greenspan’s and Bernanke’s insane monetary policies. No major market issues. The joke is on the next guy…..right?

White House has informed Powell he will be next Fed chief

Again, it is truly remarkable what Janet Yellen has been able to accomplish over the last four years. She was able to infuse Trillions of Dollars into the US Economy through zero interest rate policy and QE. Further, she has been able to restore investor confidence in the stock market and most other asset classes. As is evident from the Shiller’s S&P P/E ratio sitting at an all time high of 31.50.

And that might be Ms. Yellen’s biggest accomplishment. Keeping it all together and at incredible valuation levels.

Will the next guy be as lucky? 

We have our doubts……

Well, in terms of the stock market, the situation is incredibly complex. If you would like to find out what happens next, based on our mathematical and timing work, please Click Here.

Daily Stock Market Update & Forecast – November 1st, 2017

– State of the Market Address:

  • The Dow remains above 23,000.
  • Shiller’s Adjusted S&P P/E ratio is now at 31.50 Now at arguably the highest level in history (if we adjust for 2000 distortions) and still above 1929 top of 29.55.
  • Weekly RSI at 82 – overbought. Daily RSI is at 74 – overbought.
  • Prior years corrections terminated at around 200 day moving average. Located at around 18,200 today (on weekly).
  • Weekly Stochastics at 98 – severely overbought. Daily at 84 – overbought.
  • NYSE McClellan Oscillator is at -20.Neutral.
  • Volatility measures VIX/VXX remains at suppressed levels. Commercial VIX long interest decreased slightly to 85K contracts net long. 
  • Last week’s CTO Reports suggest that commercials (smart money) are shifting their positioning back to net short. Short interest has shifted slightly higher during the week. For now, the Dow is 7X, the S&P is at 3X net short, Russell 2000 is now at 9X net short and the Nasdaq is net neutral.

In summary: For the time being and long-term, the market remains in a clear bull trend. Yet, a number of longer-term indicators suggest the market might experience a substantial correction ahead.  Plus, the “smart money” is positioning for some sort of a sell-off.

If you would like to find out exactly what happens next based on our Timing and Mathematical work, please Click Here. 


ATTENTION!!! Please note, we have moved most of our free editorial content to our new website MarketSpartans.com Please Click Here to view it.


Daily Stock Market Update & Forecast – October 31st, 2017 – Elliott Wave Edition

ELLIOTT WAVE UPDATE:

Since many people have asked, I will attempt to give you my interpretation of Elliott Wave and how it is playing out in the market. First, I must admit. I don’t claim to be an EW expert, but I hope my “standard” interpretation is of help.

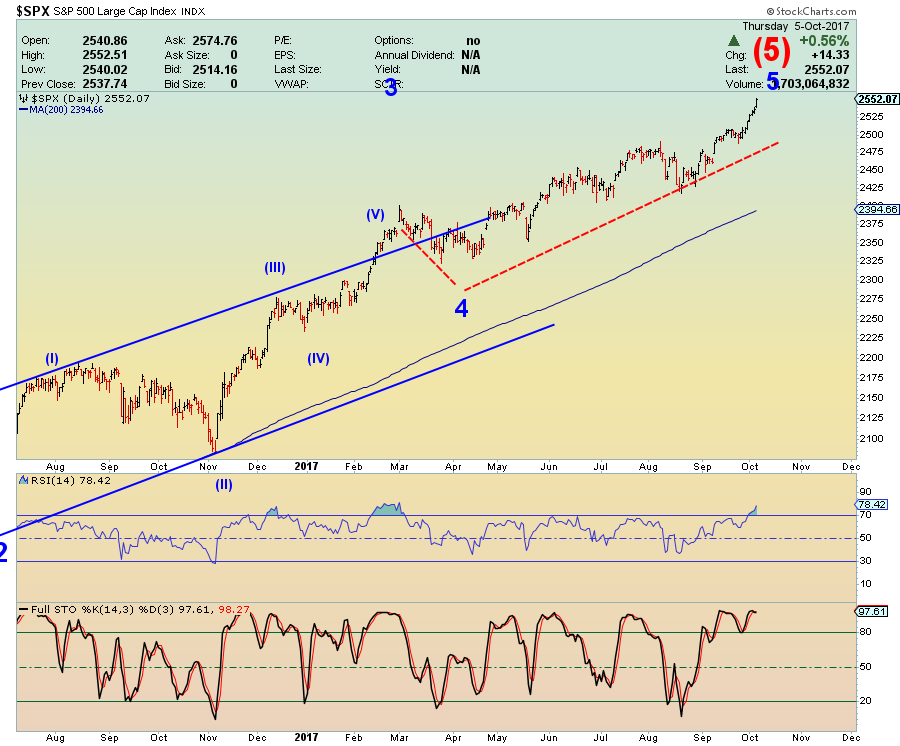
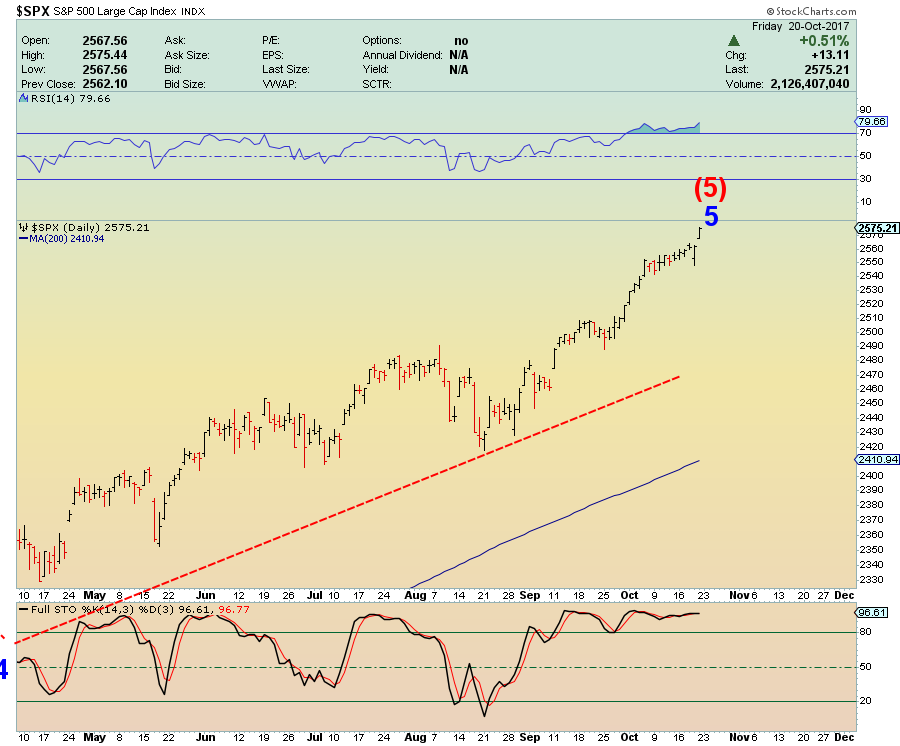
Let’s take a look at the most likely recent count on the S&P.

Explanation:

Long-Term: It appears the S&P is quickly approaching the termination point of its (5) wave up off of 2009 bottom. If true,we should see a massive sell-off later this year. Did it already complete? Click Here

Short-Term: It appears the S&P might have completed its intermediary wave 3 and now 4. It appears the market is now pushing higher to complete wave 5 of (5). If true, the above count should terminate the bull market. Did it already complete? Click Here

If you would like to find out exactly what happens next based on our Timing and Mathematical work, please Click Here. 


ATTENTION!!! Please note, we have moved most of our free editorial content to our new website MarketSpartans.com Please Click Here to view it.


Daily Stock Market Update & Forecast – October 30th, 2017

– State of the Market Address:

  • The Dow remains above 23,000.
  • Shiller’s Adjusted S&P P/E ratio is now at 31.50 Now at arguably the highest level in history (if we adjust for 2000 distortions) and still above 1929 top of 29.55.
  • Weekly RSI at 79 – overbought. Daily RSI is at 72 – overbought.
  • Prior years corrections terminated at around 200 day moving average. Located at around 18,200 today (on weekly).
  • Weekly Stochastics at 97 – severely overbought. Daily at 87 – overbought.
  • NYSE McClellan Oscillator is at -37.Neutral.
  • Volatility measures VIX/VXX remains at suppressed levels. Commercial VIX long interest decreased slightly to 85K contracts net long. 
  • Last week’s CTO Reports suggest that commercials (smart money) are shifting their positioning back to net short. Short interest has shifted slightly higher during the week. For now, the Dow is 7X, the S&P is at 3X net short, Russell 2000 is now at 9X net short and the Nasdaq is net neutral.

In summary: For the time being and long-term, the market remains in a clear bull trend. Yet, a number of longer-term indicators suggest the market might experience a substantial correction ahead.  Plus, the “smart money” is positioning for some sort of a sell-off.

If you would like to find out exactly what happens next based on our Timing and Mathematical work, please Click Here. 


ATTENTION!!! Please note, we have moved most of our free editorial content to our new website MarketSpartans.com Please Click Here to view it.