InvestWithAlex.com 

Cash Levels Crash To Historic Lows – Another Scary Red Flag?

The following article discusses this issue in greater detail…..

Investors are running out of cash — and that’s terrible news for the stock market

It’s worth noting, however, that not every Wall Street bank is sounding the alarm over low cash levels. Goldman Sachs has been a notable holdout over the past few months, even going as far as to cite “normal” cash holdings as a reason the bull market can continue for longer. Their data finds that investors seeking returns are holding cash levels that equal 3.3% of mutual fund assets, in line with recent history.

We believe it is important to consider the above as just another data point. Meaningless in itself, but powerful when combined with others. Particularly, incredibly high valuation levels and record breaking bullish sentiment. Something we have covered on this blog extensively in the past.

That is to say, what can possibly go wrong…..right?

Well, in terms of the stock market, the situation is incredibly complex. If you would like to find out what happens next, based on our mathematical and timing work, please Click Here.


Daily Stock Market Update & Forecast – October 25th, 2017

– State of the Market Address:

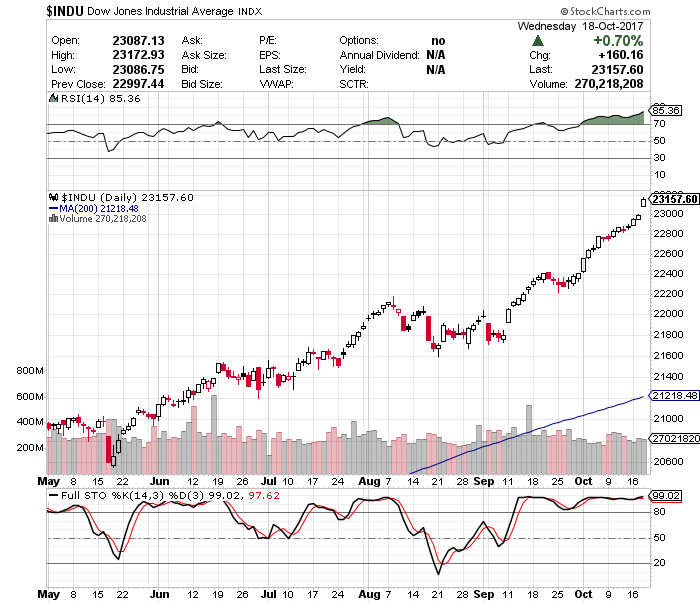
  • The Dow is now above 23,000.
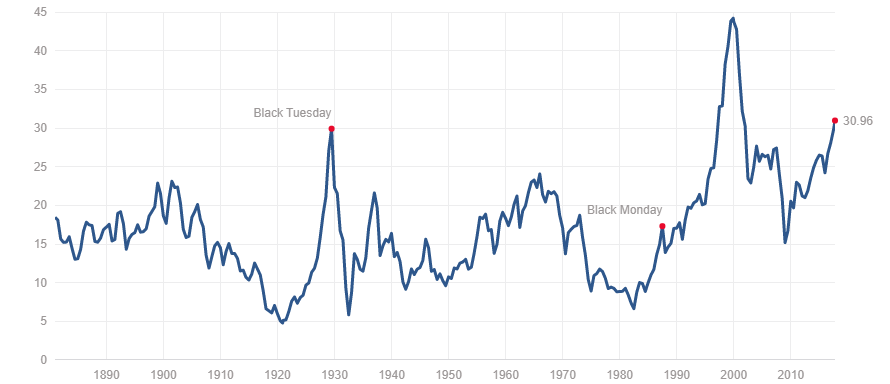
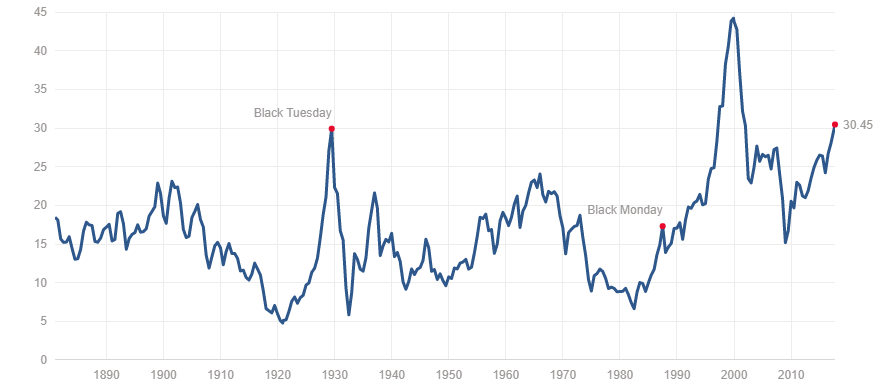
  • Shiller’s Adjusted S&P P/E ratio is now at 31.42 Now at arguably the highest level in history (if we adjust for 2000 distortions) and still above 1929 top of 29.55.
  • Weekly RSI at 76 – overbought. Daily RSI is at 81 – overbought.
  • Prior years corrections terminated at around 200 day moving average. Located at around 18,200 today (on weekly).
  • Weekly Stochastics at 97 severely overbought. Daily at 87 – overbought.
  • NYSE McClellan Oscillator is at -45.Neutral.
  • Volatility measures VIX/VXX remains at suppressed levels. Commercial VIX long interest decreased slightly to 105K contracts net long. 
  • Last week’s CTO Reports suggest that commercials (smart money) are shifting their positioning back to net short. Short interest has shifted slightly higher during the week. For now, the Dow is 8X, the S&P is at 3X net short, Russell 2000 is now at 9X net short and the Nasdaq is net neutral.

In summary: For the time being and long-term, the market remains in a clear bull trend. Yet, a number of longer-term indicators suggest the market might experience a substantial correction ahead.  Plus, the “smart money” is positioning for some sort of a sell-off.

If you would like to find out exactly what happens next based on our Timing and Mathematical work, please Click Here. 


ATTENTION!!! Please note, we have moved most of our free editorial content to our new website MarketSpartans.com Please Click Here to view it.


Is This The Most Hated Bull Market Ever – Hardly

As they say……sometimes a picture is worth a thousand words.  As is the case here.

Chart #1 is self explanatory. Most retail investors (dumb money) have never been this bullish. And while they might be on to something, at least historically, the odds are stacked against them. Chart #2: I have beaten this chart to death by now, but it is worth repeating. Today we are sitting at the highest valuation level in the stock market’s history. Higher than 1929 and arguably higher than 2000 top (if we make an adjustment for lack of tech earnings at that time).

If you will note, the bull markets of 1914, 1932, 1949, 1982, etc….have all started from incredibly low valuation levels. With P/E ratios being in 5-10 range. That is to say, those who expect this stock market to continue to surge higher, with a P/E of 31, are betting on an outcome that would be unprecedented in the stock market’s 230 year history. But, what do I know….

In terms of the stock market, the situation is incredibly complex. If you would like to find out what happens next, based on our mathematical and timing work, please Click Here.


Daily Stock Market Update & Forecast – October 18th, 2017

– State of the Market Address:

  • The Dow is now above 23,000.
  • Shiller’s Adjusted S&P P/E ratio is now at 31.17 Now at arguably the highest level in history (if we adjust for 2000 distortions) and still above 1929 top of 29.55.
  • Weekly RSI at 80 – overbought. Daily RSI is at 85 – overbought.
  • Prior years corrections terminated at around 200 day moving average. Located at around 18,200 today (on weekly).
  • Weekly Stochastics at 99 severely overbought. Daily at 99 – severely overbought.
  • NYSE McClellan Oscillator is at -10. Neutral.
  • Volatility measures VIX/VXX remains at suppressed levels. Commercial VIX long interest increased to 112K contracts net long. 
  • Last week’s CTO Reports suggest that commercials (smart money) are shifting their positioning back to net short. Short interest has shifted slightly higher during the week. For now, the Dow is 10X, the S&P is at 3X net short, Russell 2000 is now at 8X net short and the Nasdaq is net neutral.

In summary: For the time being and long-term, the market remains in a clear bull trend. Yet, a number of longer-term indicators suggest the market might experience a substantial correction ahead.  Plus, the “smart money” is positioning for some sort of a sell-off.

If you would like to find out exactly what happens next based on our Timing and Mathematical work, please Click Here. 


ATTENTION!!! Please note, we have moved most of our free editorial content to our new website MarketSpartans.com Please Click Here to view it.


Shocking: War With North Korea Will Be Devastating For The US

I am truly amazed. 

Talk to most Americans today and they will surely relay two undoubtedly true facts your way. First, North Korea is the most evil place in this galaxy and the next and must be taken care of. That in itself is debatable, but that is not our purpose here.

Second, any war with North Korea will last all of 15 minutes. With “Mission Accomplished” banners flying high the next day and North Korean children showering their American liberators with flowers of joy.

This is, how should I put it mildly, absolutely insane – IDIOCRACY. 

Any reasonable analysis would suggest we will see bloodshed on a scale we haven’t seen before. And we are almost there…..

Nuclear war may break out any moment, says N. Korean UN envoy

North Korea’s deputy UN ambassador has warned the UN General Assembly that the crisis on the Korean Peninsula “has reached the touch-and-go point and a nuclear war may break out any moment.” Kim In-ryong said North Korea is the only country in the world subjected to “such an extreme and direct nuclear threat” by the US, AP reports.

And that brings us to this gem…….

US Deploys Special Forces “Decapitation” Team To South Korea

And while details of the drill were well-known in advance, what was reported for the first time overnight from Yonhap is that a unit of U.S. special forces tasked with carrying out “decapitation” operations is also aboard a nuclear-powered submarine in the group, according to a defense source. So far, little else is known about why said decapitation team is on location, or whether it will be put into use, although it presence may explain Trump’s “calm before the storm” comment that beffudled the media two weeks ago.

Is this a bloody joke? 

Whom are they going to decapitate…..themselves? Do they expect to fly their broomsticks over one of the most militarized countries in the world, find Kim’s bunker and shoot him between the eyes? Like I have said, if this is their plan we are all about to die.

A war with North Korea is unwinnable. Period. Their terrain and 5 million strong armed force (on top of every fighting citizen) nearly assures that. Plus, analysis suggests that Russia/China will support North Korea as a proxy. Especially if the US fires first.

If the Trump Administration is stupid enough to start this war, here is what will happen….

  1. Trigger event – it can be anything at this point.
  2. US attacks North Korea with conventional weapons.
  3. North Korea nukes Seoul, Japan, Guam and possibly Hawaii. Plus, carrier groups floating nearby. It will attempt to hit the mainland, but it is unclear if they are capable. Either way, tens of thousands of Americans will die. Millions of South Koreans/Japanese.
  4. US retaliates with nuclear strikes of their own – killing millions of North Koreans.
  5. Stalemate. Kim is still sitting in his bunker and his military is waiting in the mountains. Conventional American forces are useless in North Korea – just take a look at Afghanistan.

Impossible?

NO, that is the reality about to unfold. And most Americans are not aware of the fact that Mr. Trump is about to walk us all off the cliff. And it can indeed get a lot worse.

Congress warned North Korean EMP attack would kill ‘90% of all Americans’

Are you ready? 

In terms of the stock market, the situation is incredibly complex. If you would like to find out what happens next, based on our mathematical and timing work, please Click Here.

Daily Stock Market Update & Forecast – October 12th, 2017 – Elliott Wave Edition

ELLIOTT WAVE UPDATE:

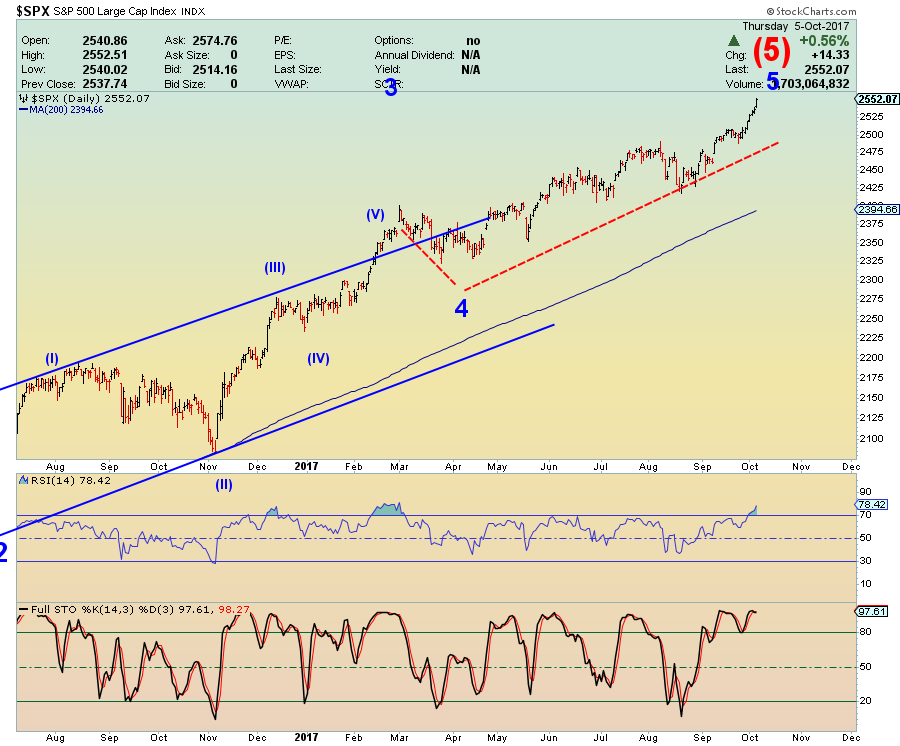
Since many people have asked, I will attempt to give you my interpretation of Elliott Wave and how it is playing out in the market. First, I must admit. I don’t claim to be an EW expert, but I hope my “standard” interpretation is of help.

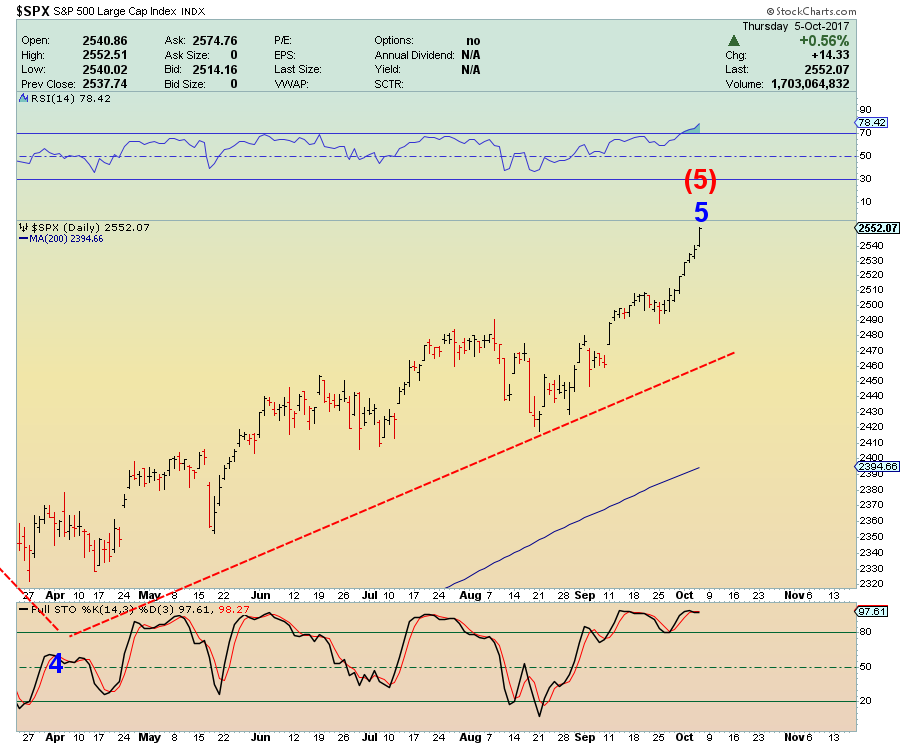
Let’s take a look at the most likely recent count on the S&P.

Explanation:

Long-Term: It appears the S&P is quickly approaching the termination point of its (5) wave up off of 2009 bottom. If true,we should see a massive sell-off later this year. Did it already complete? Click Here

Short-Term: It appears the S&P might have completed its intermediary wave 3 and now 4. It appears the market is now pushing higher to complete wave 5 of (5). If true, the above count should terminate the bull market. Did it already complete? Click Here

If you would like to find out exactly what happens next based on our Timing and Mathematical work, please Click Here. 


ATTENTION!!! Please note, we have moved most of our free editorial content to our new website MarketSpartans.com Please Click Here to view it.


Concrete Proof That President Trump Is NOT A Rational Human Being

People often ask me why I have turned on Mr. Trump after voting for him in November.

The answer is rather simple.

First, he flipped on nearly every issue he has campaigned on. Most notably, he has turned into a psychotic warmonger who has brought us all to the edge of abyss that is nuclear war.

Further, my simple analysis suggest that Trump is either a complete idiot, irrational, a liar, borderline insane and/or all of the above. 

Let me give you just two examples…..

Trump’s Touts “$5.2 Trillion” In Stock Gains, Promises More If “Congress Gives Us Massive Tax Cuts”

 “Stock Market has increased by 5.2 Trillion dollars since the election on November 8th, a 25% increase. Lowest unemployment in 16 years and if Congress gives us the massive tax cuts (and reform) I am asking for, those numbers will grow by leaps and bounds.”

“It would be really nice if the Fake News Media would report the virtually unprecedented Stock Market growth since the election.Need tax cuts”

We have discussed this before. Only a liar or a stupid person would claim ownership of this stock market bubble. Especially after suggesting that we are in a massive bubble during the presidential campaign. And only 25% increase? That’s pathetic Mr. President. It was up 200%+ under Obama.

Trump tells Hannity that Wall Street gains ‘in a sense’ are a cut in national debt

“The country, we took it over and owed over $20 trillion,” Trump said. “As you know, the last eight years, they borrowed more than it did in the whole history of our country. So they borrowed more than $10 trillion, right? And yet, we picked up $5.2 trillion just in the stock market. Possibly picked up the whole thing in the first nine months, in terms of value. So you could say, in one sense, we’re really increasing values. And maybe in a sense we’re reducing debt. But we’re very honored by it.”

Umm…..where do I even begin with this.

For those of you mathematically challenged, President Trump is basically promoting a Ponzi Finance model in order to justify his apparent success thus far. I say “thus far” because things are about to swing the other way.

So, what Mr. Trump is saying is this. Janet Yellen has printed/borrowed $10 Trillion (without counting other central fraudsters EU/JP) and the stock market has managed to increase by $5 Trillion. WOW. If we keep going on this trajectory it is just a matter of time before we all drive Ferraris and play Polo.

Again, I ask, is Mr. Trump a complete idiot, irrational, a liar, borderline insane and/or all of the above. Oh, I almost forgot, a genius playing 16–Dimensional chess we mere mortals don’t understand. You decide.

In terms of the stock market, the situation is incredibly complex. If you would like to find out what happens next, based on our mathematical and timing work, please Click Here. 

Explaining Today’s ‘Jacked Up On Steroids’ Bull Market

It is no secret that the stock market is historically overpriced. So much so that I have argued we are experiencing the highest valuation levels in history. Higher than 1929, 2007 and even 2000 (if we adjust for lack of tech earnings). Prior smaller peaks of 1937, 1966, 1972, 1987, etc…. don’t even come close.

This is best illustrated by the Shiller’s Adjusted P/E Ratio below. 

So, what gives?

First, the sentiment….. Retail investors haven’t been THIS bullish since (gulp) you know when

Since February 2016, the overall index has soared 98 points, “the largest increase in the 20-year history of the index that is not a rebound immediately after a major drop in optimism.” This is the kind of move contrarians eat up.

“In 1999 and early 2000, high enthusiasm for stocks was a powerful sign the stock-market bubble was on its last legs,” Richter said. “Of course, no one can say how much higher their enthusiasm will surge this time around. Hype works, until it doesn’t.”

Buy High Sell Low…….Right?

Second, the driving force….Central Banks Have Purchased $2 Trillion In Assets In 2017

In his latest “flow report”, BofA’s Michael Hartnett looks at the “Disconnect Myth” between rising stocks and bonds and summarizes succinctly that there is “no disconnect between stocks & bonds.”

Why? The best, and simplest, explanation for low yields & high stocks is simple: so far in 2017 there has been $1.96 trillion of central bank purchases of financial assets in 2017 alone, as central bank balance sheets have grown by $11.26 trillion since Lehman to $15.6 trillion. Hartnett concedes that the second best explanation is bonds pricing in low CPI (increasingly a new structurally low level of inflation due to tech disruption of labor force) while equities price in high EPS (with little on horizon to meaningfully reverse trend), although there is no reason why the second can’t flow from the first.

And there you have it ladies and gentlemen. 

  1. The market is incredibly expensive. Record breaking expensive. Even if we take low yields into consideration.
  2. Idiot central bankers are terrified of what happens next. Instead of letting the bubbles deflate they have juiced them to unimaginable levels. And in nearly all assets classes.
  3. So much so that most retail investors now believe stocks will never go down. And even if they do it will be a BTFD situation.

We all have been here before and we all know what happens next.  It is different this time as so many believe? Perhaps, but if you truly believe that I still have some Pets.com stock to sell you.

If you would like to find out exactly what happens next based on our Timing and Mathematical work, please Click Here.