InvestWithAlex.com 

Stock Market Update, October 25th, 2013

daily chart Oct 25, 2013

Summary: Continue to maintain a LONG/HOLD position

In the last couple of updates I have mentioned that the market will bounce to the 15,300-15,500 on the DOW in order to close all the gaps and to satisfy all of my requirements. Well, we are here, what’s next?

This is where the picture gets a little bit fuzzy.  According to my mathematical work there is no doubt that we are at the inflection point with two possible outcomes.

  1. September 2013 top was indeed the top and the bear market down leg will resume shortly.
  2. The final top (a little bit higher or lower than September 2013 top) will be set in March of 2014. Thereafter the market will roll over and begin its bear phase.

As I have mentioned many times before, my mathematical work is clearly showing that the bull is ending and the 2-3 year Bear market is just beginning.  I would call the exact date, but there is just too much interference right now.  Unless a severe down leg starts over the next 2 weeks, we will have to wait until March of 2014 for the Bear to start. Until that happens a lot of ups and downs without so much as going anywhere.  The rest of my analysis remains the same.

Over the next few weeks we will find out if the if the bear market has already started or will start in March of 2014. Should the market break below 14,600 over the next two weeks, the probability is high that we have already started the bear market leg into the final 2016 bottom.  The market is certainly going back into the 14,800 as it left a huge gap there, but a firm break below 14,600 will give us a confirmation that the bear is back.

At the same time we cannot yet ignore the technical picture with the market being near an all time high. As such, I continue to advise you to maintain a LONG/HOLD position while waiting for the confirmation that the bear market has indeed started.  

Did you enjoy this article? If so, please share our blog with your friends as we try to get traction. Gratitude!!! 

Warning: Another Hedge Fund Manager With A Perfect Track Record Is Predicting A Market Crash

CNBC Writes: Scary! This bearish call points to 40% market drop

 market crash investiwthalex

The stock market is trading at unsustainable levels that could eventually lead to a major sell-off, with a possible 40 percent drop in stock prices, hedge fund executive Mark Spitznagel told CNBC Wednesday.

“The simple answer, the mom and pop answer, I think, is just to step aside,” said Spitznagel, founder of Universa Investments and an associate of “Black Swan” pioneer Nassim Taleb.

Spitznagel, incidentally, has some Street cred when it comes to predicting downturns: He called it in 2000 and 2008 and made one of the biggest profits on Wall Street during the 2008 financial crisis, while many other investors were losing money.

Appearing on “Closing Bell,” Spitznagel suggested the Federal Reserve, which last month reaffirmed its policies on bond purchases and record-low interest rates, is basically propping up stocks and otherwise distorting the market.

“It’s a market that is sort of set up, I think, for a major crash, a major sell-off,” said Spitznagel. “I would argue all the major tops we’ve seen in the market over the last 100 years look very much like it does today.”

“The ultimate causes of crashes is the distorted environment we’re in,” he continued. 

In turn, Spitznagel recommends retail investors step aside and wait for opportunities to come.

Watch The Video Here 

I agree with his analysis 100%. The only thing I would add is my mathematical timing work. There will be a 40% decline but it will happen over the next 2-3 years and not in a crash type of an environment. It will be very similar to the 2000-2003 move.  Further, my work indicates that this decline will really get going after March of 2014.  

Did you enjoy this article? If so, please share our blog with your friends as we try to get traction. Gratitude!!!  

Warning: USD Is About To Kick Ass

CNBC Writes: De-crowning the dollar, and the ‘collapse’ ahead

 3D chrome Dollar symbol

The gradual erosion of the U.S. dollar’s status as the world’s reserve currency has been greatly hastened of late. This is due not only to the perpetual gridlock in D.C., but also our government’s inability to articulate a strategy to deal with the $126 trillion of unfunded liabilities.

Our addictions to debt and cheap money have finally caused our major international creditors to call for an end to dollar hegemony and to push for a “de-Americanized” world.

China, the largest U.S. creditor with $1.28 trillion in Treasury bonds, recently put out a commentary through the state-run Xinhua news agency stating that, “Such alarming days when the destinies of others are in the hands of a hypocritical nation have to be terminated.”

In addition, Japan (our second largest creditor holding $1.14 trillion of U.S. debt) put out a statement through its Finance Minister last week saying, “The U.S. must avoid a situation where it cannot pay, and its triple-A ranking plunges all of a sudden.”

Read The Rest Of The Article Here

I disrespectfully disagree with CNBC once again (no surprise there) for a couple of reasons.   

1.  As of  right now there is no alternative to the US Dollar to even attempt any kind of a shift. Chinese Yuan is not a freely traded currency yet and if anything it is still decades away from any sort of an attempt. Plus, China is in the midst of its own Economic Bubble that is surely to blow up soon.  Euro? Not a chance. Europe is a basket case and a one common sense politician away from breaking up.  Bottom line is, there is no currency out there to replace the USD. Yes, the US has its a share of problems, but so does everyone else.

2. USD Collapse?  What collapse?  Listen, we have to make a distinction between Credit Outstanding (which is a huge problem in the US) and the Actual Currency Dollars available. The former is a lot less than Credit Outstanding. That means the demand for USD needed to repay these huge balances will go up substantially over the next decade, pushing the dollar ever higher.

That is one of the reasons I am so bullish on the USD.  While it remains everyone’s favorite target, the USD fundamentals and technicals are looking very good. I would anticipate the USD to appreciate substantially over the next few years. 

Did you enjoy this article? If so, please share our blog with your friends as we try to get traction. Gratitude!!!  

The Secret 5 Year Stock Market Cycle and What It Is Predicting For 2014

Dow Jones Long Term Chart 2

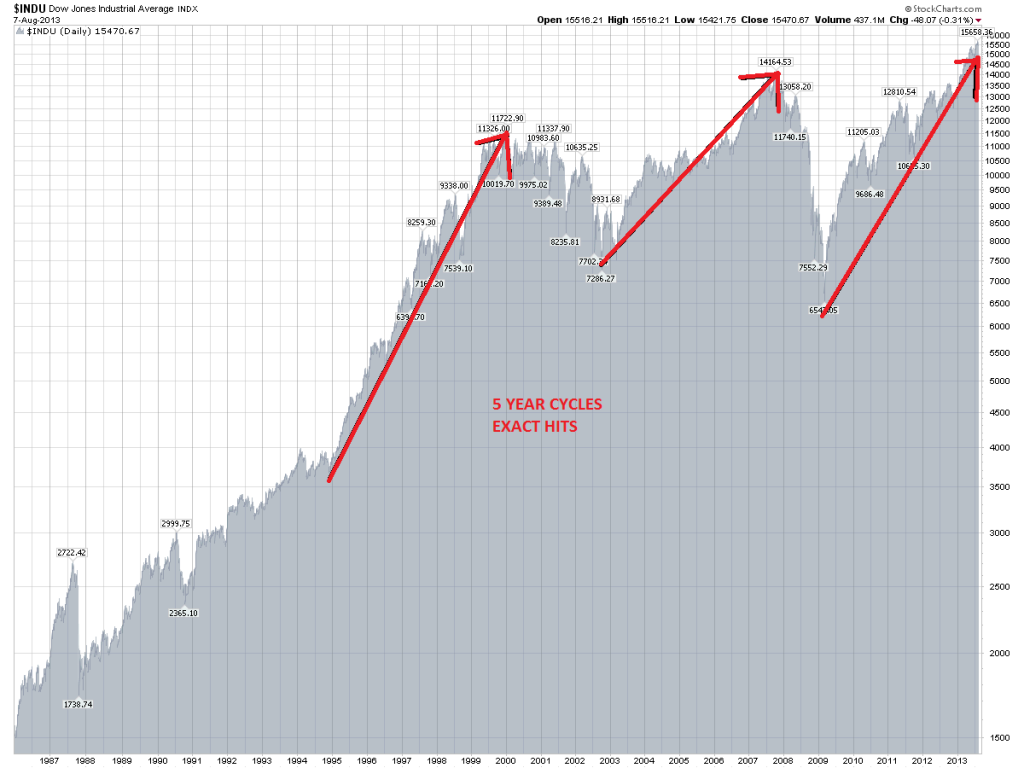
There is a prominent 5 Year stock market cycle that oscillates between the bull and the bear markets. While the cycle does show up as a bear cycle at various points, for the most part this cycle is more clearly identifiable during the bull stage. Let’s take a quick look. More importantly, let’s see what does this cycle can tell us about the future. (We are looking at the DOW)

  1. 1982-1987 From 1982 bear market bottom to pre crash 1987 the cycle lasted exactly 263 week and moved up 1977 points. That is exactly 5 Years + 10 trading days.
  2. 1994-2000 From 1994 bottom on 11/23/1994 to 01/14/2000 the market advanced 8296 points in exactly 1298 trading days. So, this cycle lasted 5 Years +32 trading days.
  3. 2002-2007 From 2002 bottom  on 10/10/2002 to 10/11/2007 top the market advanced 7209 points in exactly 1259 trading days or EXACTLY 5 years.
  4. 2009-2013/14  From 2009 bottom on 03/06/2009 to 9/18/2013 (or march 2014)  the market advanced 9241 points in 1144 days (so far).

AMAZING, isn’t it? I mean we are talking about exact hits. Bottom to top. If you go back and study the market before 1982 you will find the same cycle showing up again and again. The slight deviation by a few trading days at the end of each cycle is caused by other cycles arriving around the same time. Just by knowing this one 5 year cycle you can predict what the market will do and beat 95% of the pros.  

Now, let me warn you. This cycle is not as easy as just timing the 5 year period of time. There is something behind the scenes that causes this cycle to happen. As of right now, I cannot discuss what causes this in the public forum, but the chart above doesn’t lie. Just more prove that the market can be predicted to the day.

I confirm that another 5 year cycle has indeed started at March 2009 bottom. It is due to complete in March of 2014. However, my other work is showing that the DOW has probably already topped in September of 2013.  There is a lot of interference right now.  

As such, this leads me to believe that the DOW will oscillate here over the next few months until some sort of a top is set in March of 2014 (maybe a little bit higher or lower than September 2013 top). Thereafter, the market should resume its bear market and go down hard into the 2016/17 lows. 

Did you enjoy this article? If so, please share our blog with your friends as we try to get traction. Gratitude!!! 

The Secret 5 Year Stock Market Cycle and What It Is Predicting For 2014

Get Rid Of Bears Once and For All

CNBC Writes: Bull market’s got another 10 to 15 years left: Pro

bear attack investwithalex

The stock market is only in the second of three phases of a secular bull market, Altaira’s director of technical research, Ralph Acampora, said Monday.

“The first phase of a secular bull market is usually led by quality,” he said. “Second phase of a secular bull market, when people start to feel a little better about things, they buy secondary stocks,” Acampora said. “The third and final phase is totally greed and complacency, and we’re not even close to that. So, the secular bull market has a lot of life left.”

On CNBC’s “Fast Money,” Acampora said that his 1,800 year-end target for theS&P 500 could easily be 50 points higher.

“I’m being a little conservative. Longer term, oh, good god—much, much higher,” he said. “This is a secular bull that has at least another 10, 15 years to run.”

Umm…. CNBC you never disappoint me. I just have 1 question for your PRO.

What bull market?

Let’s take a look. Since the secular bull market top in 2000 (13-14 years ago) the

  • DOW: + 30% (sitting at a bear market top about to reverse and go below 10,000 by 2016)
  • S&P: +14% (sitting at a bear market top about to reverse and go below 1,200 by 2016)
  • NASDAQ: -20% (sitting at a bear market top about to reverse and go below 2,500 by 2016)

Once again, which bull market has another 10-15 years to go? We are not in the bull market. The markets barely moved since the 2000 secular top. Some remain in the negative territory. Perhaps they are talking about the bear market that started at 2009 bottom, but even if such is the case there is very little evidence that it was the start of a full on bull market.

The numbers and dates you see above are based on the precise mathematical work that I do. Not some arbitrary statement. If Mr. Acampora have studied the markets since its opening in 1790 he would soon realize that the bull and bear markets alternate in easy to see and understand 17 year cycles.

As such, we still have another 3-4 years of the bear left.  Don’t let the bear bite you. 

Did you enjoy this article? If so, please share our blog with your friends as we try to get traction. Gratitude!!!

 

Stock Market Update, October 18th, 2013

daily chart Oct 18, 2013

Summary: Continue to maintain a LONG/HOLD position

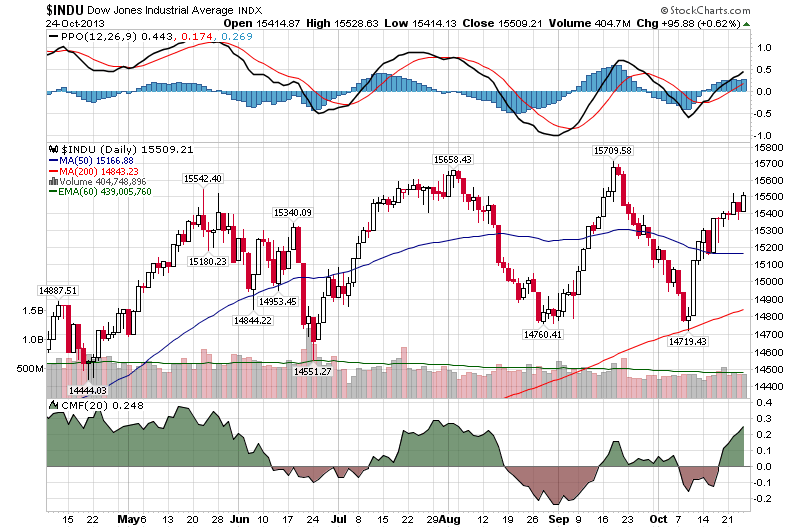
In my last weekly update I suggested that traders should set themselves up for a rally that was surely to come due to the US Government resolution. We did get that rally over the last couple of days and the DOW now sits close to the previously suggested range of 15,300-15,500.

Most importantly, we are approaching the moment of truth.

Ladies and gentleman, this is the moment we have all been waiting for. Over the next few weeks we will find out if the bear market has already started or will start in March of 2014. Should the market break below 14,600 over the next two weeks, the probability is high that we have already started the bear market leg into the final 2016 bottom.  The market is certainly going back into the 14,800 as it left a huge gap there, but a firm break below 14,600 will give us a confirmation that the bear is back.

What’s more, my timing work is giving me further confirmations that September 2013 was indeed the top. I will discuss these points over the next few weeks, but there are clear mathematical points of force that lead me to believe that a higher top on the DOW over the next couple of months is highly improbable.

At the same time we cannot yet ignore the technical picture. As such, I continue to advise you to maintain LONG/HOLD position while waiting for a confirmation that the bear market has indeed started.  

Did you enjoy this article? If so, please share our blog with your friends as we try to get traction. Gratitude!!! 
Buffett Agrees…..How US Politicians Just Destroyed America

Reuters Writes: Buffett calls threat to not raise U.S. debt limit a ‘political weapon of mass destruction

Nuclear_explosion_investwithalex

NEW YORK (Reuters) – Warren Buffett, chairman and chief executive of Berkshire Hathaway (NYS:BRK-A – News), said Wednesday that the threat of not raising the U.S. debt ceiling is a political weapon.

The idea that Congress could fail to raise the $16.7 trillion U.S. borrowing limit is a “political weapon of mass destruction,” Buffett told cable television network CNBC.

Buffett said Berkshire Hathaway owns short-term Treasury bills and is “not worried” about the bills being paid, despite concerns about the U.S. debt ceiling.

Of course Mr. Buffett is correct. What happened in Washington over the last couple of weeks is nothing short of a disaster. An absolute disaster. What Mr. Buffett forgot to mention is that this “political weapon of mass destruction” has already gone off.

Surely, the US will not default on its debt. In my previous posts I have clearly stated that neither the market nor should you care about that. The damage has already been done and will be eventually felt on a different front.  This front has to do with our creditors.  I bet you my left leg that this situation was very closely watched and analyzed by both Japan and China (two of our biggest creditors). 

Their conclusion will be very simple. Washington is being run by idiots who have no problem putting the wealth and the future of our countries at risk. Therefore, we should diversify.  I bet you my right leg that these countries will start to lessen their US Debt exposure (if they haven’t started already) as soon as possible. Interest rates will go up and that will cause a significant slow down in the US Economy and a substantial DROP in the financial markets.

BOOM. Thank you Washington.  

Did you enjoy this article? If so, please share our blog with your friends as we try to get traction. Gratitude!!!

Secret Structure Of The Upcoming Dow Decline

Dow Jones Long Term Chart


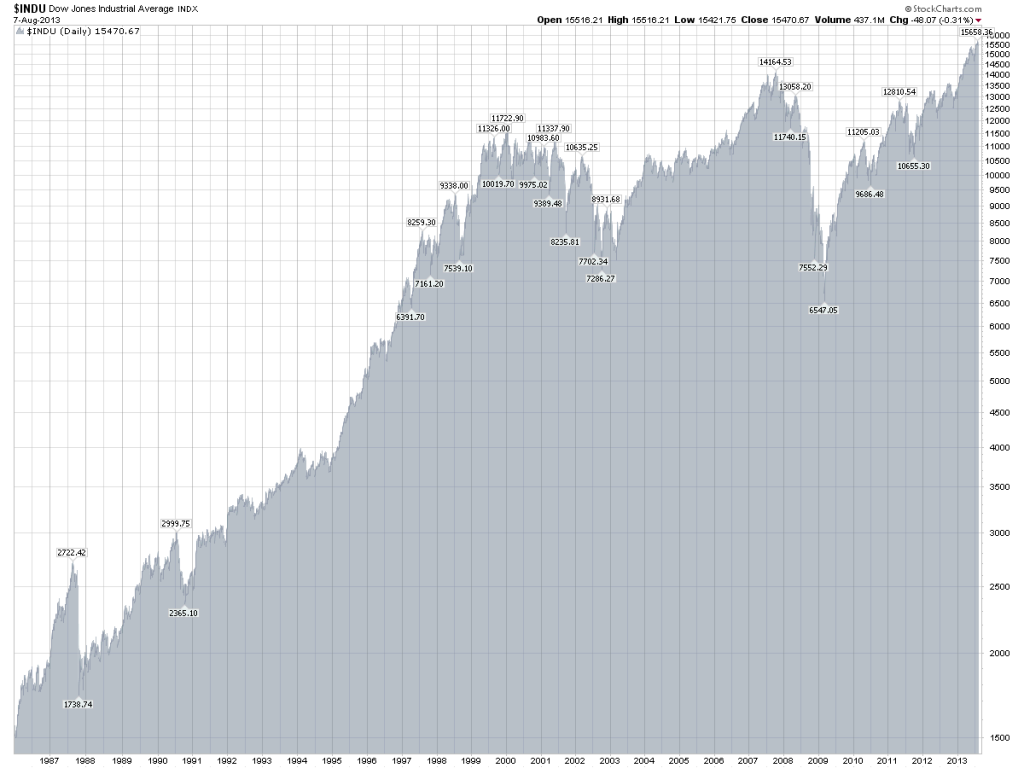
The chart above represents the Dow Jones between 1986 and today. It is clear from the chart that the bear market started at the 2000 top of 11,800 and continues on today even though we have already set two higher tops. Typically the bear/bull markets alternate in a 17 year cycles, so we have another 3-4 years to go before this bear market is over.

However, that is a side point to my main point. What I want you to observe is the structure of the declines between 2000-2003 and 2007-2009. The decline we had in early 2000’s was a more orderly decline with lots of ups and downs, plenty of time (2.5 years) and not to much directional energy. The move in 2007 was quite different. It was directional, it was short (1.5 years), it was high energy and it was violent.    

What’s the point of all of this? First, my work clearly indicates that we are about to start a 2-3 year bear market. All of my technical, fundamental and mathematical work confirm that fact. 

So, what kind of a move should we expect? 

My mathematical work shows that the bear market over the next 2-3 years will be almost identical to the 2000-2003 move. A lot of volatility, overall downtrend, but not too much downside energy. That is not to say that the market will not go low, it is to say that the move over the next few years will not be a violent one. I hope this helps. 

Did you enjoy this article? If so, please share our blog with your friends as we try to get traction. Gratitude!!! 
The Secret Of The Dow Chart

BusinessWeek Writes: Hedge Fund Chart Guru Tom DeMark Sees Dark Days Ahead

DOW JONES -invest with alex 

“The market’s going to have one more rally, then once we get above that high, I think it’s going to be more treacherous,” DeMark says. “I think it’s all preordained right now.” He feels this is probably irrespective of how and when the crippling impasse in Washington is resolved. “If you look at the new highs and new lows on the [New York Stock Exchange],” he says, “every time we made a higher high, there were fewer stocks in the index participating in that high. It’s getting narrower.” And once that happens, you typically get a collapse. The opposite looks to be true for gold, which he expects is making its low right now and should start to move up dramatically.

Read The Rest Of The Article Here

I tend to agree with Mr. DeMark to a certain extent as my own work confirms parts of his analysis. There is no doubt in my mind that we are approaching a major top here in most financial markets. Now, it is just the matter of hard work to pin point it. As I accelerate my timing work over the next few months I should have an exact answer for you by the end of the year.

With that said, there are only two possibilities here (based on my work).

1. The market has already topped. Triple tops are notoriously dangerous and tend to mark the end of a bull market. We have already set 3 tops and as I have suggested before the market finds itself in an exciting spot. We either confirm a bear market here by breaking down below recent lows over the next 4 weeks or….

2. The market will top out in March of 2014. This type of a scenario resembles Mr. DeMark’s forecast above.

Either way, we are approaching the end of a bull leg and you should begin thinking about reallocating your capital in order to avoid losses during the bear market.

Will we experience 1929 type of a decline as Tom suggest? My work doesn’t show that. It shows a slow yet volatile decline into the 8000-9000 range on the DOW over the next 2-3 years

Did you enjoy this article? If so, please share our blog with your friends as we try to get traction. Gratitude!!! 

Stock Market Update: October 10, 2013

daily chart Oct 10, 2013


Summary: Continue to maintain a LONG/HOLD position.

So far, the stock market is acting just as anticipated. In my earlier post Little Known Way To Profit From The US Government Shutdown Default Scare I have suggested that traders should set themselves up for a fast moving rally that is surely to come due to some sort of a government shutdown deal. Today we got that rally. 

With all of the major indexes up over 2%, a large portion of this move is now complete. As I have mentioned before, the market left a lot of gaps on the way down that it must close if we are to anticipate a prolonged bear market decline. If the government shutdown resolution materializes over the next few days I would expect the market to continue going up into the DOW 15500 range. Then pause and possibly reverse itself for good. 

The long term picture remains exciting. While I continue to maintain a LONG HOLD position for the time being, I believe the market is in final stages of setting itself up for beginning of a 2-3 year bear market. We are still waiting for a confirmations here, but things are looking good. Once the market tops here (assuming it won’t go over 15,700) we should start the bear leg. Triple tops are notorious for ending bull markets. 

A little secret for you here. Multiple tops are caused by various cycles hitting at different times. Each top means that the cycle has already reversed itself and is not pointing down. Once the major trend shifts it will be a powerful move down. 

For now we wait while maintaining our long position. 

Did you enjoy this article? If so, please share our blog with your friends as we try to get traction. Gratitude!!!