Everyone Is Still In The Stock Market…..Now What?

10/31/2018 – A positive day with the Dow Jones up 241 points (+0.97%) and the Nasdaq up 141 points (+2.07%)
The stock market finds itself at an incredibly important juncture. Things are about to accelerate in an unexpected way. If you would like to find out what happens next, based on our timing and mathematical work, in both price and time, please Click Here.
The bulls are breathing a sign of relief after a 1,100 point rally on the Dow over the last two days. The “Dip” is in and the market is about to surge….right? Either way, your day trading grandma is still fully invested as we try to ascertain what happens next.
U.S. HOUSEHOLDS LOADED UP ON STOCKS

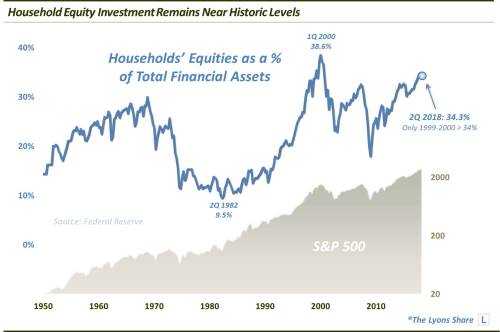
Outside of the 2000 dotcom bubble, U.S. households have never had more of their assets invested in the stock market.
The U.S. stock market, i.e., the S&P 500, soared back to new all-time highs again today – always a welcomed development for investors. And it is especially welcomed now considering the fact that investors are loaded up with stocks at the moment. That information comes courtesy of one of our favorite investment related statistics.
From the Federal Reserve’s Z.1 release, we find that U.S. Households had a reported 34.3% of their financial assets invested in the equity market as of the 2nd quarter. Outside of a slightly higher reading in the 4th quarter of 2017, that is the highest level of stock investment in the 70-plus year history of the series, other than the 1999-2000 bubble top.
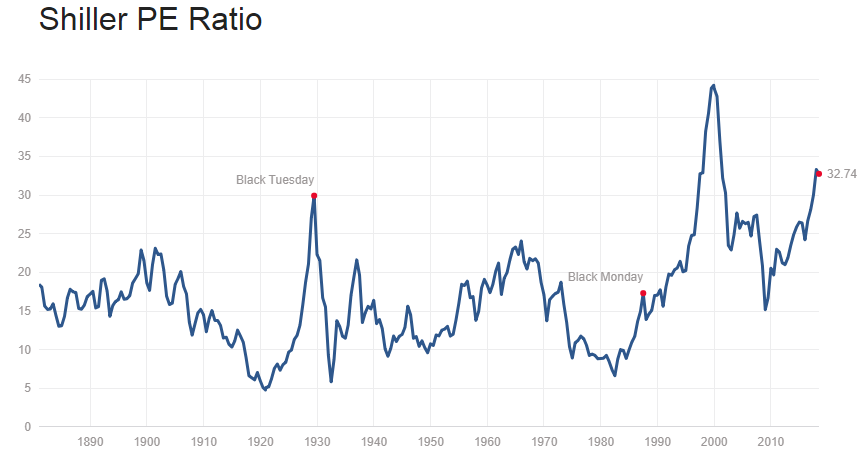
The above is consistent with numerous other indicators we have looked at before. For instance, Shiller’s Adjusted P/E Ratio is at 32 (double the mean) and arguably at the highest level in the stock market’s history (if we adjust for 2000 tech distortions).
The margin debt is nearly 2.5 times higher than it was at 2007 top and numerous bullish sentiment indicators are flashing an all time long-term highs.
In other words, despite October’s sell-off everyone is still long, strong and on margin at the highest valuation level in the stock market’s history. What can possibly go wrong?
We might have an answer.
If you would like to find our exactly what the stock market will do next, based on our mathematical and timing work, in both price and time, please Click Here
Bulls Refuse To Believe It, BTFD Is Alive & Well
Investment Wisdom Of The Day
Headlines Of Tomorrow Today: The Dow Breaks Below 20,000

10/30/2018 – A positive day with the Dow Jones up 431 points (+1.77%) and the Nasdaq up 111 points (+1.58%)
Are you ready for the next move? An all important question remains, is the bottom in or will this market crash? If you would like to find out what happens next, based on our timing and mathematical work, in both price and time, please Click Here
Now, based on longer-term sentiment readings most investors today would dismiss the Dow at 20,000 headline right off the bat. Impossible they would say, after all, markets only go up.
Here is an interesting way to look at the subject matter. 
A 20% decline on the S&P would put today’s Shiller Adjusted S&P P/E Ratio at about 27. Or about 70% above its mean, above 1968 peak, above 2007 peak and a stone throw away from 1929 peak.
I know darling, I know……earnings will surge higher…..right…..or will they?
Luckily, you don’t have to guess about what happens next. If you would like to find out what the stock market will do next, in both price and time, based on our timing and mathematical work, please Click Here
Ron Paul Explains Why Trump Is Right, The Fed Is Indeed Crazy
Investment Grin Of The Day
No One Expects A Bear Market – Should You?

10/29/2018 – A negative day with the Dow Jones down 245 points (-0.99%) and the Nasdaq down 117 points (-1.63%)
We have been warning you for months that the stock market was about to move. An important question remains, is the bottom in or will this market crash? If you would like to find out what happens next, based on our timing and mathematical work, in both price and time, please Click Here
After looking at hundreds of financial articles today alone it dawned on me that no one, and I mean no one, is expecting anything but a small correction here. For instance…..
Waiting for the stock market to bottom will ‘feel awful, like it always does’
Meanwhile, there are only three catalysts capable of lifting stocks from their current rout, he said: 1) a Republican sweep in the Nov. 6 midterm elections; 2) the Fed adopting a more dovish, “data-driven” stance; and 3) a resolution of the U.S.-China trade spat.
“Since none of these appear imminent over coming days/weeks, the bottoming process is going to feel awful—like it always does,” Dwyer wrote.
Market Correction Or Temporary Pullback? Our Views On The Current Selloff
The markets have been very volatile lately and we have seen a significant pullback this month. I know that many of you are feeling anxious about the recent market volatility. I understand it completely. It is very difficult to have a down day, and we have had several days of panic selling this month so far.
On Friday, almost all the financial news media started flashing that the “S&P 500 index is now officially in correction territory.” The media likes to flash negative news, and this is one of them too. The definition of a market correction is usually a pullback of 10% to 20% from the most recent highs (closing price).
Correction or Temporary Pullback? The author doesn’t even consider the possibility of a vicious/deep bear market.
For GOD’s sake, the market is down 10% and everyone is already looking for a long-term bottom and a subsequent rally. No one remembers the horrors of 2000 and 2008 and what a 50-90% corrections feel like.
The above is indicative of extreme bullish sentiment still prevalent in the market today.
Luckily, you don’t have to guess about what happens next. If you would like to find out what the stock market will do next, in both price and time, based on our timing and mathematical work, please Click Here


