Microsoft Highlights Just How Crazy Today’s Stock Market Bubble Is – Daily Update

6/5/2018 – A mixed day with the Dow Jones down 14 points (-0.06%) and the Nasdaq up 31 points (+0.41%)
How crazy is today’s stock market bubble?
Not crazy at all if you listen to the bulls. According to many of them the stock market is undervalued and tech blue chip companies like Apple and Microsoft are providing a once in a life time buying opportunity.
Really?
Let’s explore this notion a little by looking at Microsoft and their bizarre $3 Billion GitHum acquisition offer. Here is a very good look at the subject matter.
Microsoft`s recent purchase of GitHub for for 7.5 Billion in stock tells us a couple of things about financial markets right now. Namely, the number being discussed for GitHub was around 3 Billion, and Microsoft overpaid by 4.5 Billion. But did they, as Microsoft which is sitting at $102 a share with a p/e of 83, yes an 80 p/e handle depending on how you calculate this metric, that is how big a bubble there is right now in these blue chip technology stocks.
Microsoft is the same stodgy mature technology company that traded in a range of $22 a share to $32 a share on a good quarter for the longest time. The only thing that changed is the ECB buying 90 Billion Euros of assets each month and the Swiss National Bank not wanting the Swiss Franc to appreciate (get too strong) versus the Euro, so they created money out of thin air in terms of Swiss Francs, sold these to artificially weaken their currency, thus buying US Dollars, and then happily buying Microsoft stock, and Apple, etc., etc.
In fact, every technology company should buy anyone they want to acquire right now because all their shares are going to be dropping precipitously over the next three years as the technology 2.0 market crash begins. Artificially high paper gains never last and high P/E Ratios for declining revenue growth companies like Microsoft, Apple, Intel, Cisco and the like all revert back to historical norms. Your stock prices are all artificially high due to the Central Bank Liquidity Punchbowl Bonanza so overpaying for companies with future worthless stock is a good idea, and essentially a freeroll.
We couldn’t agree more.
What you seeing today is distortion in nearly all asset classes to the 10th degree. Thanks to the FED and their insane monetary policies. No secret there.
The real trick in knowing when this massive speculative house of cards will come crashing down. If you would like to get that information based on our timing and mathematical work, please CLICK HERE
Why Only Fools Are Cheering Trump’s “Incredibly Strong & Amazing” Jobs Report
As Mr. Trump himself says, this is THE BEST job market and unemployment figure in the history of the Union. I guess it would be pointless to point out that Mr. Trump had very little to do with the above as his predecessor and the FED were basically responsible for bringing the unemployment down from over 10% in 2009-10 to what it is today. In other words, Mr. Trump is jumping on a massive freight train speeding down and claiming responsibility.
We are also very much aware of the numerous problems associated with the official unemployment number. Such as 100+ Million Americans being out of a labor force ( a record), our middle class collapsing and 78 Million Americans Hustling Dimes.
As much as the above stings, history suggests things are about to get a lot worse. You see, jobs are a lagging indicator. The unemployment rate always bottoms when the stock market peaks. That is to say, instead of cheering this number investors should approach it with concern.
Investment Grin Of The Day
What Today’s Divergences Mean For The Stock Market – Daily Update

A positive day with the Dow Jones up 178 points (+0.72%) and the Nasdaq up 52 points (+0.69%)
Today’s analytical environment is anything but simple. Both bulls and bears can very well argue their cases without ever coming close to any sort of a consensus.
For instance, while the Dow/S&P remain range bound and far from their all time highs, the Russell/Nasdaq are either hitting or near their respective all time highs.
Undoubtedly followed by an uncomfortable Booyyyaaahhh screams coming out of Jim Cramer’s CNBC studio.
At the same time the valuations are mind boggling. Forget about Shiller’s Adjusted S&P P/E of 33 (arguably the highest in history), the Russell 2000 is selling at 100+ times earnings. Much more, about 150+ if we take out certain accounting gimmicks.
Paging Warren Buffett…….is that a good value?
We pray that Mr. Buffett does not see this silly question as his older hearth might not be able to take it, but the real concern remains.
No matter what the bulls say we are in a massive bubble of historic proportions. When the history books are written future generations of investors will laugh at fools and robo-machines paying 100+ time highly speculative earnings.
Further, the divergences we are seeing between highly speculative indices and their more established cousins are too be expected as the specs do tend to peak after major indices put in their respective tops.
Perhaps no amount of financial analysis can summarize today’s environment better than the picture below.

If you would like to find out what happens next and most importantly WHEN, please CLICK HERE
Investment Grin Of The Day
Investment Grin Of The Day
Daily Stock Market Update & Forecast – May 29th, 2018
 – State of the Market Address:
- The Dow is back below 25,000
- Shiller’s Adjusted S&P P/E ratio is now at 32.14. Slightly off highs, but still arguably at the highest level in history (if we adjust for 2000 distortions) and still above 1929 top of 29.55.
- Weekly RSI at 50 – neutral. Daily RSI is at 44 – neutral.
- Prior years corrections terminated at around 200 day moving average. Located at around 19,500 today (on weekly).
- Weekly Stochastics at 51 – neutral. Daily at 48 – neutral.
- NYSE McClellan Oscillator is at -5 – Neutral.
- Commercial VIX interest is now net neutral.
- Last week’s CTO Reports suggest that commercials (smart money) have, more or less, shifted back to a net short position. For now, the Dow is net neutral, the S&P is at 2.5X net short, Russell 2000 is 4X net short and the Nasdaq is 2X net long.
If you would like to find out exactly what happens next based on our Timing and Mathematical work, please Click Here.
ATTENTION!!! Please note, we have moved most of our free editorial content to our new website MarketSpartans.com Please Click Here to view it.
Investment Grin Of The Day
Weekly Stock Market Update & Forecast – May 25th, 20018
 – State of the Market Address:
- The Dow is back below 25,000
- Shiller’s Adjusted S&P P/E ratio is now at 32.34. Slightly off highs, but still arguably at the highest level in history (if we adjust for 2000 distortions) and still above 1929 top of 29.55.
- Weekly RSI at 54 – neutral. Daily RSI is at 54 – neutral.
- Prior years corrections terminated at around 200 day moving average. Located at around 19,500 today (on weekly).
- Weekly Stochastics at 57 – neutral. Daily at 72 – neutral.
- NYSE McClellan Oscillator is at +1 – Neutral.
- Commercial VIX interest is now net neutral.
- Last week’s CTO Reports suggest that commercials (smart money) have, more or less, shifted back to a net short position. For now, the Dow is net neutral, the S&P is at 2.5X net short, Russell 2000 is 4X net short and the Nasdaq is 2X net long.
If you would like to find out exactly what happens next based on our Timing and Mathematical work, please Click Here.
ATTENTION!!! Please note, we have moved most of our free editorial content to our new website MarketSpartans.com Please Click Here to view it.
ELLIOTT WAVE UPDATE:
Since many people have asked, I will attempt to give you my interpretation of Elliott Wave and how it is playing out in the market. First, I must admit. I don’t claim to be an EW expert, but I hope my “standard” interpretation is of help.
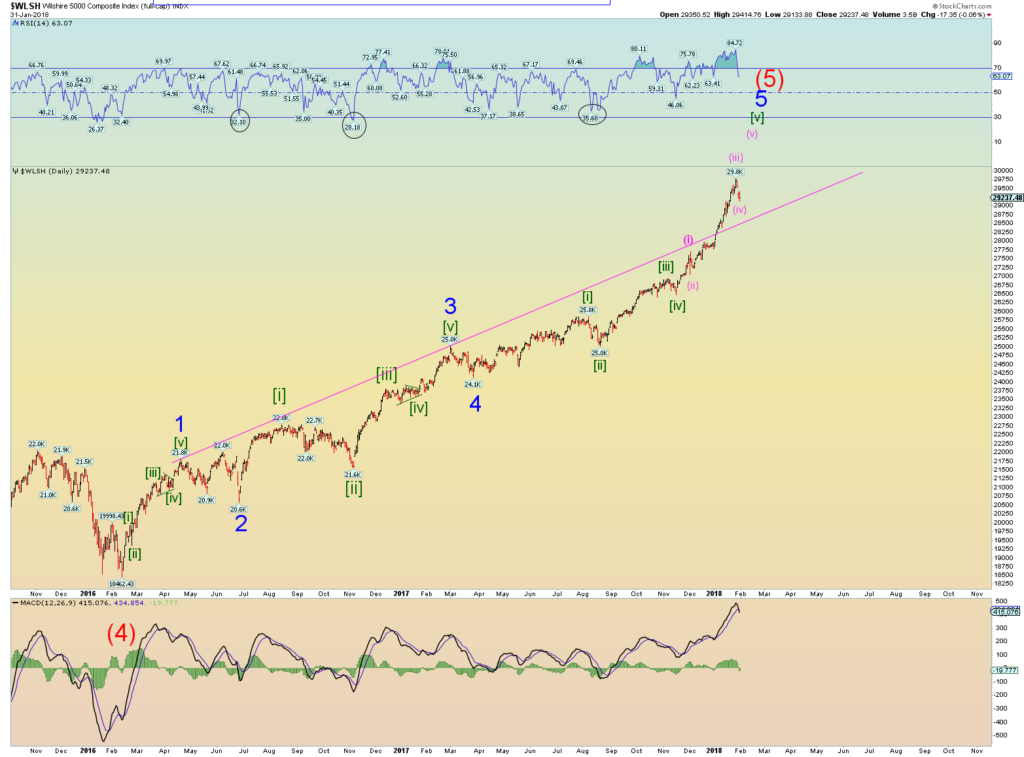
Let’s take a look at the most likely recent count on the Wilshire 5000.
Explanation:
Long-Term: It appears the Wilshire 5000 is quickly approaching the termination point of its (5) wave up off of 2009 bottom. If true,we should see a massive sell-off later this year. Did it already complete? Click Here
Short-Term: It appears the Wilshire 5000 might have completed its intermediary wave 3 and now 4. It appears the market is now pushing higher to complete wave 5 of (5). If true, the above count should terminate the bull market. Did it already complete? Click Here

If you would like to find out exactly what happens next based on our Timing and Mathematical work, please Click Here.
ATTENTION!!! Please note, we have moved most of our free editorial content to our new website MarketSpartans.com Please Click Here to view it.


