Ron Paul Is Stunned & Troubled By Trump’s Sudden Thirst For WAR
Investment Grin Of The Day
After Pumping The Market For Months Trump Warns Investors To Prepare For Pain – Should You?
Daily Stock Market Update & Forecast – April 10th, 2018
ELLIOTT WAVE UPDATE:
Since many people have asked, I will attempt to give you my interpretation of Elliott Wave and how it is playing out in the market. First, I must admit. I don’t claim to be an EW expert, but I hope my “standard” interpretation is of help.
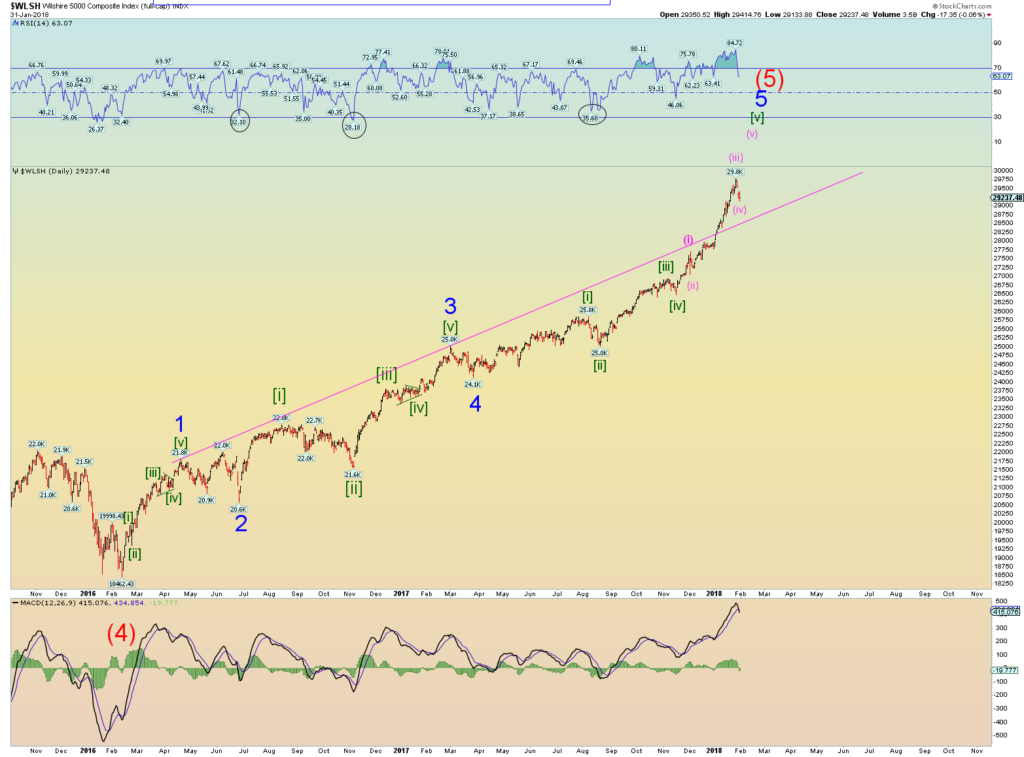
Let’s take a look at the most likely recent count on the Wilshire 5000.
Explanation:
Long-Term: It appears the Wilshire 5000 is quickly approaching the termination point of its (5) wave up off of 2009 bottom. If true,we should see a massive sell-off later this year. Did it already complete? Click Here
Short-Term: It appears the Wilshire 5000 might have completed its intermediary wave 3 and now 4. It appears the market is now pushing higher to complete wave 5 of (5). If true, the above count should terminate the bull market. Did it already complete? Click Here

If you would like to find out exactly what happens next based on our Timing and Mathematical work, please Click Here.
ATTENTION!!! Please note, we have moved most of our free editorial content to our new website MarketSpartans.com Please Click Here to view it.
Investment Grin Of The Day
Daily Stock Market Update & Forecast – April 9th, 2018

– State of the Market Address:
- The Dow is back below 24,000
- Shiller’s Adjusted S&P P/E ratio is now at 31.34 Slightly off highs, but still arguably at the highest level in history (if we adjust for 2000 distortions) and still above 1929 top of 29.55.
- Weekly RSI at 48 – neutral. Daily RSI is at 44 – neutral.
- Prior years corrections terminated at around 200 day moving average. Located at around 19,000 today (on weekly).
- Weekly Stochastics at 15 – oversold. Daily at 52 – neutral.
- NYSE McClellan Oscillator is at +2 Neutral.
- Commercial VIX interest is now 70K contracts net short.
- Last week’s CTO Reports suggest that commercials (smart money) have, more or less, shifted back into a net bearish position. For now, the Dow is 2X net short, the S&P is at 4X net short, Russell 2000 is 2X net short and the Nasdaq is 2X net long.
Having said that, if you would like to find out exactly what happens next based on our Timing and Mathematical work, please Click Here.
ATTENTION!!! Please note, we have moved most of our free editorial content to our new website MarketSpartans.com Please Click Here to view it.
3 Days Ago – Russian Top Brass Warn Al-Nusra, Free Syrian Army Plotting Chemical Attacks In Syria
Watch the video above. We are not there yet, but we are getting there really fast.
I am not very smart, some would even say I am an idiot, but lets use this fact to our advantage when we try to analyze current events.
So, Assad, with help from Russia, has basically won the war in Syria. Something we have analyzed here on numerous occasions.
So much so that President Trump has announced last week of Trump call for quick withdrawal from Syria faced unanimous opposition from top officials: report
Now, this is where it gets interesting. As mentioned on numerous occasions on our sister site, marketspartans.com, Russian and Syrian government have warned of an upcoming false flag chemical attack in Syria by opposition forces to draw the US back in. Russian top brass warn al-Nusra, Free Syrian Army plotting chemical attacks in Syria
And that brings us to this……
Trump threatens “Animal Assad,” Putin over alleged chemical attack in Syria
Now, I know that this is incredibly hard, but lets go ahead and put our critical thinking hats on. Or, as CIA would call it, tin foil hats.
Russia and Syria have won the war. They are probably just a few months away from consolidating 100% of the country under their control. The US is leaving and warmongers are screaming bloody murder.
Once again, why in the world would Russia/Syria stage a chemical attack against their own people?
This is lunacy and they wouldn’t.
Who would, assuming there was an attack at all? Well, follow the money of outspoken warmongers in Washngton, Military Industrial Complex, Israel and Saudi Scumrabia.
Conclusion, the Deep State isn’t even trying to hide this BS in their ever constant drive for war and bloodshed. The problem is, the next war will end us all. As Was Clearly Outlined Here.
Investment Grin Of The Day
The Shocking Truth Behind This Week’s Turbulence – Here Is What Happens Next

This week left most people dazed and confused, in terms of what is going on in the stock market.
From one vantage point the action was net positive. After all, Trump’s trade war, massive debt increases, slowing earnings/GDP and general overvaluation have failed to push this market much lower.
On the flip side, something is seriously wrong. Even legendary investor and Vanguard founder Jack Bogle jumped in by suggesting Bogle on stock turbulence: ‘never seen a market this volatile to this extent in my career’
Here is one possible explanation……The FED is no longer floating this market, just the opposite…..
Fed’s QE-Unwind Proceeds Despite Stock Market Sell-Offs (chart above)
The sixth month of the QE-Unwind ended on March 31, which is reflected in the Fed’s balance sheet, released this afternoon, for the week ending April 4. The QE-Unwind appears to be on automatic pilot, clicking along at the pace that accelerated in January, despite the sporadic stock market sell-offs since early February.
During the years of QE, the Fed acquired a total of $3.4 trillion in Treasury securities and mortgage-backed securities. The MBS are backed by mortgages that are guaranteed by Fannie Mae, Freddie Mac, and Ginnie Mae. Now the Fed is shedding those securities at a rate that accelerates every quarter until it reaches its maximum pace of up to $50 billion a month in Q4 2018.
Very well…….
Now, lets pile on Trump’s trade war, historically high valuation levels (arguably the highest in history), massive debt increases and trade deficits, rising interest rates, slowing corporate earnings growth/GDP, skyrocketing geopolitical risks, etc…..
AND……
Well, you have a potential for a really bloody stock market crash.
If you would like to find out if the stock market is about to crash or surge up the wall of worry instead, please Click Here

– State of the Market Address:
- The Dow is back below 24,000
- Shiller’s Adjusted S&P P/E ratio is now at 31.34 Slightly off highs, but still arguably at the highest level in history (if we adjust for 2000 distortions) and still above 1929 top of 29.55.
- Weekly RSI at 48 – neutral. Daily RSI is at 44 – neutral.
- Prior years corrections terminated at around 200 day moving average. Located at around 19,000 today (on weekly).
- Weekly Stochastics at 15 – oversold. Daily at 52 – neutral.
- NYSE McClellan Oscillator is at +2 Neutral.
- Commercial VIX interest is now 70K contracts net short.
- Last week’s CTO Reports suggest that commercials (smart money) have, more or less, shifted back into a net bearish position. For now, the Dow is 2X net short, the S&P is at 4X net short, Russell 2000 is 2X net short and the Nasdaq is 2X net long.
Having said that, if you would like to find out exactly what happens next based on our Timing and Mathematical work, please Click Here.
ATTENTION!!! Please note, we have moved most of our free editorial content to our new website MarketSpartans.com Please Click Here to view it.


