InvestWithAlex.com 

Daily Stock Market Update & Forecast – March 28th, 2018

– State of the Market Address:

  • The Dow is back below 24,000
  • Shiller’s Adjusted S&P P/E ratio is now at 31.85 Slightly off highs, but still arguably at the highest level in history (if we adjust for 2000 distortions) and still above 1929 top of 29.55.
  • Weekly RSI at 48 – neutral. Daily RSI is at  39 – neutral.
  • Prior years corrections terminated at around 200 day moving average. Located at around 19,000 today (on weekly).
  • Weekly Stochastics at 23  – oversold. Daily at 24 – oversold.
  • NYSE McClellan Oscillator is at -36 Neutral.
  • Commercial VIX interest is now 38K contracts net short.
  • Last week’s CTO Reports suggest that commercials (smart money) have, more or less, shifted back into a net bearish position.  For now, the Dow is 2X net short, the S&P is at 5X net short, Russell 2000 is 4X net short and the Nasdaq is neutral.

Having said that, if you would like to find out exactly what happens next based on our Timing and Mathematical work, please Click Here. 


ATTENTION!!! Please note, we have moved most of our free editorial content to our new website MarketSpartans.com Please Click Here to view it. 

Z30

Daily Stock Market Update & Forecast – March 27th, 2018

ELLIOTT WAVE UPDATE:

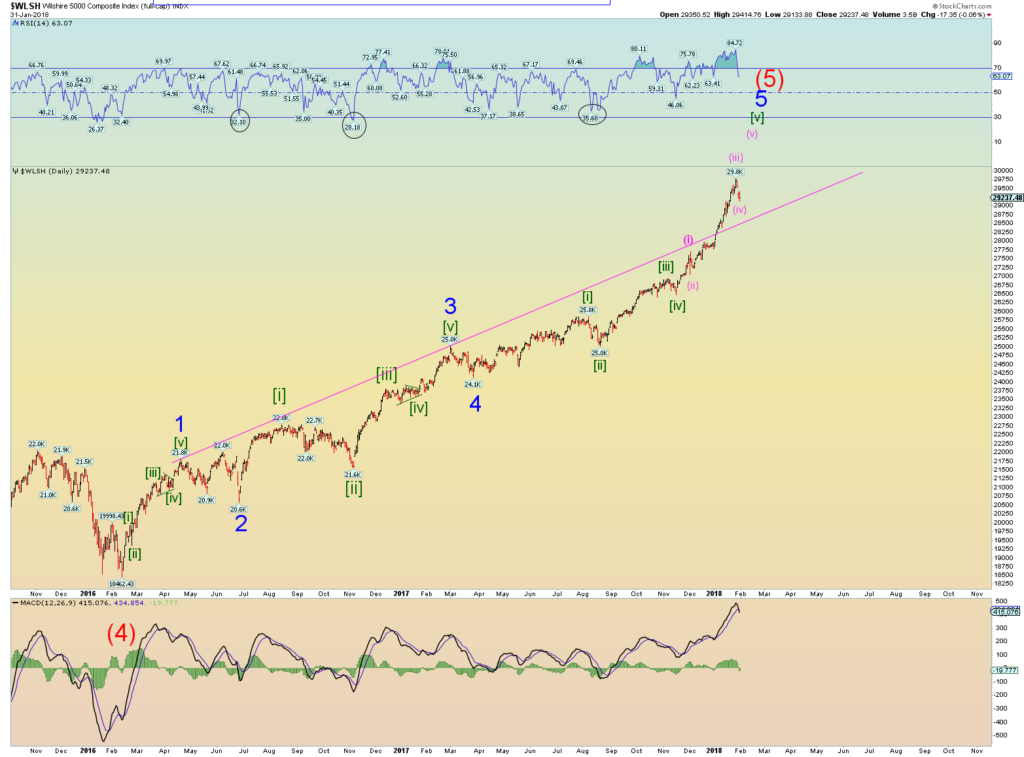
Since many people have asked, I will attempt to give you my interpretation of Elliott Wave and how it is playing out in the market. First, I must admit. I don’t claim to be an EW expert, but I hope my “standard” interpretation is of help.

Let’s take a look at the most likely recent count on the Wilshire 5000.

Explanation:

Long-Term: It appears the Wilshire 5000 is quickly approaching the termination point of its (5) wave up off of 2009 bottom. If true,we should see a massive sell-off later this year. Did it already complete? Click Here

Short-Term: It appears the Wilshire 5000 might have completed its intermediary wave 3 and now 4. It appears the market is now pushing higher to complete wave 5 of (5). If true, the above count should terminate the bull market. Did it already complete? Click Here

If you would like to find out exactly what happens next based on our Timing and Mathematical work, please Click Here. 


ATTENTION!!! Please note, we have moved most of our free editorial content to our new website MarketSpartans.com Please Click Here to view it. 

Z31

This Is What Trump’s Mental Constipation Looks Like

When I saw Trump’s tweet below last night my head nearly exploded. A number of interesting question proceeded to flood in…… Is he for real? What kind of a freaking moron would claim ownership of the Dow’s daily move? Did he forget the Dow dropped 1,400 points last week alone and 3,000+ points since its top in January?

MAGA?

The same logic would suggest Mr. Trump will take ownership of every single bounce the market will stage on the way down. The Dow at 20,000 – MAGA, 18,000 – MAGA, 15,000-MAGA, etc…

You get the picture. My view is rather simple. President Trump is a fool who has no idea how financial markets work or what comes next. Perhaps the real idiot here is yours truly, for voting for the guy in 2016.

Z30

Daily Stock Market Update & Forecast – March 26th, 2018

– State of the Market Address:

  • The Dow is back above 24,000
  • Shiller’s Adjusted S&P P/E ratio is now at 31.95 Slightly off highs, but still arguably at the highest level in history (if we adjust for 2000 distortions) and still above 1929 top of 29.55.
  • Weekly RSI at 50 – neutral. Daily RSI is at  43 – neutral.
  • Prior years corrections terminated at around 200 day moving average. Located at around 19,000 today (on weekly).
  • Weekly Stochastics at 27  – oversold. Daily at 13 – oversold.
  • NYSE McClellan Oscillator is at -30 Neutral.
  • Commercial VIX interest is now 38K contracts net short.
  • Last week’s CTO Reports suggest that commercials (smart money) have, more or less, shifted back into a net bearish position.  For now, the Dow is 2X net short, the S&P is at 5X net short, Russell 2000 is 4X net short and the Nasdaq is neutral.

Having said that, if you would like to find out exactly what happens next based on our Timing and Mathematical work, please Click Here. 


ATTENTION!!! Please note, we have moved most of our free editorial content to our new website MarketSpartans.com Please Click Here to view it. 
Z30

Is Another Black Monday Imminent?

Mark Twain used to say, “October. This is one of the peculiarly dangerous months to speculate in stocks. The others are July,JanuarySeptemberApril, November, MayMarchJuneDecemberAugust, and February.”

Well, it can be said that Monday is one of the peculiarly dangerous days to speculate in stocks. Followed by Thursday, Friday, Wednesday and Tuesday.

Yes, we are talking about Black Monday of  October 19, 1987, when stock markets around the world crashed, with the Dow shredding 23% of its value in one day. 

Why?

Today’s stock market finds itself at an incredibly important juncture. 

That is to say, the stock market of today is nearly identical to pre-crash 1987. At least structurally speaking. As the chart below suggests, should the Dow take out February low and its 200 day moving average (located at the same level), there is no saying in how fast the Dow will drop and how low it will go.

Having said that, if you would like to find out what happens next, based on our mathematical and timing work, please Click Here

Now, back to our regular stock market update……

– State of the Market Address:

  • The Dow is back below 24,000
  • Shiller’s Adjusted S&P P/E ratio is now at 31.59 Slightly off highs, but still arguably at the highest level in history (if we adjust for 2000 distortions) and still above 1929 top of 29.55.
  • Weekly RSI at 45 – neutral. Daily RSI is at 31 – oversold
  • Prior years corrections terminated at around 200 day moving average. Located at around 19,000 today (on weekly).
  • Weekly Stochastics at 38  – neutral. Daily at 13 – oversold.
  • NYSE McClellan Oscillator is at -66 Neutral.
  • Commercial VIX interest is now 38K contracts net short.
  • Last week’s CTO Reports suggest that commercials (smart money) have, more or less, shifted back into a net bearish position.  For now, the Dow is 2X net short, the S&P is at 5X net short, Russell 2000 is 4X net short and the Nasdaq is neutral.

Having said that, if you would like to find out exactly what happens next based on our Timing and Mathematical work, please Click Here. 


ATTENTION!!! Please note, we have moved most of our free editorial content to our new website MarketSpartans.com Please Click Here to view it. 

Z30

Daily Stock Market Update & Forecast – March 22nd, 2018

ELLIOTT WAVE UPDATE:

Since many people have asked, I will attempt to give you my interpretation of Elliott Wave and how it is playing out in the market. First, I must admit. I don’t claim to be an EW expert, but I hope my “standard” interpretation is of help.

Let’s take a look at the most likely recent count on the Wilshire 5000.

Explanation:

Long-Term: It appears the Wilshire 5000 is quickly approaching the termination point of its (5) wave up off of 2009 bottom. If true,we should see a massive sell-off later this year. Did it already complete? Click Here

Short-Term: It appears the Wilshire 5000 might have completed its intermediary wave 3 and now 4. It appears the market is now pushing higher to complete wave 5 of (5). If true, the above count should terminate the bull market. Did it already complete? Click Here

If you would like to find out exactly what happens next based on our Timing and Mathematical work, please Click Here. 


ATTENTION!!! Please note, we have moved most of our free editorial content to our new website MarketSpartans.com Please Click Here to view it. 

Z31