Weekly Stock Market Update – What Will Pop The Everything Bubble?
It appears, at least for the time being, the “Everything Bubble” remains unstoppable. David Stockman has some ideas of what might actually destroy it. Let’s take a quick look.
Among the many sharp edges of the pin are these:
- the virtual certainly of a recession within the next two years and a typical 30%-50% drop in earnings;
- the epochal Fed pivot to QT (with other major central banks to follow) and the consequent massive drainage of cash from the bond pits;
- the mad man in the Oval Office and (among other follies) his swell new Trade War, which absolutely will get out of hand globally;
- the impending “yield shock” which will thunder through the financial markets when Federal borrowing hits $1.2 trillion in the coming year–on the way to $2 trillion+ annual deficits as far as the eye can see;
- a deeply impaired underlying main street economy which is groaning under $68 trillion of public and private debt and a reverse robin hood financial regime that has left 80% of the population on welfare or struggling to make ends meet on earnings that barely keep up with inflation; and
- the swaying giant red elephant in the global economic room—meaning China’s historically unprecedented and freakish explosion of debt, manic building, monumental speculation, systematic lying and fraud and serpentine centralized command-and-control that is destined to end in a spectacular implosion.
Yet the financial system has been so corrupted by the central bank’s long-running regime of financial asset inflation and price falsification that it no longer recognizes anything that is important, fundamental and persisting. Instead, owing to the cult of an ever rising stock market, Wall Street is hopelessly enthrall to recency bias and context-free short-term deltas in the incoming monthly data.
The latter are virtually meaningless, of course, under today’s central bank driven Bubble Finance regime because the direction of economic causation has been reversed.
Mr. Stockman’s opinion, in my view, is dead on.
Having said that, we do not need a fundamental trigger to get the ball rolling. The stock market selling at its highest valuation level in history, based on Shiller’s Adjusted P/E (as discussed here many times before), is reason enough.
The trick is identifying the cyclical composition of the market and knowing exactly WHEN this cyclical market composition will lead to a market collapse. Luckily, that is exactly what we do here. If you would like to find out exactly what the stock market will do next, based on our timing and mathematical work, please Click Here.
Back to the stock market.
 – State of the Market Address:
- The Dow is back above 25,000
- Shiller’s Adjusted S&P P/E ratio is now at 33.71 Slightly off highs, but still arguably at the highest level in history (if we adjust for 2000 distortions) and still above 1929 top of 29.55.
- Weekly RSI at 59 – neutral. Daily RSI is at 54 – neutral.
- Prior years corrections terminated at around 200 day moving average. Located at around 19,000 today (on weekly).
- Weekly Stochastics at 52 – neutral. Daily at 50 – neutral. .
- NYSE McClellan Oscillator is at +53 Neutral.
- Commercial VIX interest is now 30K contracts net short.
- Last week’s CTO Reports suggest that commercials (smart money) have, more or less, shifted into a bullish positioning. For now, the Dow is 2X net short, the S&P is at 3X net short, Russell 2000 is net neutral and the Nasdaq is now 2X net long.
In summary: For the time being and long-term, the market remains in a clear long-term bull trend. Yet, a number of longer-term indicators suggest the market might experience a substantial correction ahead. Plus, the “smart money” is positioning for some sort of a sell-off.
ELLIOTT WAVE UPDATE:
Since many people have asked, I will attempt to give you my interpretation of Elliott Wave and how it is playing out in the market. First, I must admit. I don’t claim to be an EW expert, but I hope my “standard” interpretation is of help.
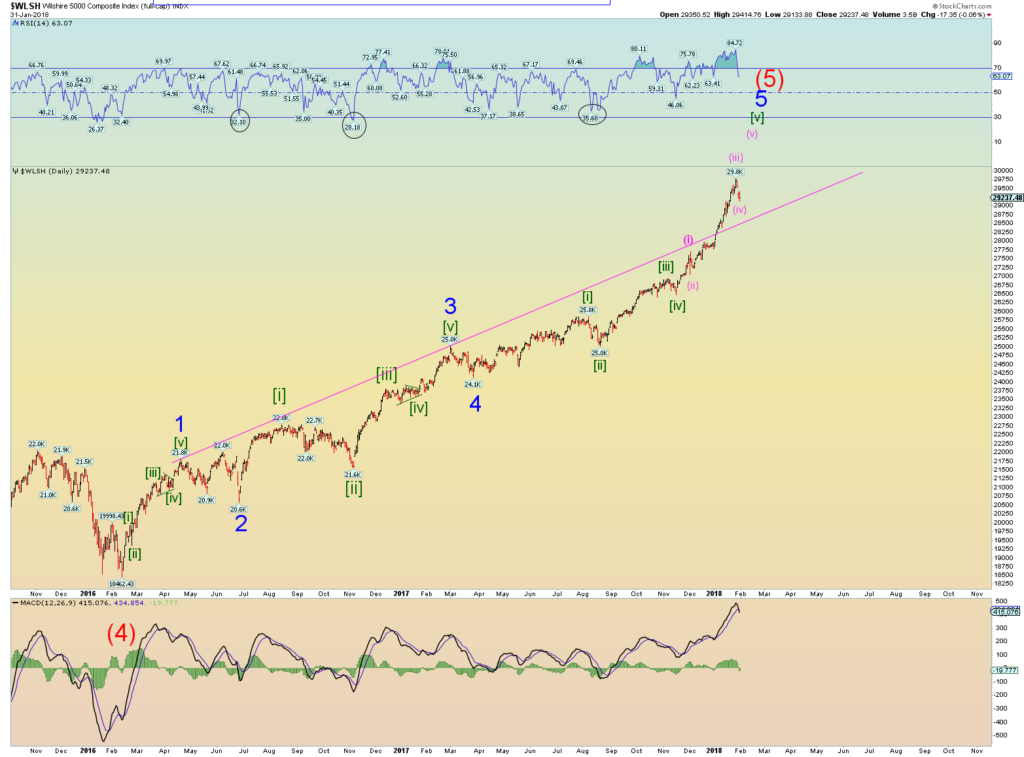
Let’s take a look at the most likely recent count on the Wilshire 5000. Charts courtesy Daneric’s Elliott Waves
Explanation:
Long-Term: It appears the Wilshire 5000 is quickly approaching the termination point of its (5) wave up off of 2009 bottom. If true,we should see a massive sell-off later this year. Did it already complete? Click Here
Short-Term: It appears the Wilshire 5000 might have completed its intermediary wave 3 and now 4. It appears the market is now pushing higher to complete wave 5 of (5). If true, the above count should terminate the bull market. Did it already complete? Click Here

If you would like to find out exactly what happens next based on our Timing and Mathematical work, please Click Here.
ATTENTION!!! Please note, we have moved most of our free editorial content to our new website MarketSpartans.com Please Click Here to view it.
David Stockman Explains Why Trump’s Trade War Will Turn Into An Absolute Disaster
Investment Grin Of The Day
Is Putin ‘Crazy’ To Prepare For A Nuclear World War 3 Against NATO?
 Yes, crazy like a fox.
Most Americans are completely unaware, let alone are concerned, about upcoming nuclear holocaust. Yes, on American soil and worldwide.
The same cannot be said about Russia. Russia has been building massive civil defense nuclear bunkers in all major population centers. Plus, Putin has been very vocal about Neo-Cons and NATO’s constant push towards war with Russia.
For instance, he cannot make this any more clearer……
Putin says he would annihilate the world with his nuclear weapons if nukes were fired at Russia because ‘why do we need a world if Russians cease to exist?
Russian President Vladimir Putin has said he would destroy the world with nuclear missiles if Russia came under attack.
Putin, who was pictured kissing an enamoured fan on the campaign trail this week, made clear that if Russia was hit by nuclear weapons and faced being wiped out, then the world would not be worth saving.
In a TV documentary he said: ‘I want to tell you, and I want this to be known here and abroad.
Here is the kicker.
I have predicted that the world will snowball towards a Nuclear World War 3, Russia/China Alliance Vs NATO, over 10 years ago. Unfortunately, we are right on schedule as things begin to deteriorate further between the superpowers.
Let me be as clear as I can, unseen and unheard of horrors are just around the corner. If you would like to find out exactly when this war will start and what you can do to protect yourself and the people you love, please Click Here.
Investment Grin Of The Day
Ron Paul: Massive Corrections Is Straight Ahead
Ron Paul delivers an ice cold bucket of water to bullish investors who are still hell bent on buying every dip. We tend to agree with his reasoning and the eventual outcome. With that in mind, if you would like to find out exactly when the said correction will take place, please Click Here
Why Trump’s Trade War Is An Idiotic Mistake
The chart above is curtsy of Let’s Eliminate the Trade Deficit! Yeah, What If?
The short answer is rather simple.
Trade deficits skyrocket in bull markets and collapse in bear markets -OR- it might be bull markets force deficits higher and bear markets decimate them. The chicken and the egg conundrum of sorts.
The cause and effect is not necessarily important here. What is important is that Mr. Trump is hell bent on starting a trade war with anyone and everyone. He believes, mistakenly I must add, that lower trade deficits will lead to some sort of an American prosperity.
Quite the contrary is true. As the chart above suggests lower trade deficits will lead to a global slowdown, higher prices, lower wages and massive job losses in the US. A deflationary spiral of sorts.
Interestingly enough we have tried this exact experiment during the Hoover Administration of 1928-1932. I wonder what happened to the stock market and the US Economy then.
If you must, I wrote about it a few days ago. What Else Do ‘Trade War Loving’ Presidents Trump & Hoover Have In Common??? – Meet The Stock Market Trajectory
WINNING!!!!
Daily Stock Market Update & Forecast – March 5th, 2018
 – State of the Market Address:
- The Dow is back below 25,000
- Shiller’s Adjusted S&P P/E ratio is now at 32.856 Off highs, but still arguably at the highest level in history (if we adjust for 2000 distortions) and still above 1929 top of 29.55.
- Weekly RSI at 56 – neutral. Daily RSI is at 47 – neutral.
- Prior years corrections terminated at around 200 day moving average. Located at around 18,900 today (on weekly).
- Weekly Stochastics at 47 – neutral. Daily at 37 – neutral. .
- NYSE McClellan Oscillator is at -21 Neutral.
- Commercial VIX interest is now 10K contracts net short.
- Last week’s CTO Reports suggest that commercials (smart money) have, more or less, shifted into a bullish positioning. For now, the Dow is 2X net short, the S&P is at 3X net short, Russell 2000 is net neutral and the Nasdaq is now 2X net long.
In summary: For the time being and long-term, the market remains in a clear long-term bull trend. Yet, a number of longer-term indicators suggest the market might experience a substantial correction ahead. Plus, the “smart money” is positioning for some sort of a sell-off.
If you would like to find out exactly what happens next based on our Timing and Mathematical work, please Click Here.
ATTENTION!!! Please note, we have moved most of our free editorial content to our new website MarketSpartans.com Please Click Here to view it.


