Daily Stock Market Update & Forecast – February 26th, 2018
 – State of the Market Address:
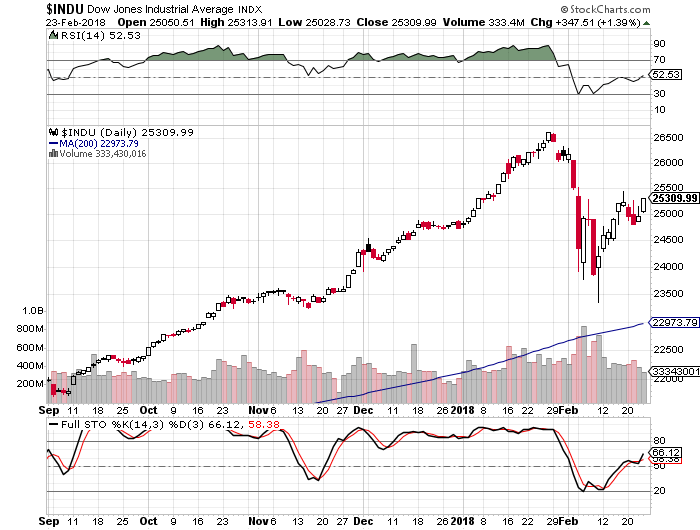
- The Dow is back at 25
- Shiller’s Adjusted S&P P/E ratio is now at 32.83 Off highs, but still arguably at the highest level in history (if we adjust for 2000 distortions) and still above 1929 top of 29.55.
- Weekly RSI at 58 – neutral. Daily RSI is at 47 – neutral.
- Prior years corrections terminated at around 200 day moving average. Located at around 18,900 today (on weekly).
- Weekly Stochastics at 56 – neutral. Daily at 83 – overbought.
- NYSE McClellan Oscillator is at -10 Neutral.
- Commercial VIX interest is now 15K contracts net short.
- Last week’s CTO Reports suggest that commercials (smart money) have, more or less, shifted into a bullish positioning. For now, the Dow is 2X net short, the S&P is at 3X net short, Russell 2000 is net neutral and the Nasdaq is now 3X net long.
In summary: For the time being and long-term, the market remains in a clear long-term bull trend. Yet, a number of longer-term indicators suggest the market might experience a substantial correction ahead. Plus, the “smart money” is positioning for some sort of a sell-off.
If you would like to find out exactly what happens next based on our Timing and Mathematical work, please Click Here.
ATTENTION!!! Please note, we have moved most of our free editorial content to our new website MarketSpartans.com Please Click Here to view it.
Why America Is Facing The Perfect Financial Storm
Investment Gin Of The Day
Weekly Stock Market Update & Forecast – February 23rd, 2018
 – State of the Market Address:
- The Dow is back above 25,000
- Shiller’s Adjusted S&P P/E ratio is now at 33.25 Off highs, but still arguably at the highest level in history (if we adjust for 2000 distortions) and still above 1929 top of 29.55.
- Weekly RSI at 61 – neutral. Daily RSI is at 52 – neutral.
- Prior years corrections terminated at around 200 day moving average. Located at around 18,900 today (on weekly).
- Weekly Stochastics at 49 – neutral. Daily at 66 – neutral
- NYSE McClellan Oscillator is at +34 Neutral.
- Commercial VIX interest is now 15K contracts net short.
- Last week’s CTO Reports suggest that commercials (smart money) have, more or less, shifted into a bullish positioning. For now, the Dow is 2X net short, the S&P is at 3X net short, Russell 2000 is net neutral and the Nasdaq is now 3X net long.
In summary: For the time being and long-term, the market remains in a clear long-term bull trend. Yet, a number of longer-term indicators suggest the market might experience a substantial correction ahead. Plus, the “smart money” is positioning for some sort of a sell-off.
If you would like to find out exactly what happens next based on our Timing and Mathematical work, please Click Here.
ATTENTION!!! Please note, we have moved most of our free editorial content to our new website MarketSpartans.com Please Click Here to view it.
ELLIOTT WAVE UPDATE:
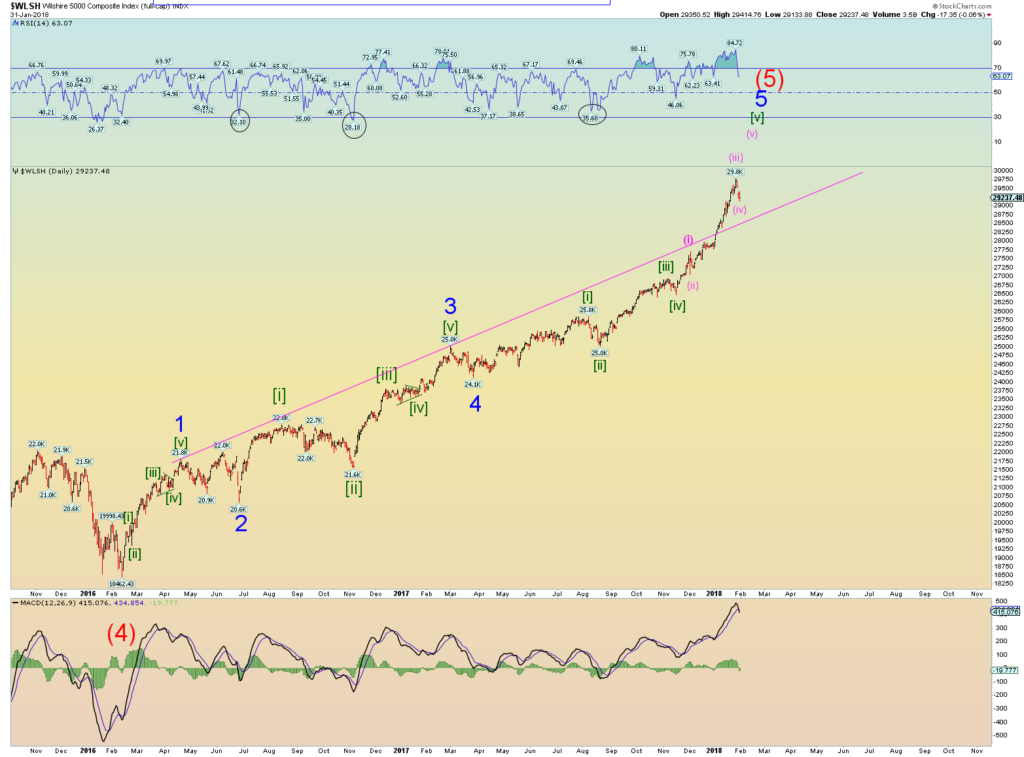
Since many people have asked, I will attempt to give you my interpretation of Elliott Wave and how it is playing out in the market. First, I must admit. I don’t claim to be an EW expert, but I hope my “standard” interpretation is of help.
Let’s take a look at the most likely recent count on the Wilshire 5000. Charts courtesy Daneric’s Elliott Waves
Explanation:
Long-Term: It appears the Wilshire 5000 is quickly approaching the termination point of its (5) wave up off of 2009 bottom. If true,we should see a massive sell-off later this year. Did it already complete? Click Here
Short-Term: It appears the Wilshire 5000 might have completed its intermediary wave 3 and now 4. It appears the market is now pushing higher to complete wave 5 of (5). If true, the above count should terminate the bull market. Did it already complete? Click Here

If you would like to find out exactly what happens next based on our Timing and Mathematical work, please Click Here.
ATTENTION!!! Please note, we have moved most of our free editorial content to our new website MarketSpartans.com Please Click Here to view it.
Investment Grin Of The Day
Daily Stock Market Update & Forecast – February 22nd, 2018
 – State of the Market Address:
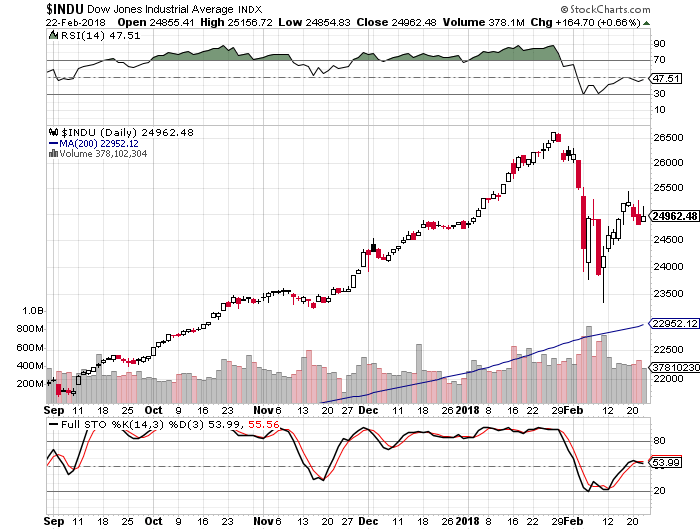
- The Dow is back below 25,000
- Shiller’s Adjusted S&P P/E ratio is now at 32.84 Off highs, but still arguably at the highest level in history (if we adjust for 2000 distortions) and still above 1929 top of 29.55.
- Weekly RSI at 58 – neutral. Daily RSI is at 47 – neutral.
- Prior years corrections terminated at around 200 day moving average. Located at around 18,900 today (on weekly).
- Weekly Stochastics at 46 – neutral. Daily at 54 – neutral
- NYSE McClellan Oscillator is at +21 Neutral.
- Commercial VIX interest is now 20K contracts net short.
- Last week’s CTO Reports suggest that commercials (smart money) have, more or less, shifted into a bullish positioning. For now, the Dow is 2X net short, the S&P is at 4X net short, Russell 2000 is net neutral and the Nasdaq is now 3X net long.
In summary: For the time being and long-term, the market remains in a clear long-term bull trend. Yet, a number of longer-term indicators suggest the market might experience a substantial correction ahead. Plus, the “smart money” is positioning for some sort of a sell-off.
If you would like to find out exactly what happens next based on our Timing and Mathematical work, please Click Here.
ATTENTION!!! Please note, we have moved most of our free editorial content to our new website MarketSpartans.com Please Click Here to view it.
Why Trump Is No Reagan & Powell Is No Volcker
Investment Wisdom Of The Day
Why Peter Schiff Is Dead Wrong About Currency Crisis & Inflation
Over the last few months Peter Schiff has been increasingly vocal about today’s massive bubbles in nearly all asset classes. All while predicting some sort of apocalyptic market destruction. As the video below suggests.
And while I agree with Mr. Schiff about many of the things he talks about, I believe he is dead wrong in terms of how we get there.
You see, Mr. Schiff expects a currency crisis (the USD collapse) and subsequent inflationary spiral. Due to the FED cutting interest rates and introducing additional rounds of QE the next time the stock market/economy collapse. Something that can happen at any day now.
I couldn’t agree more, when the next recession hits, the FED will do what they always do. Cut interest rates back to zero and introduce additional rounds of QE. Yet, the outcome might be very different this time around. And that is Mr. Schiff’s primary mistake.
DEBT…..
Today’s total National and Personal debts stand at around $40 Trillion. Throw in unfunded liabilities such as social security and the picture gets even uglier.
You see, the FED can lower interest rates to Zero while initiating additional rounds of QE, but they cannot force individuals and businesses to borrow that money for productive capital spending. That is why we have seen massive inflation in speculative assets and haven’t really seen it in the real economy.
Many would argue that we are about to see such inflation, but I would disagree. When stocks collapse and the economy goes into a recession, a deflationary spiral will take hold. Erasing today’s inflationary expectations overnight.
Again, debt is deflationary in nature and always has been.
As a result, instead of the USD collapsing in value, it will surge. As those who attempt to repay their debts seek out smaller and smaller pools of actual cash/dollars. It is only after the fact, after bad debts have been liquidated, that an inflationary spiral Mr. Shiff expects will take hold.
Understandably, TIMING is the key. Trust me, you don’t want to be stuck in inflationary trades while deflation takes hold. And vise versa. If you would like to find out exactly when/how these things will play out, please CLICK HERE


