Daily Stock Market Update & Forecast – February 12th, 2018
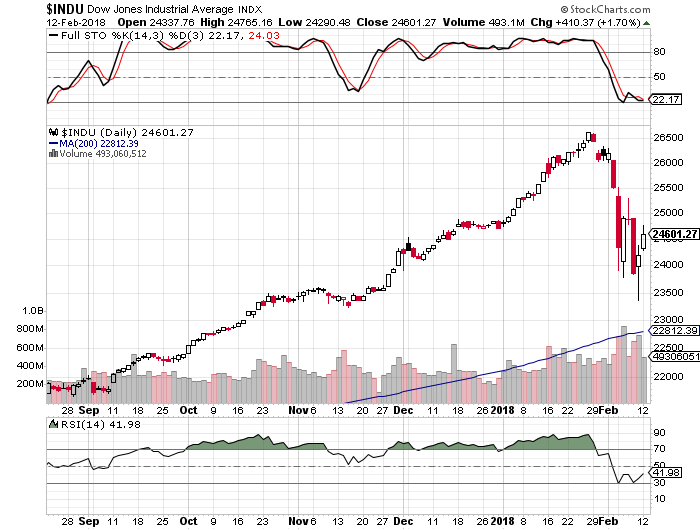 – State of the Market Address:
- The Dow is back above 24,000
- Shiller’s Adjusted S&P P/E ratio is now at 32.14 Off highs, but still arguably at the highest level in history (if we adjust for 2000 distortions) and still above 1929 top of 29.55.
- Weekly RSI at 53 – neutral. Daily RSI is at 42 – neutral.
- Prior years corrections terminated at around 200 day moving average. Located at around 18,800 today (on weekly).
- Weekly Stochastics at 56 – neutral. Daily at 22 – oversold
- NYSE McClellan Oscillator is at -74. Oversold.
- Volatility measures VIX/VXX positioning reversed dramatically right before the “crash”. Commercial VIX long interest went from being 22K contracts net long to being 30K contracts net short.
- Last week’s CTO Reports suggest that commercials (smart money) have, more or less, maintained their positioning. For now, the Dow is 3X, the S&P is at 4X net short, Russell 2000 is now at 2.5X net short and the Nasdaq is net neutral.
In summary: For the time being and long-term, the market remains in a clear bull trend. Yet, a number of longer-term indicators suggest the market might experience a substantial correction ahead. Plus, the “smart money” is positioning for some sort of a sell-off.
If you would like to find out exactly what happens next based on our Timing and Mathematical work, please Click Here.
ATTENTION!!! Please note, we have moved most of our free editorial content to our new website MarketSpartans.com Please Click Here to view it.
What F$%&ing Crash Is Everyone Talking About?
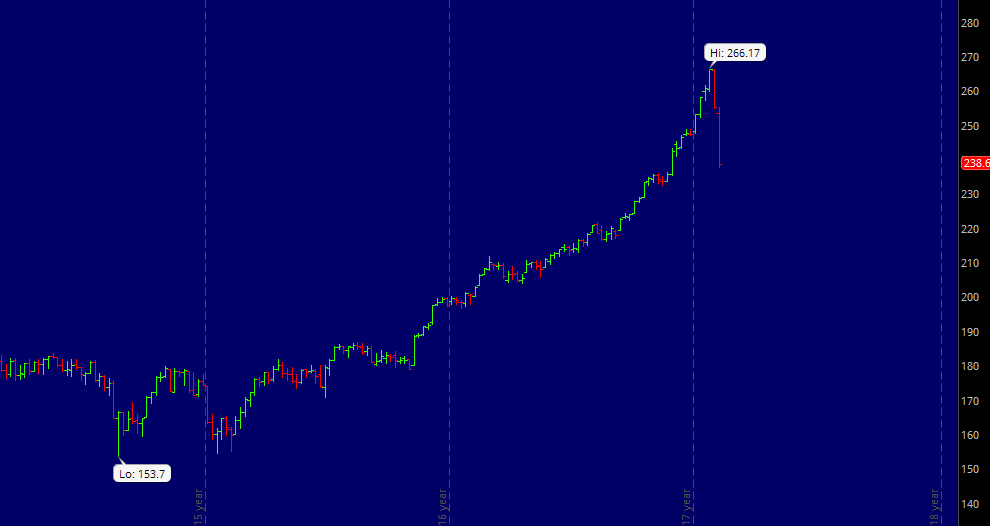
The Dow is down 10% or so from its all time high a few weeks ago and most investors are literally losing their minds. So much so that quite a few bullish investors are proclaiming that we have already witnessed a historic crash. Most often followed by “now is the time to buy the dip”.
Here are my favorites……..
- Brainless Traders Are Putting Your Retirement At Risk
- Cramer blames this week’s crazy market on a ‘group of complete morons’ out speculating
This week’s crazy market swings are largely due to a band of uninformed investors who got caught speculating, CNBC’s Jim Cramersaid Thursday. “A group of complete morons” who traded little-known, leveraged products that bet on volatility is “blowing up” everything, Cramer said on “Squawk on the Street.” Cramer has been particularly critical of the VelocityShares Daily Inverse VIX Short-Term exchange-traded note, which is traded under the symbol XIV, and those who put money into it.
Well, there you go ladies and gentlemen. The mystery of today’s apocalyptic 10% stock market “crash” has been solved. Forget historic overvaluation, massive leverage, record setting bullish sentiment, etc… It is all the fault of idiotic bears and volatility traders.
The reality, of course, is entirely different.
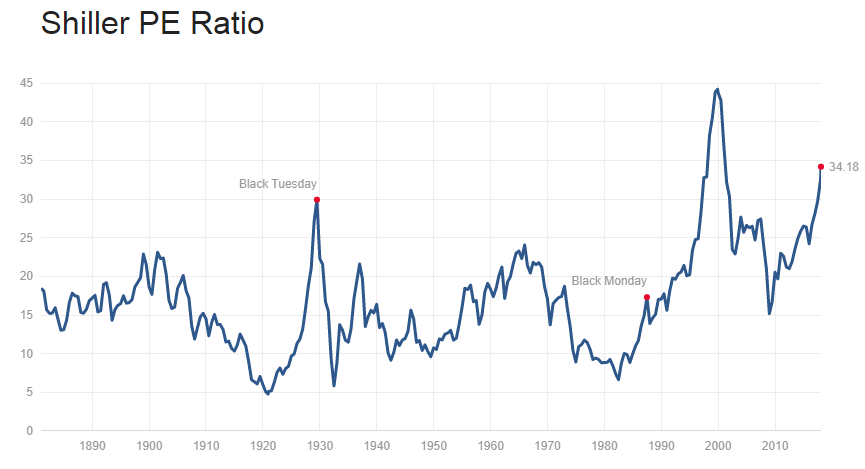 As we have suggested here for months, the stock market has never been more expensive and bullish animal spirits have never been higher. And it all has been financed with a massive infusion of debt in the form of QE and zero interest rates.
So much so that for the stock market to return to its median P/E level of around 15 stocks would have to crash 50-60% from today’s levels. And that’s without taking into consideration the impact on earnings.
In other words, bulls can blame moronic bears, volatility traders or the Pope himself, but they haven’t seen a crash yet. They will, but I wouldn’t want to discourage them from BTFD now.
If you would like to find out what the stock market will do next based on our Timing and Mathematical work, please Click Here
Ron Paul’s Plainly Explains Why American Financial Future Is Doomed In An Epic Speech
Investment Grin Of The Day
Concrete Proof That Trump Is An Irrational Accident Waiting To Happen
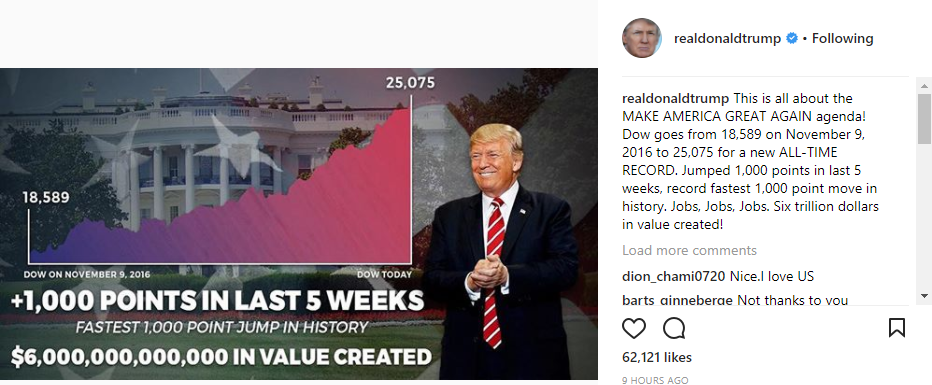
How can one go from pumping the stock market as purely his own accomplishment (see below) to the following statement What the Trump White House says about this sharp stock-market reversal after the so called crash?
‘The President’s focus is on our long-term economic fundamentals, which remain exceptionally strong, with strengthening U.S. economic growth, historically low unemployment, and increasing wages for American workers. The President’s tax cuts and regulatory reforms will further enhance the U.S. economy and continue to increase prosperity for the American people.’
The answer is rather simple for any rational human being. President Trump is full of hot air and BS.
Yet, it is incredibly difficult to argue with hardcore Trump supporters. I was one of them before he flipped on nearly every important issue, but let’s try.
For instance, according to most Trump supporters, we are witnessing an economic miracle the like of which we haven’t seen since the days of ancient Rome. For instance……
WH PRESS SEC: DEMS WARNED OF ECONOMIC ‘ARMAGEDDON,’ ‘TOTAL OPPOSITE’ HAPPENED
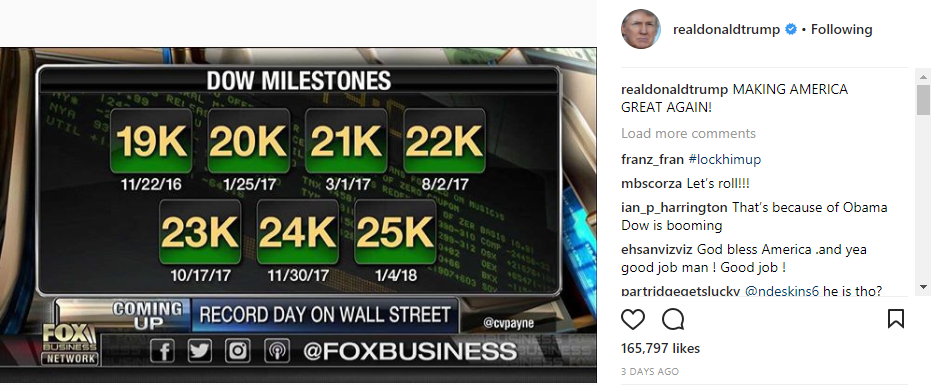
Fair enough, but…. under Obama the Dow Jones zoomed up about 200%. And under Trump? Well, as Mr. Trump so graciously points out himself, it is up about 34% since he won the election. Not bad, but far from Obama’s achievement.
The above applies to almost any measure. From unemployment to GDP Growth. Thanks to the FED and their insane monetary policy, of course.
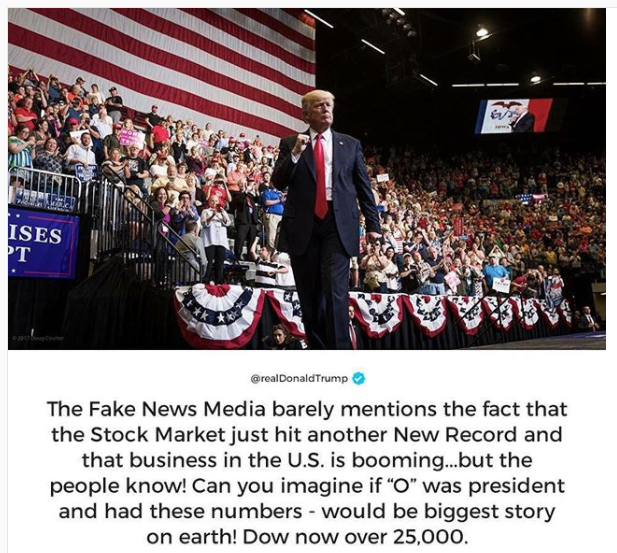
Second, it is a well known fact among American Presidents to never take credit for the stock market’s boom. Why? Well, because one might have to deal with the consequences of a recession or god forbid, a market crash. Understandably, such a silly rule does not apply to Emperor Trump.
Trump takes credit for Dow 25,000, says ‘I guess our new number is 30,000’
- With the Dow breaking 25,000 for the first time, President Trump is hoping for even bigger gains.
- “What that means is that, whenever you see that number go up on Wall Street, it means jobs, it means success, it means 401(k)s are flourishing,” Trump tells reporters.
But, do you recall the following…..
Trump Praises the Stock Market at 22,000 That He Said Was a Bubble at 18,000
So, either President Trump is a mad genius, a complete fool or a liar. You decide. One thing is certain, it will be fun to revisit his tweets below in a few years.
Investment Grin Of The Day
Daily Stock Market Update & Forecast – February 7th, 2018 – Elliott Wave Edition
ELLIOTT WAVE UPDATE:
Since many people have asked, I will attempt to give you my interpretation of Elliott Wave and how it is playing out in the market. First, I must admit. I don’t claim to be an EW expert, but I hope my “standard” interpretation is of help.
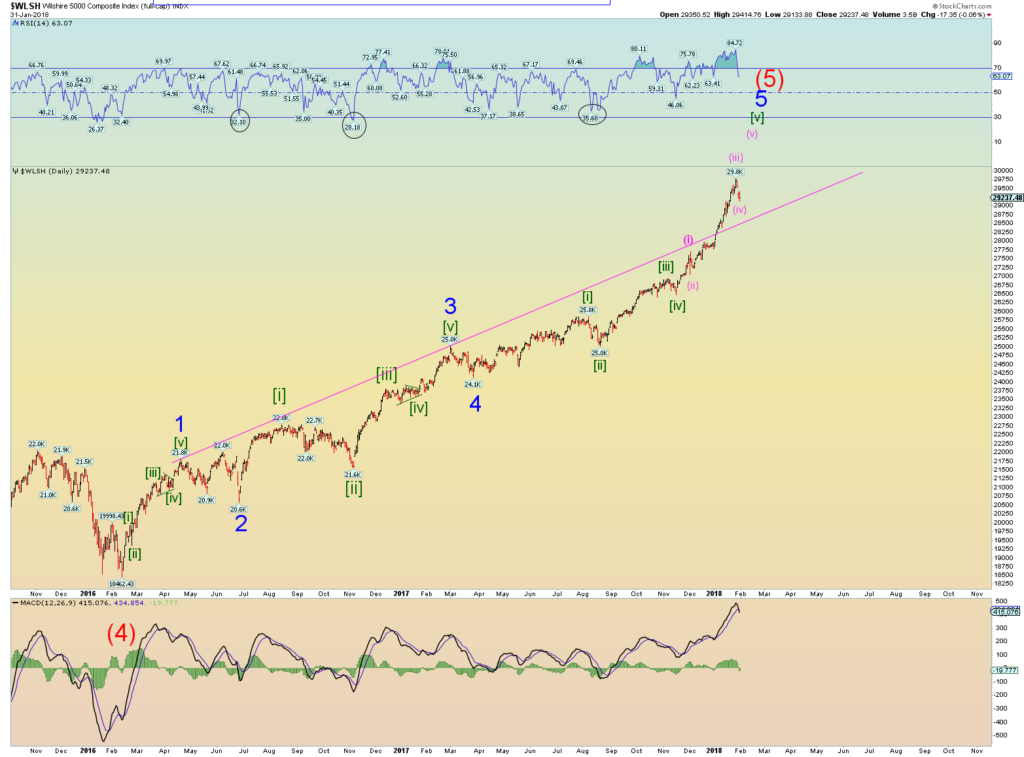
Let’s take a look at the most likely recent count on the Wilshire 5000. Charts courtesy Daneric’s Elliott Waves
Explanation:
Long-Term: It appears the Wilshire 5000 is quickly approaching the termination point of its (5) wave up off of 2009 bottom. If true,we should see a massive sell-off later this year. Did it already complete? Click Here
Short-Term: It appears the Wilshire 5000 might have completed its intermediary wave 3 and now 4. It appears the market is now pushing higher to complete wave 5 of (5). If true, the above count should terminate the bull market. Did it already complete? Click Here
If you would like to find out exactly what happens next based on our Timing and Mathematical work, please Click Here.
ATTENTION!!! Please note, we have moved most of our free editorial content to our new website MarketSpartans.com Please Click Here to view it.
Carl Icahn: One Day This Thing Will Implode Like 1929 – What If That Day Is Today?
Daily Stock Market Update & Forecast – February 6th, 2018
 – State of the Market Address:
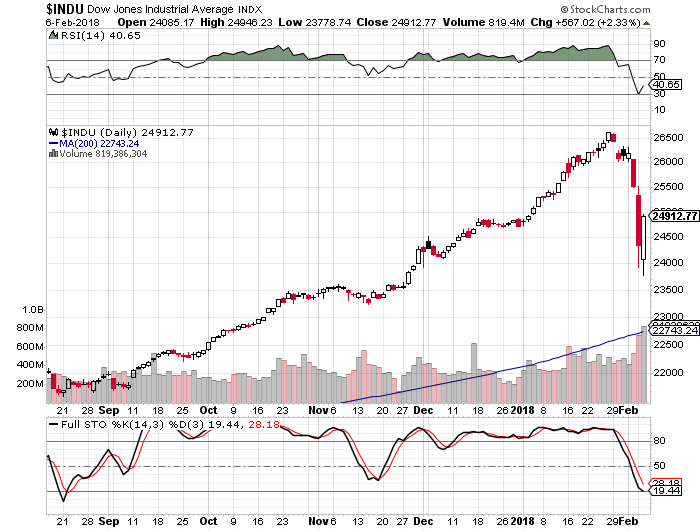
- The Dow is now below 25,000
- Shiller’s Adjusted S&P P/E ratio is now at 332.62 Off highs, but still arguably at the highest level in history (if we adjust for 2000 distortions) and still above 1929 top of 29.55.
- Weekly RSI at 61 – overbought. Daily RSI is at 41 – neutral.
- Prior years corrections terminated at around 200 day moving average. Located at around 18,800 today (on weekly).
- Weekly Stochastics at 72 – overbought. Daily at 20 – oversold
- NYSE McClellan Oscillator is at -80. Oversold.
- Volatility measures VIX/VXX remains at suppressed levels. Commercial VIX long interest has dropped substantially and is now only at 22K contracts net long.
- Last week’s CTO Reports suggest that commercials (smart money) have maintained their positioning. For now, the Dow is 5X, the S&P is at 4X net short, Russell 2000 is now at 4X net short and the Nasdaq is net neutral.
In summary: For the time being and long-term, the market remains in a clear bull trend. Yet, a number of longer-term indicators suggest the market might experience a substantial correction ahead. Plus, the “smart money” is positioning for some sort of a sell-off.
If you would like to find out exactly what happens next based on our Timing and Mathematical work, please Click Here.
ATTENTION!!! Please note, we have moved most of our free editorial content to our new website MarketSpartans.com Please Click Here to view it.


