Investment Wisdom Of The Day
Weekly Stock Market Update & Forecast – February 2nd, 2018
 – State of the Market Address:
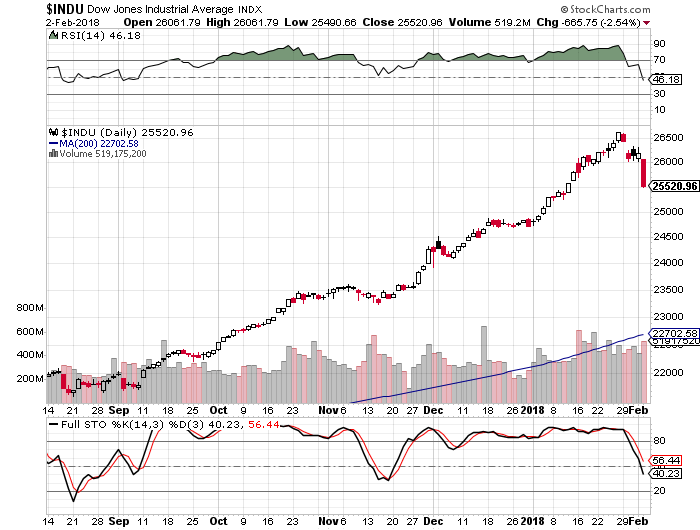
- The Dow is back below 26,000
- Shiller’s Adjusted S&P P/E ratio is now at 33.76 Off highs, but still arguably at the highest level in history (if we adjust for 2000 distortions) and still above 1929 top of 29.55.
- Weekly RSI at 69 – overbought. Daily RSI is at 46 – neutral.
- Prior years corrections terminated at around 200 day moving average. Located at around 18,800 today (on weekly).
- Weekly Stochastics at 88 – overbought. Daily at 40 – neutral.
- NYSE McClellan Oscillator is at -90. Oversold.
- Volatility measures VIX/VXX remains at suppressed levels. Commercial VIX long interest has dropped substantially and is now only at 22K contracts net long.
- Last week’s CTO Reports suggest that commercials (smart money) have maintained their positioning. For now, the Dow is 5X, the S&P is at 4X net short, Russell 2000 is now at 4X net short and the Nasdaq is net neutral.
In summary: For the time being and long-term, the market remains in a clear bull trend. Yet, a number of longer-term indicators suggest the market might experience a substantial correction ahead. Plus, the “smart money” is positioning for some sort of a sell-off.
If you would like to find out exactly what happens next based on our Timing and Mathematical work, please Click Here.
ATTENTION!!! Please note, we have moved most of our free editorial content to our new website MarketSpartans.com Please Click Here to view it.
ELLIOTT WAVE UPDATE:
Since many people have asked, I will attempt to give you my interpretation of Elliott Wave and how it is playing out in the market. First, I must admit. I don’t claim to be an EW expert, but I hope my “standard” interpretation is of help.
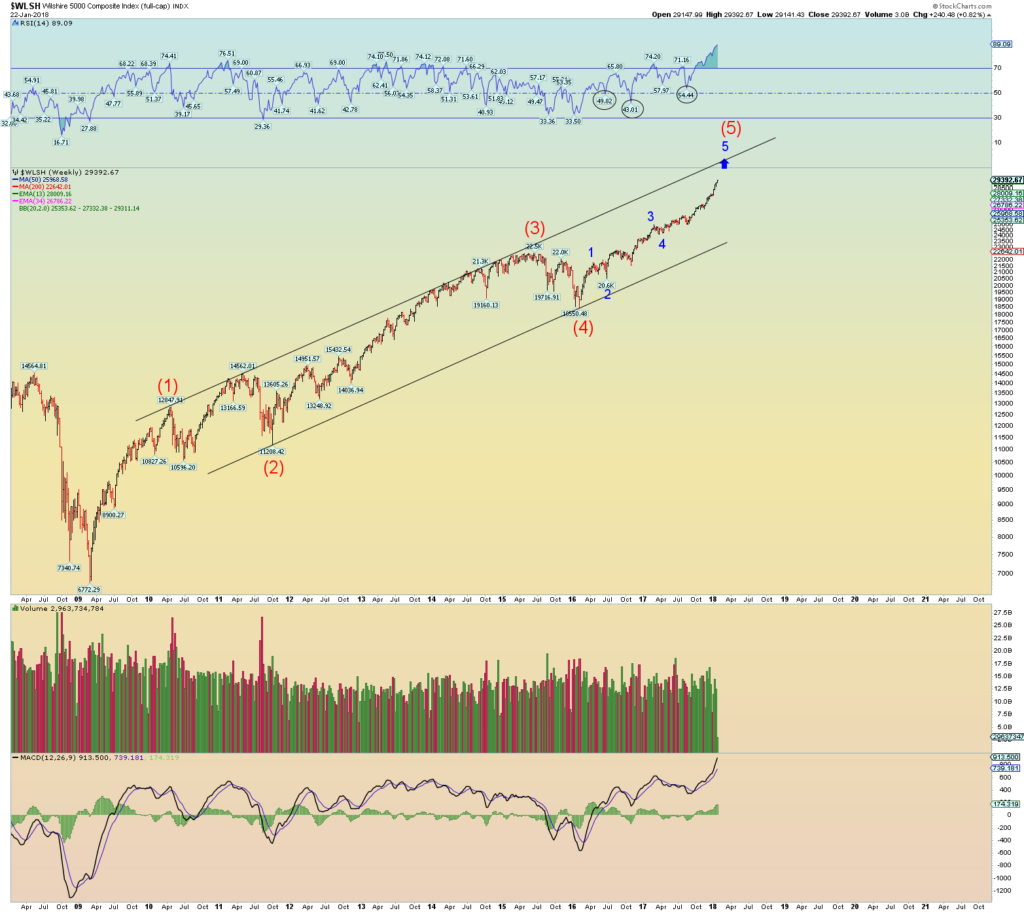
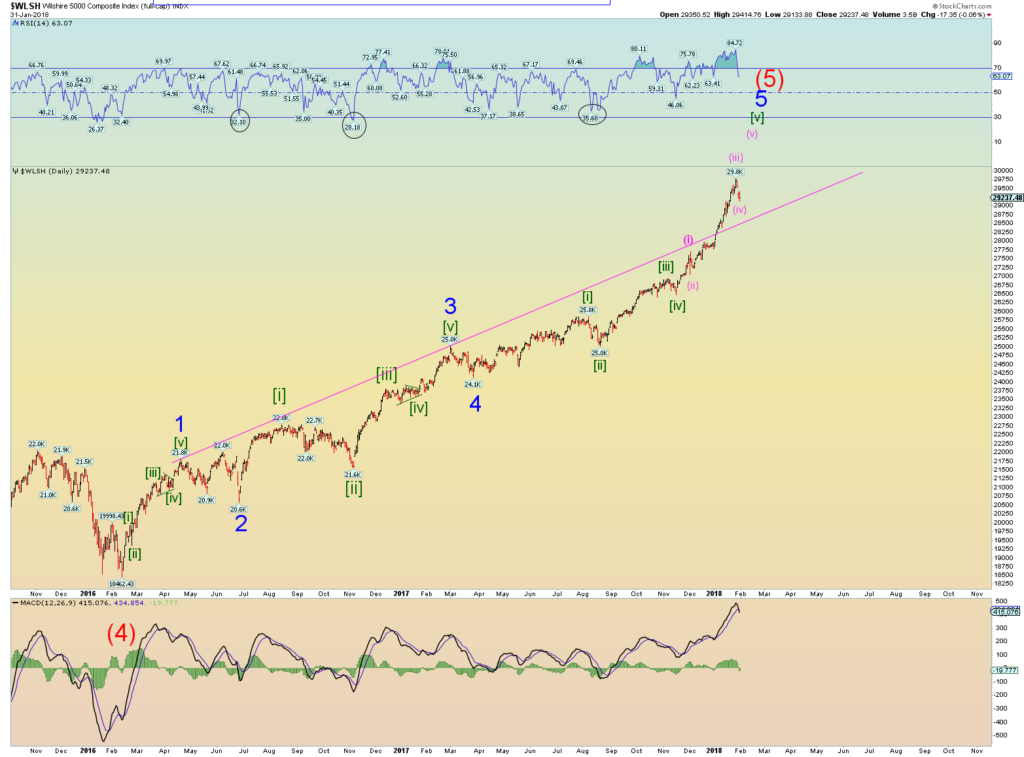
Let’s take a look at the most likely recent count on the Wilshire 5000. Charts courtesy Daneric’s Elliott Waves
Explanation:
Long-Term: It appears the Wilshire 5000 is quickly approaching the termination point of its (5) wave up off of 2009 bottom. If true,we should see a massive sell-off later this year. Did it already complete? Click Here
Short-Term: It appears the Wilshire 5000 might have completed its intermediary wave 3 and now 4. It appears the market is now pushing higher to complete wave 5 of (5). If true, the above count should terminate the bull market. Did it already complete? Click Here

 If you would like to find out exactly what happens next based on our Timing and Mathematical work, please Click Here.
ATTENTION!!! Please note, we have moved most of our free editorial content to our new website MarketSpartans.com Please Click Here to view it.
Investment Grin Of The Day
Daily Stock Market Update & Forecast – February 1st, 2018 – Elliott Wave Edition
ELLIOTT WAVE UPDATE:
Since many people have asked, I will attempt to give you my interpretation of Elliott Wave and how it is playing out in the market. First, I must admit. I don’t claim to be an EW expert, but I hope my “standard” interpretation is of help.
Let’s take a look at the most likely recent count on the Wilshire 5000. Charts courtesy Daneric’s Elliott Waves
Explanation:
Long-Term: It appears the Wilshire 5000 is quickly approaching the termination point of its (5) wave up off of 2009 bottom. If true,we should see a massive sell-off later this year. Did it already complete? Click Here
Short-Term: It appears the Wilshire 5000 might have completed its intermediary wave 3 and now 4. It appears the market is now pushing higher to complete wave 5 of (5). If true, the above count should terminate the bull market. Did it already complete? Click Here

 If you would like to find out exactly what happens next based on our Timing and Mathematical work, please Click Here.
ATTENTION!!! Please note, we have moved most of our free editorial content to our new website MarketSpartans.com Please Click Here to view it.
Ron Paul: Making America Great…Or Poorer? Dissecting The State Of The Union Speech
Price Is What You Pay, Value Is What You Get
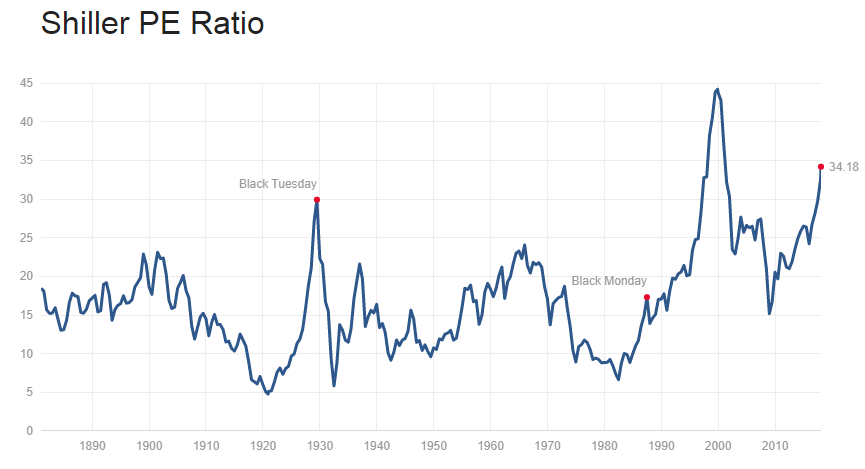
It is no secret that the stock market is historically overpriced. So much so that I have argued we are experiencing the highest valuation levels in history. Higher than 1929, 2007 and even 2000 (if we adjust for lack of tech earnings). Prior smaller peaks of 1937, 1966, 1972, 1987, etc…. don’t even come close.
This is best illustrated by the Shiller’s Adjusted P/E Ratio below. 
So, what gives?
First, the sentiment….. Retail investors haven’t been THIS bullish since (gulp) you know when
Since February 2016, the overall index has soared 98 points, “the largest increase in the 20-year history of the index that is not a rebound immediately after a major drop in optimism.” This is the kind of move contrarians eat up.
“In 1999 and early 2000, high enthusiasm for stocks was a powerful sign the stock-market bubble was on its last legs,” Richter said. “Of course, no one can say how much higher their enthusiasm will surge this time around. Hype works, until it doesn’t.”
Buy High Sell Low…….Right?
Second, the driving force….Central Banks Have Purchased $2 Trillion In Assets In 2017
In his latest “flow report”, BofA’s Michael Hartnett looks at the “Disconnect Myth” between rising stocks and bonds and summarizes succinctly that there is “no disconnect between stocks & bonds.”
Why? The best, and simplest, explanation for low yields & high stocks is simple: so far in 2017 there has been $1.96 trillion of central bank purchases of financial assets in 2017 alone, as central bank balance sheets have grown by $11.26 trillion since Lehman to $15.6 trillion. Hartnett concedes that the second best explanation is bonds pricing in low CPI (increasingly a new structurally low level of inflation due to tech disruption of labor force) while equities price in high EPS (with little on horizon to meaningfully reverse trend), although there is no reason why the second can’t flow from the first.
And there you have it ladies and gentlemen.
- The market is incredibly expensive. Record breaking expensive. Even if we take low yields into consideration.
- Idiot central bankers are terrified of what happens next. Instead of letting the bubbles deflate they have juiced them to unimaginable levels. And in nearly all assets classes.
- So much so that most retail investors now believe stocks will never go down. And even if they do it will be a BTFD situation.
We all have been here before and we all know what happens next. It is different this time as so many believe? Perhaps, but if you truly believe that I still have some Pets.com stock to sell you.
If you would like to find out exactly what happens next based on our Timing and Mathematical work, please Click Here.
Daily Stock Market Update & Forecast – January 31st, 2018
 – State of the Market Address:
- The Dow remains above 26,000
- Shiller’s Adjusted S&P P/E ratio is now at 34.15 Now at arguably the highest level in history (if we adjust for 2000 distortions) and still above 1929 top of 29.55.
- Weekly RSI at 81 – overbought. Daily RSI is at 64.90 – overbought.
- Prior years corrections terminated at around 200 day moving average. Located at around 18,800 today (on weekly).
- Weekly Stochastics at 95 – overbought. Daily at 70 – overbought.
- NYSE McClellan Oscillator is at -4. Neutral.
- Volatility measures VIX/VXX remains at suppressed levels. Commercial VIX long interest remained the same at 50K contracts net long.
- Last week’s CTO Reports suggest that commercials (smart money) have maintained their positioning. For now, the Dow is 5X, the S&P is at 4X net short, Russell 2000 is now at 4X net short and the Nasdaq is net neutral.
In summary: For the time being and long-term, the market remains in a clear bull trend. Yet, a number of longer-term indicators suggest the market might experience a substantial correction ahead. Plus, the “smart money” is positioning for some sort of a sell-off.
If you would like to find out exactly what happens next based on our Timing and Mathematical work, please Click Here.
ATTENTION!!! Please note, we have moved most of our free editorial content to our new website MarketSpartans.com Please Click Here to view it.


