David Stockman Tells Us Why Trump And The Economy Will Be Knocked Out Before 2018 Is Over
Investment Grin Of The Day
Daily Stock Market Update & Forecast – January 10th, 2018
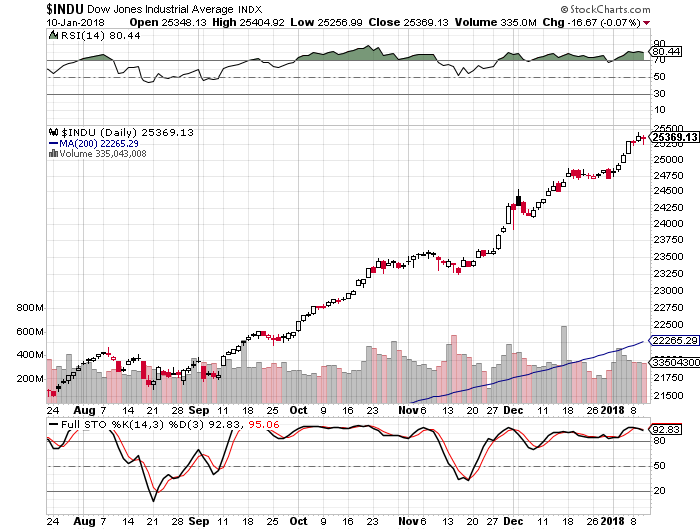 – State of the Market Address:
- The Dow is now above 25,000
- Shiller’s Adjusted S&P P/E ratio is now at 33.30 Now at arguably the highest level in history (if we adjust for 2000 distortions) and still above 1929 top of 29.55.
- Weekly RSI at 88 – overbought. Daily RSI is at 81 – overbought.
- Prior years corrections terminated at around 200 day moving average. Located at around 18,700 today (on weekly).
- Weekly Stochastics at 98 – overbought. Daily at 93 – overbought.
- NYSE McClellan Oscillator is at +11. Neutral.
- Volatility measures VIX/VXX remains at suppressed levels. Commercial VIX long interest decreased to 50K contracts net long.
- Last week’s CTO Reports suggest that commercials (smart money) have maintained their positioning. For now, the Dow is 8X, the S&P is at 4X net short, Russell 2000 is now at 4X net short and the Nasdaq is net neutral.
In summary: For the time being and long-term, the market remains in a clear bull trend. Yet, a number of longer-term indicators suggest the market might experience a substantial correction ahead. Plus, the “smart money” is positioning for some sort of a sell-off.
If you would like to find out exactly what happens next based on our Timing and Mathematical work, please Click Here.
ATTENTION!!! Please note, we have moved most of our free editorial content to our new website MarketSpartans.com Please Click Here to view it.
Chart Overdrive And Why Jeff Gundlach Believes The Market Will Go Negative In 2018
To See All 68 Charts Please CLICK HERE
On Tuesday afternoon, Jeff Gundlach held one of his more exhaustive “Just Markets” calls with investors.
Among the numerous discussion points touched upon, the “bond king” who alone predicted Donald Trump’s victory one year before the election, had several more bold contrarian calls, key among which was his observation that while stocks are now in an “accelerating phase”, his 2018 prediction is that the S&P would post a negative rate of return, which arguably is a more complex way of saying the S&P would be red for the year.
A main catalyst for Gundlach’s bearishness – for both bonds and stocks – is that we are now entering an era of quantitative tightening, i.e., accelerating balance sheet unwind from all the major central banks, which will lead to eventual derisking as yields first rise and stocks ultimately sell on the news.
Another reason why Gundlach is very bearish on the rates complex is that as BofA and JPM calculated last year, in 2018 there could be a $1 trillion bond supply deficit, a number which rises to $1.9 trillion in 2019 according to Gundlach.
Additionally, Gundlach is confident that a “more hawkish ECB” is not priced into the market. To be sure, last night’s quasi-tapering by the suddenly hawkish BOJ certainly lit a flame under long-dated yields today, sending the 10Y surging to 2.55%, breaking out above 2.5% for the first time since Marh 2017.
Going back to quantitative tightening, Gundlach also says that shrinking balance sheets are also not priced by the market, and in this context his bogey is June of 2018, at which point the net liquidity injection by central banks turns negative, or as he calls it, the point of “shrinkage.”
Which is not to say that Gundlach predicts a recession: far from it. Observing some of the main economic indicators that DoubleLine follows, Gundlach finds no recession risk in either the Leading Economic Indicators…
… nor in his favorite recession indicator, the US unemployment rate vs its 12 month simple moving average (a metric which looks at upward inflection points in the unemployment rate)…
… PMIs looks troubling, and would repeat prior recession behavior “only if they start falling next month“…
… meanwhile small business confidence, which today printed just shy of a record print, remains pristine, and indicates “no recessionary caution signal at all.”
… and the same can be observed with both consumer and CEO confidence, which – like the market – are surging higher.
But most importantly, Gundlach finds no wobbles in the junk bond market, where spreads, for now at least, appear unfazed by anything, or as he put it, “we’re not looking for little rocks here, we’re looking for big rocks. And a big rock is something like a 200 basis point widening so if a recession is going to be six months from today, junk spreads better start widening this week or else this is not a useful indicator.” For now, the coast is clear.
Yet while Gundlach does not expect a recession, he is far less sanguine about the stock market, where – echoing what we warned some time ago – he noted that “every indicator is at all-time cycle highs.” And, as a result, Gundlach said that he’s “gonna put it out there right now”, and state that despite stocks being in an “accelerating phase” and that it is “very unlikely for a market in its present condition to go down, my prediction for 2018 is the S&P 500 will have a negative rate of return.”
“All recession indicators are flashing no recession, which means it’s priced in,” Gundlach said. “This is why I say S&P 500 down after a pretty decent run early in 2018.”
And, as the chart below shows, after 9 up years it’s finally time…
To further make his point, Gundlach also noted the unprecedented calm in the market now, confirmed by the near-record number of days without a 5% correction…
… and the nosebleeding Shiller PE ratio of the S&P.
Meanwhile, Gundlach also touched on the market “melt-up” point brought up last week by Jeremy Grantham, which he showed in the following divergence between junk bond prices and stocks. Still, Gundlach countered to Grantham’s point saying that it doesn’t seem likely that the only thing that can surprise us are positives. In fact, Gundlach goes so far as to predict that “a downside surprise is more likely than an upside surprise.”

Gundlach also highlighted a “stunning” Citi chart we first showed back in November, which shows the unprecedented number of VIX days with a sub-10 close in a rolling 6 month window.

Gundlach couldn’t resist and briefly addressed bitcoin, joining so many others in predicting that “he’ll go out on a limb and predict that the high for bitcoin is in” and then took a swipe at the “people who go on TV and say they are bitcoin experts, and I don’t know what what means.” Gundlach went out on an even bigger limb predicting that “if you short bitcoin today, you’ll make money.” Of course, you may lose a lot of money in the process too…
In short, he is not a buyer of bitcoin. So what does his like? Well, he made his choice for the best asset of 2018 very clear when he said that “one of the best investments for 2018 will be commodities”…
… which he believes are poised for a breakout.
… and he certainly does not see commodities implying a recession any time soon.
And while he likes commodities, he is certainly not a fan of European stocks, which he said “remain a value trap.”
But the one asset class he hates the most is anything rates-related. Here Gundlach did not mince his words and said “it is a horrible time to buy corporate bonds” adding that “I don’t like corporate bonds at all.” In light of the recent Steinhoff fiasco and the subsequent ECB liquidation, he may be on to something.
Gundlach also does not like Treasurys, noting that a 2.50% 2-Year Treasury could be in the offing, and predicting that the 10-year would hit 6% by 2021. And before everyone complains loudly, he also said that he does not not think “a 6% yield on the 10-year would cause everyone to die.”
Gundlach also commented on the flattening curve, where he said that it appears that “the 2s10s relationship has stopped flattening. And right now, it doesn’t look like anything near what we’d need to see for a recession.” And “so we’ve run the table: no recession indicators are flashing yellow, which means it’s priced in.”
Then, focusing on just the benchmark, Gundlach said that a 3.25% on the 10Y is “plausible sometime in 2018.”
Reminding his audience of the rivalry between himself and Bill Gross, Gundlach disagreed with the former bond king, who made headlines today with his statement that the bond bull market is over, and said that “Gross is too early with his TSY bear market call.” What is the catalyst for Gundlach? As he explained, one “needs to see the 30Y at 2.99% or above for the trendline to break.”
Trade Of The Day – Junk Bonds (HYG)
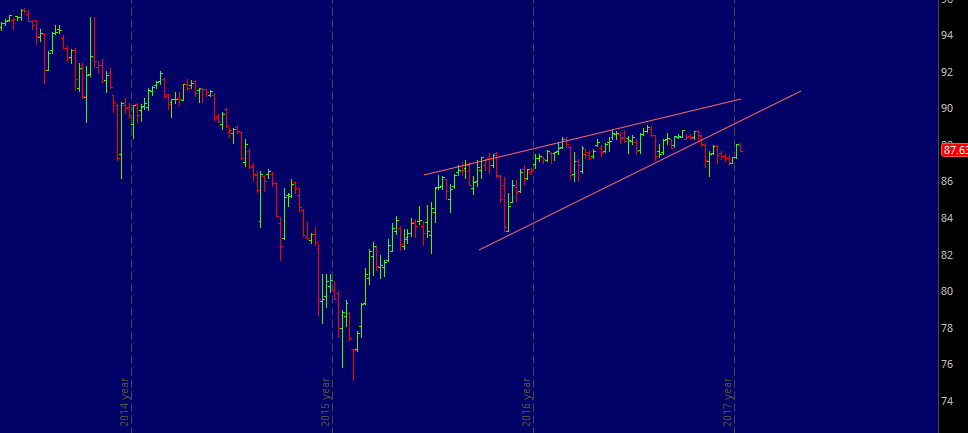
We have been following the chart above and its compressing wedge for quite some time now. As is evident, the wedge was broken to the downside. Suggesting that a much bigger move down is in the works. And that what has so many people worried. Not only about the bond market, but also about the health of the overall stock market. Will this breakdown continue or is this a false break? Plus, will we test prior support? To find out please Click Here.
Ron Paul Rages Against Jeff Sessions, Bitcoin & Everything Bubble
Daily Stock Market Update & Forecast – January 8th, 2018
 – State of the Market Address:
- The Dow is now above 25,000
- Shiller’s Adjusted S&P P/E ratio is now at 33.30 Now at arguably the highest level in history (if we adjust for 2000 distortions) and still above 1929 top of 29.55.
- Weekly RSI at 88 – overbought. Daily RSI is at 80 – overbought.
- Prior years corrections terminated at around 200 day moving average. Located at around 18,700 today (on weekly).
- Weekly Stochastics at 98 – overbought. Daily at 97 – overbought.
- NYSE McClellan Oscillator is at +26. Neutral.
- Volatility measures VIX/VXX remains at suppressed levels. Commercial VIX long interest decreased to 50K contracts net long.
- Last week’s CTO Reports suggest that commercials (smart money) have maintained their positioning. For now, the Dow is 8X, the S&P is at 4X net short, Russell 2000 is now at 4X net short and the Nasdaq is net neutral.
In summary: For the time being and long-term, the market remains in a clear bull trend. Yet, a number of longer-term indicators suggest the market might experience a substantial correction ahead. Plus, the “smart money” is positioning for some sort of a sell-off.
If you would like to find out exactly what happens next based on our Timing and Mathematical work, please Click Here.
ATTENTION!!! Please note, we have moved most of our free editorial content to our new website MarketSpartans.com Please Click Here to view it.
Shocking & Clear Proof That Trump Is An Insane Fool
It is incredibly difficult to argue with hardcore Trump supporters, I was one of them before he flipped on nearly every important issue, but let’s try.
For instance, according to most Trump supporters, we are witnessing an economic miracle the like of which we haven’t seen since the days of ancient Rome. For instance……
WH PRESS SEC: DEMS WARNED OF ECONOMIC ‘ARMAGEDDON,’ ‘TOTAL OPPOSITE’ HAPPENED
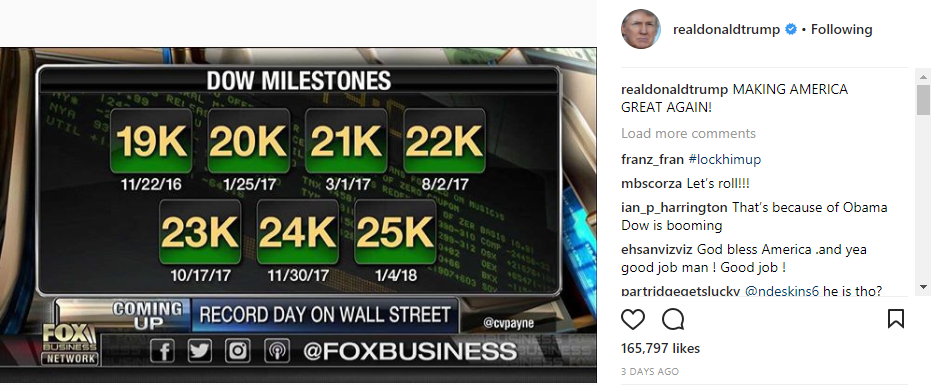
Fair enough, but…. under Obama the Dow Jones zoomed up about 200%. And under Trump? Well, as Mr. Trump so graciously points out himself, it is up about 34% since he won the election. Not bad, but far from Obama’s achievement.
The above applies to almost any measure. From unemployment to GDP Growth. Thanks to the FED and their insane monetary policy, of course.
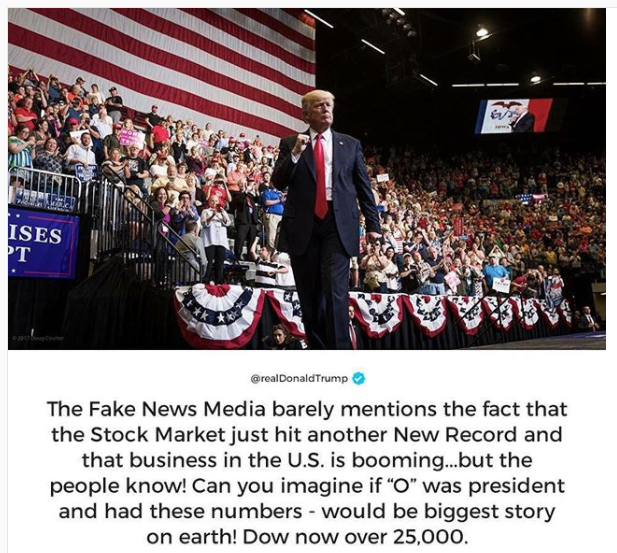
Second, it is a well known fact among American Presidents to never take credit for the stock market’s boom. Why? Well, because one might have to deal with the consequences of a recession or god forbid, a market crash. Understandably, such a silly rule does not apply to Emperor Trump.
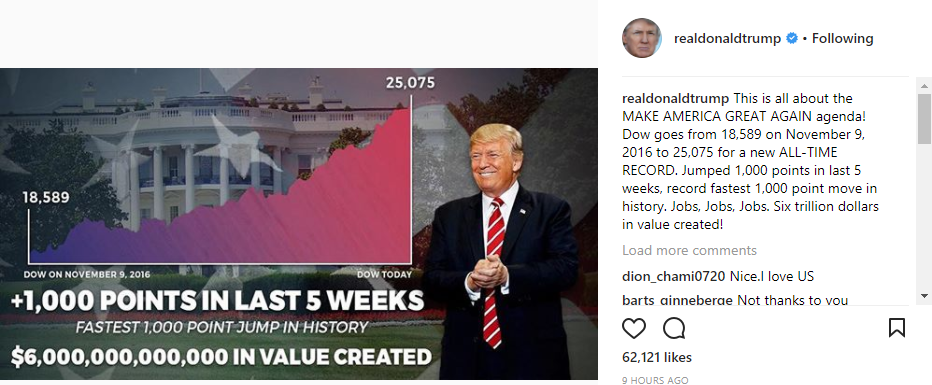
Trump takes credit for Dow 25,000, says ‘I guess our new number is 30,000’
- With the Dow breaking 25,000 for the first time, President Trump is hoping for even bigger gains.
- “What that means is that, whenever you see that number go up on Wall Street, it means jobs, it means success, it means 401(k)s are flourishing,” Trump tells reporters.
But, do you recall the following…..
Trump Praises the Stock Market at 22,000 That He Said Was a Bubble at 18,000
So, either President Trump is a mad genius, a complete fool or a liar. You decide. One thing is certain, it will be fun to revisit his tweets below in a few years.
