InvestWithAlex.com 

Weekly Stock Market Update & Forecast – January 5th, 2018

– State of the Market Address:

  • The Dow is now above 25,000
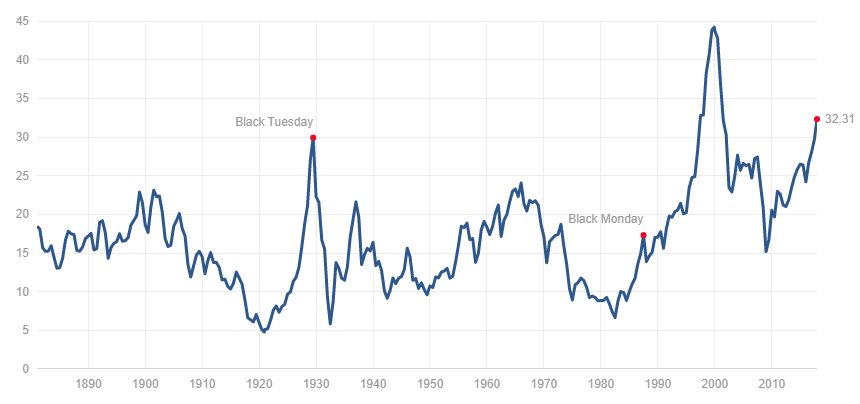
  • Shiller’s Adjusted S&P P/E ratio is now at 33.27 Now at arguably the highest level in history (if we adjust for 2000 distortions) and still above 1929 top of 29.55.
  • Weekly RSI at 88 – overbought. Daily RSI is at 81 – overbought.
  • Prior years corrections terminated at around 200 day moving average. Located at around 18,700 today (on weekly).
  • Weekly Stochastics at 97 – overbought. Daily at 97 – overbought.
  • NYSE McClellan Oscillator is at +26. Neutral.
  • Volatility measures VIX/VXX remains at suppressed levels. Commercial VIX long interest decreased to 50K contracts net long. 
  • Last week’s CTO Reports suggest that commercials (smart money) have maintained their positioning.  For now, the Dow is 8X, the S&P is at 4X net short, Russell 2000 is now at 4X net short and the Nasdaq is net neutral.

In summary: For the time being and long-term, the market remains in a clear bull trend. Yet, a number of longer-term indicators suggest the market might experience a substantial correction ahead.  Plus, the “smart money” is positioning for some sort of a sell-off.

If you would like to find out exactly what happens next based on our Timing and Mathematical work, please Click Here. 


ATTENTION!!! Please note, we have moved most of our free editorial content to our new website MarketSpartans.com Please Click Here to view it.

ELLIOTT WAVE UPDATE:

Since many people have asked, I will attempt to give you my interpretation of Elliott Wave and how it is playing out in the market. First, I must admit. I don’t claim to be an EW expert, but I hope my “standard” interpretation is of help.

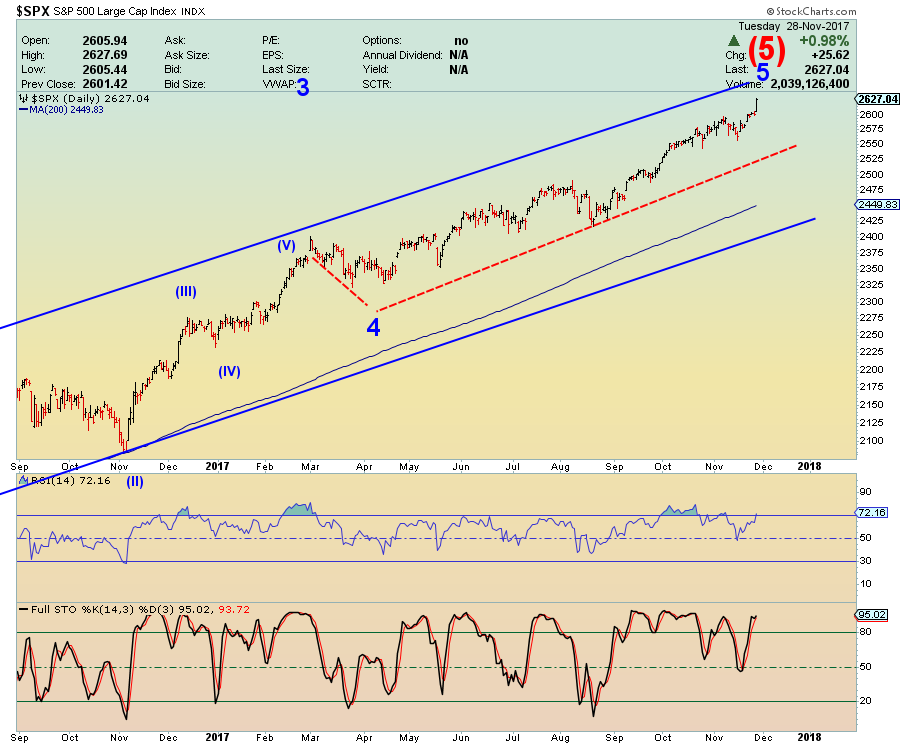
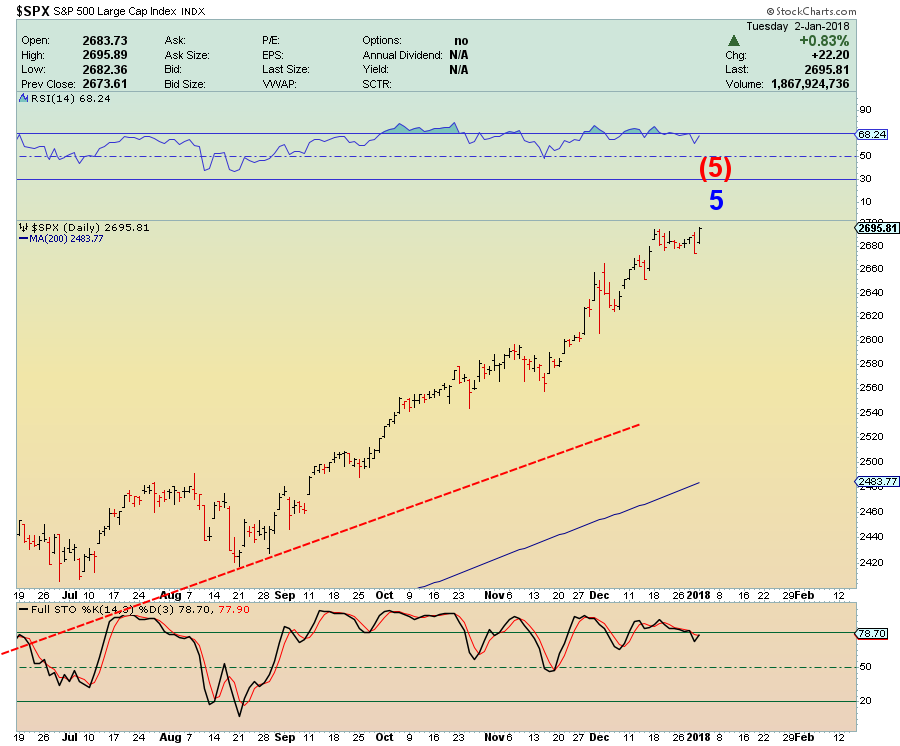
Let’s take a look at the most likely recent count on the S&P.

Explanation:

Long-Term: It appears the S&P is quickly approaching the termination point of its (5) wave up off of 2009 bottom. If true,we should see a massive sell-off later this year. Did it already complete? Click Here

Short-Term: It appears the S&P might have completed its intermediary wave 3 and now 4. It appears the market is now pushing higher to complete wave 5 of (5). If true, the above count should terminate the bull market. Did it already complete? Click Here
If you would like to find out exactly what happens next based on our Timing and Mathematical work, please Click Here. 


ATTENTION!!! Please note, we have moved most of our free editorial content to our new website MarketSpartans.com Please Click Here to view it. 

Daily Stock Market Update & Forecast – December 18th, 2017

– State of the Market Address:

  • The Dow is fast approaching 25,000
  • Shiller’s Adjusted S&P P/E ratio is now at 32.65 Now at arguably the highest level in history (if we adjust for 2000 distortions) and still above 1929 top of 29.55.
  • Weekly RSI at 87 – overbought. Daily RSI is at 79 – overbought.
  • Prior years corrections terminated at around 200 day moving average. Located at around 18,500 today (on weekly).
  • Weekly Stochastics at 96 – overbought. Daily at 91 – overbought.
  • NYSE McClellan Oscillator is at +3. Neutral.
  • Volatility measures VIX/VXX remains at suppressed levels. Commercial VIX long interest increased to 75K contracts net long. 
  • Last week’s CTO Reports suggest that commercials (smart money) have maintained their positioning.  For now, the Dow is 5.5X, the S&P is at 2.5X net short, Russell 2000 is now at 5X net short and the Nasdaq is net neutral.

In summary: For the time being and long-term, the market remains in a clear bull trend. Yet, a number of longer-term indicators suggest the market might experience a substantial correction ahead.  Plus, the “smart money” is positioning for some sort of a sell-off.

If you would like to find out exactly what happens next based on our Timing and Mathematical work, please Click Here. 


ATTENTION!!! Please note, we have moved most of our free editorial content to our new website MarketSpartans.com Please Click Here to view it.


Daily Stock Market Update & Forecast – December 14th, 2017 – Elliott Wave Edition

ELLIOTT WAVE UPDATE:

Since many people have asked, I will attempt to give you my interpretation of Elliott Wave and how it is playing out in the market. First, I must admit. I don’t claim to be an EW expert, but I hope my “standard” interpretation is of help.

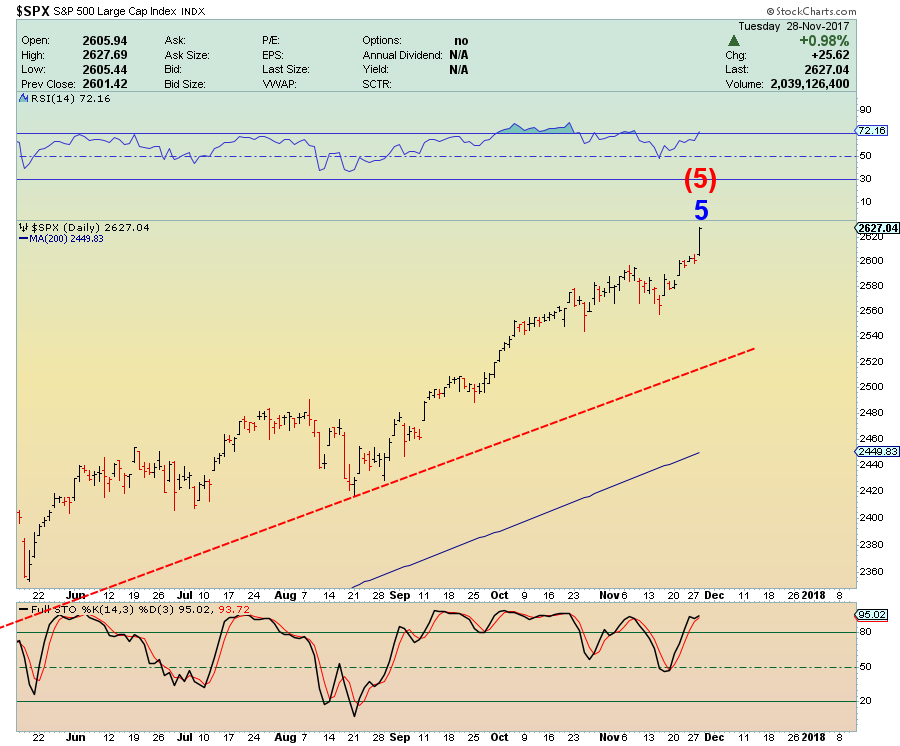
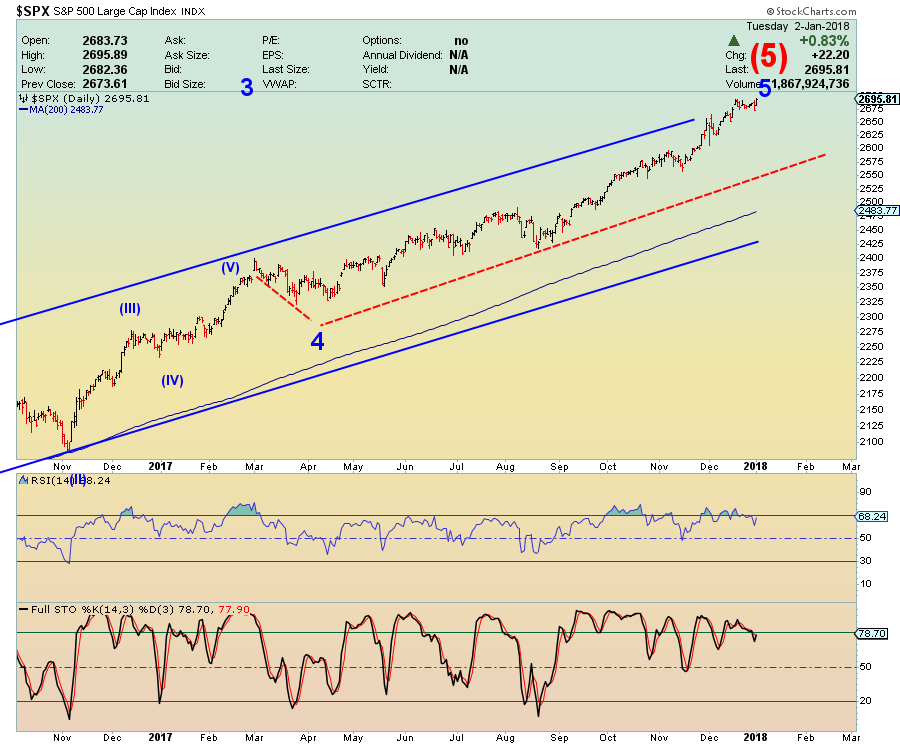
Let’s take a look at the most likely recent count on the S&P.

Explanation:

Long-Term: It appears the S&P is quickly approaching the termination point of its (5) wave up off of 2009 bottom. If true,we should see a massive sell-off later this year. Did it already complete? Click Here

Short-Term: It appears the S&P might have completed its intermediary wave 3 and now 4. It appears the market is now pushing higher to complete wave 5 of (5). If true, the above count should terminate the bull market. Did it already complete? Click Here
If you would like to find out exactly what happens next based on our Timing and Mathematical work, please Click Here. 


ATTENTION!!! Please note, we have moved most of our free editorial content to our new website MarketSpartans.com Please Click Here to view it. 

This Is What Peak Bullishness Looks Like

I have to be honest, I have never seen anything like this. Even at 2000 dot.com bubble top. I don’t recall Alan Greenspan or Bill Clinton going on national TV and pumping up the stock market and/or the economy. If anything, you have to give Alan Greenspan credit for his “Irrational Exuberance” statement.

How have times changed. 

I won’t talk about historically overbought technical conditions in the market as we do it every day. Instead, this chart speaks for itself. The S&P finds itself at the highest valuation level in its history if we make a slight adjustment for lack of tech earnings in 2000.

So, it shouldn’t come as a shocker that our so called leaders are as bullish as they have ever been.

Yellen: I Don’t See a Financial Crisis Occurring ‘In Our Lifetimes’

Speaking during a Q&A event with British Academy President Lord Nicholas Stern in London, Yellen on Tuesday highlighted positive results from the Fed’s recent “stress test” reviews of America’s big banks, and said she doesn’t believe another financial crisis will occur “in our lifetimes.”

“Would I say there will never, ever be another financial crisis? … Probably that would be going too far. But I do think we’re much safer, and I hope that it will not be in our lifetimes, and I don’t believe it will be,” Yellen said.

Not to be outdone our Great Leader President Trump had this to say…..

Claims US ‘on the Verge of a New Economic Miracle

“Today we stand on the verge of a new economic miracle. Our economy has already surged to 3 percent growth … We’ve created 2.2 million jobs since the [2016 presidential] election; unemployment is at a 17-year low,” he said.

Fair enough, but there is one big problem. 

Economic miracles don’t start when your debt is $20 Trillion, when the government is running a massive deficit, when only the corporations/rich benefit from your tax cuts, when the FED is printing money and the stock market is in a bubble of historic proportions.

No, Sir, economic miracles start from the bottom. Not with the last hurray of free money that will be used for stock buybacks in an attempt to keep the party going a little bit longer. 

Long story short, I have never in my life have seen such bullish sentiment from the people who shouldn’t have an opinion. At the very least, they shouldn’t be pumping this financial mess up. Mark my words, this will come back to destroy them.

If you would like to find out exactly what happens next based on our Timing and Mathematical work, please Click Here.