
Weekly Stock Market Update & Forecast – November 24th, 2017
 – State of the Market Address:
- The Dow remains well above 23,000.
- Shiller’s Adjusted S&P P/E ratio is now at 31.58 Now at arguably the highest level in history (if we adjust for 2000 distortions) and still above 1929 top of 29.55.
- Weekly RSI at 78 – overbought. Daily RSI is at 62- neutral.
- Prior years corrections terminated at around 200 day moving average. Located at around 18,400 today (on weekly).
- Weekly Stochastics at 92 – overbought. Daily at 84 – neutral.
- NYSE McClellan Oscillator is at +23. Neutral.
- Volatility measures VIX/VXX remains at suppressed levels. Commercial VIX long interest declined slightly to 75K contracts net long.
- Last week’s CTO Reports suggest that commercials (smart money) are shifting their positioning back to net short. Short interest has shifted slightly lower during the week. For now, the Dow is 7X, the S&P is at 3X net short, Russell 2000 is now at 5X net short and the Nasdaq is net neutral.
In summary: For the time being and long-term, the market remains in a clear bull trend. Yet, a number of longer-term indicators suggest the market might experience a substantial correction ahead. Plus, the “smart money” is positioning for some sort of a sell-off.
If you would like to find out exactly what happens next based on our Timing and Mathematical work, please Click Here.
ATTENTION!!! Please note, we have moved most of our free editorial content to our new website MarketSpartans.com Please Click Here to view it.
ELLIOTT WAVE UPDATE:
Since many people have asked, I will attempt to give you my interpretation of Elliott Wave and how it is playing out in the market. First, I must admit. I don’t claim to be an EW expert, but I hope my “standard” interpretation is of help.
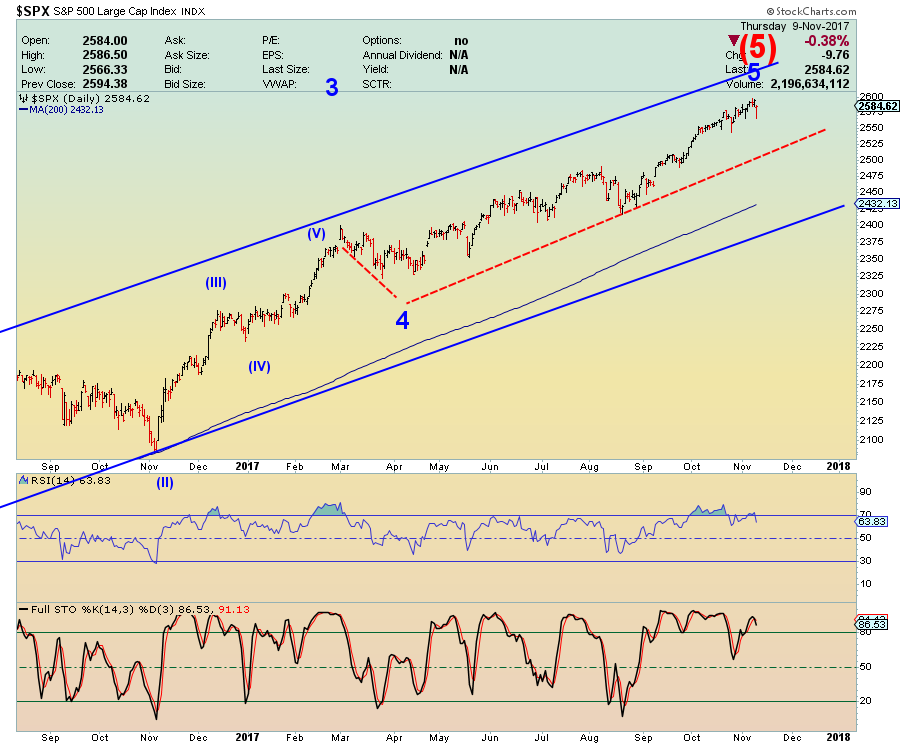
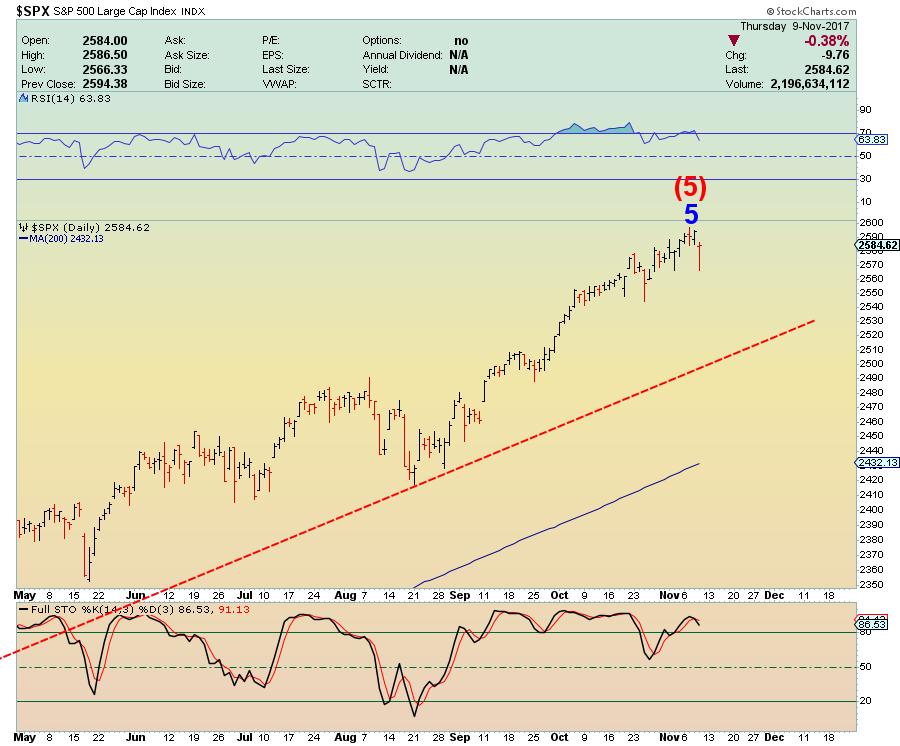
Let’s take a look at the most likely recent count on the S&P.
Explanation:
Long-Term: It appears the S&P is quickly approaching the termination point of its (5) wave up off of 2009 bottom. If true,we should see a massive sell-off later this year. Did it already complete? Click Here
Short-Term: It appears the S&P might have completed its intermediary wave 3 and now 4. It appears the market is now pushing higher to complete wave 5 of (5). If true, the above count should terminate the bull market. Did it already complete? Click Here
 If you would like to find out exactly what happens next based on our Timing and Mathematical work, please Click Here.
ATTENTION!!! Please note, we have moved most of our free editorial content to our new website MarketSpartans.com Please Click Here to view it.
Investment Wisdom Of The Day
Daily Stock Market Update & Forecast – November 22nd, 2017
 – State of the Market Address:
- The Dow remains well above 23,000.
- Shiller’s Adjusted S&P P/E ratio is now at 31.51 Now at arguably the highest level in history (if we adjust for 2000 distortions) and still above 1929 top of 29.55.
- Weekly RSI at 78 – overbought. Daily RSI is at 61- neutral.
- Prior years corrections terminated at around 200 day moving average. Located at around 18,300 today (on weekly).
- Weekly Stochastics at 92 – overbought. Daily at 73 – neutral.
- NYSE McClellan Oscillator is at +3. Neutral.
- Volatility measures VIX/VXX remains at suppressed levels. Commercial VIX long interest declined slightly to 75K contracts net long.
- Last week’s CTO Reports suggest that commercials (smart money) are shifting their positioning back to net short. Short interest has shifted slightly lower during the week. For now, the Dow is 7X, the S&P is at 2X net short, Russell 2000 is now at 5.5X net short and the Nasdaq is net neutral.
In summary: For the time being and long-term, the market remains in a clear bull trend. Yet, a number of longer-term indicators suggest the market might experience a substantial correction ahead. Plus, the “smart money” is positioning for some sort of a sell-off.
If you would like to find out exactly what happens next based on our Timing and Mathematical work, please Click Here.
ATTENTION!!! Please note, we have moved most of our free editorial content to our new website MarketSpartans.com Please Click Here to view it.
Ron Paul Asks: Why Are We Helping Saudi Arabia Destroy Yemen?
Something we have been wondering ourselves.
by Ron Paul:
It’s remarkable that whenever you read an article about Yemen in the mainstream media, the central role of Saudi Arabia and the United States in the tragedy is glossed over or completely ignored. A recent Washington Post article purporting to tell us “how things got so bad” explains to us that, “it’s a complicated story” involving “warring regional superpowers, terrorism, oil, and an impending climate catastrophe.”
No, Washington Post, it’s simpler than that. The tragedy in Yemen is the result of foreign military intervention in the internal affairs of that country. It started with the “Arab Spring” which had all the fingerprints of State Department meddling, and it escalated with 2015’s unprovoked Saudi attack on the country to re-install Riyadh’s preferred leader. Thousands of innocent civilians have been killed and millions more are at risk as starvation and cholera rage.
We are told that US foreign policy should reflect American values. So how can Washington support Saudi Arabia – a tyrannical state with one of the worst human rights record on earth – as it commits by what any measure is a genocide against the Yemeni people? The UN undersecretary-general for humanitarian affairs warned just last week that Yemen faces “the largest famine the world has seen for many decades with millions of victims.” The Red Cross has just estimated that a million people are vulnerable in the cholera epidemic that rages through Yemen.
And why is there a cholera epidemic? Because the Saudi government – with US support – has blocked every port of entry to prevent critical medicine from reaching suffering Yemenis. This is not a war. It is cruel murder.
The United States is backing Saudi aggression against Yemen by cooperating in every way with the Saudi military. Targeting, intelligence, weapons sales, and more. The US is a partner in Saudi Arabia’s Yemen crimes.
Does holding hands with Saudi Arabia as it slaughters Yemeni children really reflect American values? Is anyone even paying attention?
The claim that we are fighting al-Qaeda in Yemen and thus our involvement is covered under the post-9/11 authorization for the use of force is without merit. In fact it has been reported numerous times in the mainstream media that US intervention on behalf of the Saudis in Yemen is actually a boost to al-Qaeda in the country. Al-Qaeda is at war with the Houthis who had taken control of much of the country because the Houthis practice a form of Shi’a Islam they claim is tied to Iran. We are fighting on the same side as al-Qaeda in Yemen.
Adding insult to injury, the US Congress can’t be bothered to even question how we got so involved in a war that has nothing to do with us. A few conscientious Members of Congress got together recently to introduce a special motion under the 1973 War Powers Act that would have required a vote on our continued military involvement in the Yemen genocide. The leadership of both parties joined together to destroy this attempt to at least get a vote on US aggression against Yemen. As it turns out, the only Members to vote against this shamefully gutted resolution were the original Members who introduced it. This is bipartisanship at its worst.
US involvement in Saudi Arabia’s crimes against Yemen is a national disgrace. That the mainstream media fails to accurately cover this genocide is shameful. Let us join our voices now to demand that our US Representatives end US involvement in Yemen immediately!
Daily Stock Market Update & Forecast – November 20th, 2017
 – State of the Market Address:
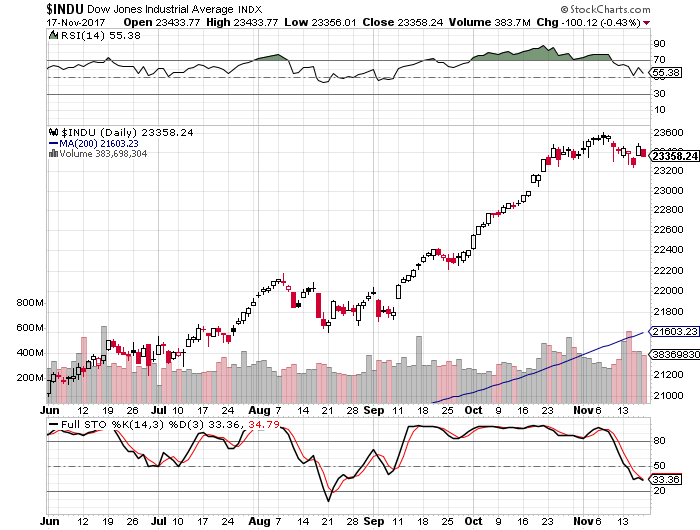
- The Dow remains well above 23,000.
- Shiller’s Adjusted S&P P/E ratio is now at 31.51 Now at arguably the highest level in history (if we adjust for 2000 distortions) and still above 1929 top of 29.55.
- Weekly RSI at 77 – overbought. Daily RSI is at 59- neutral.
- Prior years corrections terminated at around 200 day moving average. Located at around 18,300 today (on weekly).
- Weekly Stochastics at 90 – overbought. Daily at 48 – neutral.
- NYSE McClellan Oscillator is at +3. Neutral.
- Volatility measures VIX/VXX remains at suppressed levels. Commercial VIX long interest declined slightly to 75K contracts net long.
- Last week’s CTO Reports suggest that commercials (smart money) are shifting their positioning back to net short. Short interest has shifted slightly lower during the week. For now, the Dow is 7X, the S&P is at 2X net short, Russell 2000 is now at 5.5X net short and the Nasdaq is net neutral.
In summary: For the time being and long-term, the market remains in a clear bull trend. Yet, a number of longer-term indicators suggest the market might experience a substantial correction ahead. Plus, the “smart money” is positioning for some sort of a sell-off.
If you would like to find out exactly what happens next based on our Timing and Mathematical work, please Click Here.
ATTENTION!!! Please note, we have moved most of our free editorial content to our new website MarketSpartans.com Please Click Here to view it.
Trade Of The Day – The Japanese Yen (JPY)
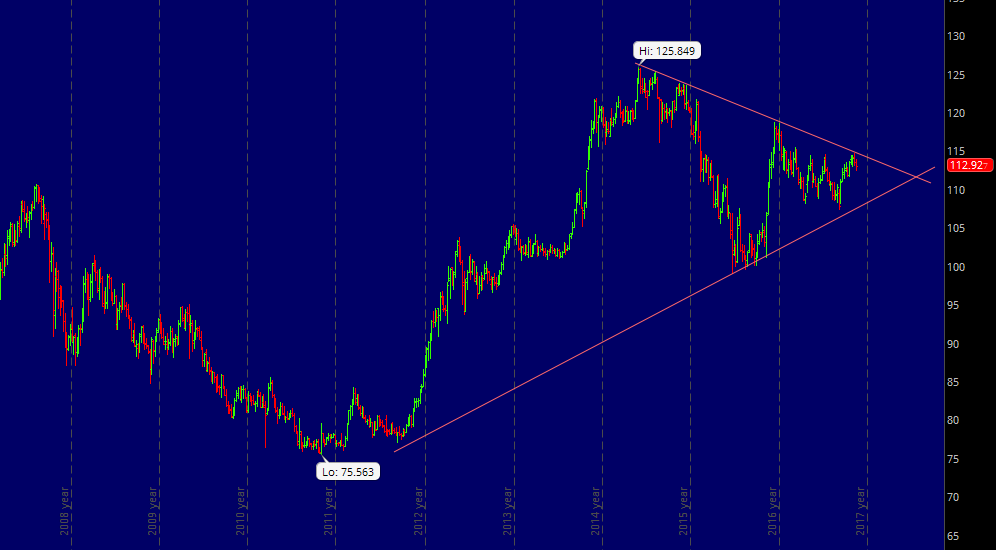
The Japanese Yen has been compressing into a massive long-term wedge over the last 6 years and it is getting exciting. With the wedge terminating over the next few months, the next move in the currency will be massive. Up or down. This move, of course, will have significant impact on the US stock market. If you would like to find out which way this powerful compression will break and when, please Click Here.
This Shockingly Simple Metric Confirms – The Stock Market Is Incredibly Overpriced
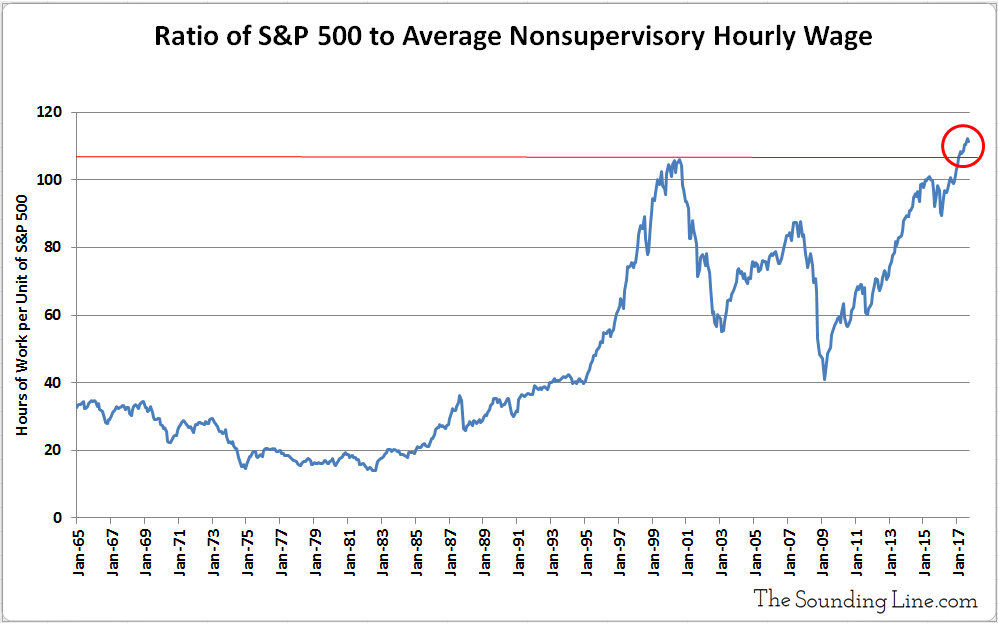
In today’s environment bulls and bears can argue until the second coming of Jesus about whether or not today’s stock market is overpriced. Taking all sort of shortcuts and coming to questionable conclusions in the process.
The chart above is rather self explanatory. Today it takes 115 hours of wages to buy 1 share of the S&P 500. No fudging numbers, no complex formulas and no human error. The highest level in recorded history. Higher than 1929, 2007 and even 2000.
And while the bulls would argue today’s low interest rates justify the above valuations, nothing could be further from the truth. But who am I to tell you not to pay extravagant prices for today’s below average debt inflated earnings.
If you would like to find out exactly what happens next based on our Timing and Mathematical work, please Click Here.
Investment Grin Of The Day
Is Gold Testing Resistance Just Prior To A Massive Run Up – Trade Of The Day

We have discussed the chart above many times before. As is evident, Gold was tracing out a massive long-term compressing wedge/triangle. Breaking out of it to the upside over the last few weeks. Since then Gold has retraced its move up to test prior resistance (upper red line). Traditional technical analysis suggests that as soon as this test completes, Gold will be ready to fly to the upside. Is it that easy or is something much more sinister is in the works? To see our entire Gold analysis please Click Here


