InvestWithAlex.com 

FED’s Stupidity Or Incompetence Is Beyond Belief

Sometimes I read something that really gets my blood boiling. Here is the latest from the Ponzi Operators who are literally running our country into the ground.

Evans Says Fed Must Convince Public It Will Allow More Inflation

“In order to dispel any impression that 2 percent is a ceiling, our communications should be much clearer about our willingness to deliver on a symmetric inflation outcome, acknowledging a greater chance of inflation at 2.5 percent in the future than what has been communicated in the past,” he said in remarks prepared for a speech in London.

“I am concerned that persistent factors are holding down inflation, rather than idiosyncratic transitory ones,” Evans said, citing declines in various measures of inflation expectations in recent years.

“By and large, central bankers are conservative types who view their most important task as preventing an outbreak of 1970s-style inflation,” he said. “So perhaps then it’s not surprising that we as a group have not convincingly demonstrated to the public our commitment to a symmetric inflation target.”

Excuse my language, but these so called “smart guys” are f#*$ing morons in suits. 

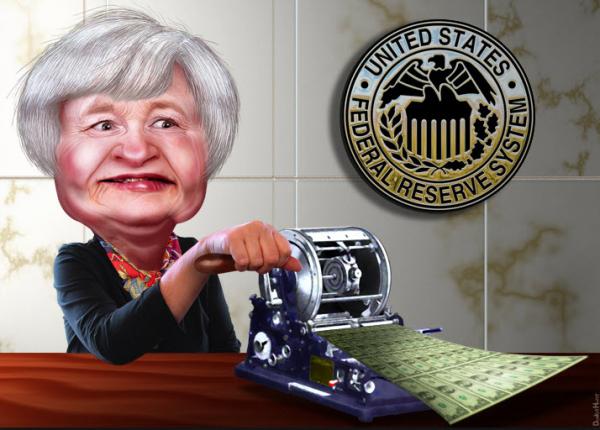
I am not sure how many times I have to repeat myself here, but here we go. The FED is wondering where in the world inflation is after pumping Trillions of dollars into the economy through zero interest rates and QE.

The inflation they seek is responsible for blowing up historic bubbles of unbelievable proportions in the stock market, the bond market, the art market, the real estate market, Bitcoin, etc….

Basically, all speculative assets. 

The debt they have created doing so is deflationary in nature. That is why the real economy cannot get inflation going. As has been the case in Japan. What’s worse, when the velocity of credit runs out, the overall economy will slip back into a deflationary spiral. As bad debts will have to be liquidated.

The only way to avoid a deflationary collapse is  through outright monetization. And while slow erosion of the dollar sounds good in theory, any sort of a violent adjustment there can end up being far worse than a deflationary collapse.

Idiots, idiots I tell you!!! 

If you would like to find out exactly what happens next based on our Timing and Mathematical work, please Click Here. 

Trade Of The Day – Junk (HYG)

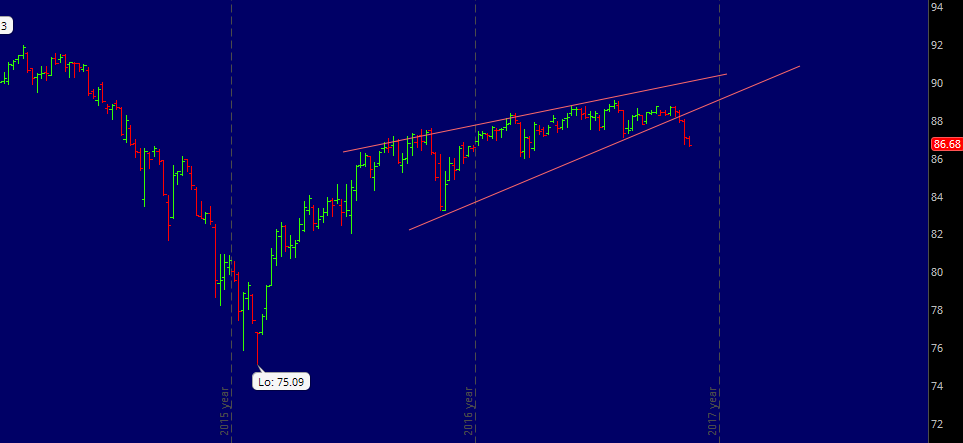
We have been following the chart above and its compressing wedge for quite some time now. As is evident, the wedge was broken to the downside. Suggesting that a much bigger move down is in the works. And that what has so many people worried. Not only about the bond market, but also about the health of the overall stock market. Will this breakdown continue or is this a false break? To find out please Click Here. 

Trade Of The Day – US Dollar (DXY)

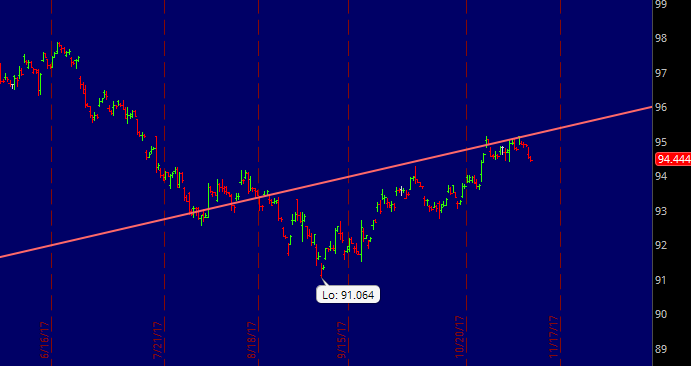
Most market commentators and investors believe the USD has bottomed in early September. And while that might very well be the case, the overall setup is not that easy. In addition to a powerful TIME turning point arriving NOW, the USD has been unable to push above prior support (red line). That is net bearish in itself. If you would like to find out what the USD will do next and when, please Click Here

Trade Of The Day – OIL (CL)

Is oil breaking out? As the chart above suggests, Crude Light has broken out of its longer-term compressing wedge. The break is clear, suggesting much higher prices ahead. Yet, it might not be as easy as that. A much more powerful resistance level lies just ahead and if oil is unable to break above it, much lower prices are ahead for the commodities. That is exactly what we talk about in our membership section. To learn more, please Click Here

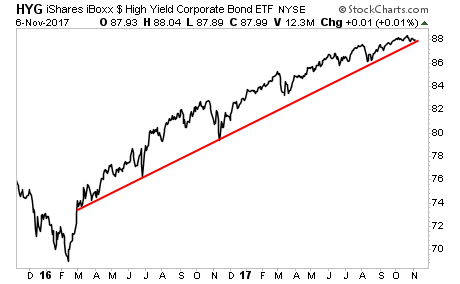
Trade Of The Day – Junk Bonds (HYG)

As the chart above suggests and as our analysis indicates, HYG finds itself at a critical juncture. Should it break support, it might signal, for the first time since 2016 rally has started that a bull move in stocks might be coming to an end. Just as well, HYG might be setting itself up for a massive move down. We discuss all of that in our member section. If you would like to find out what happens next, please Click Here 

Well, in terms of the stock market, the situation is incredibly complex. If you would like to find out what happens next, based on our mathematical and timing work, please Click Here.

Weekly Stock Market Update & Forecast – November 4th, 2017

– State of the Market Address:

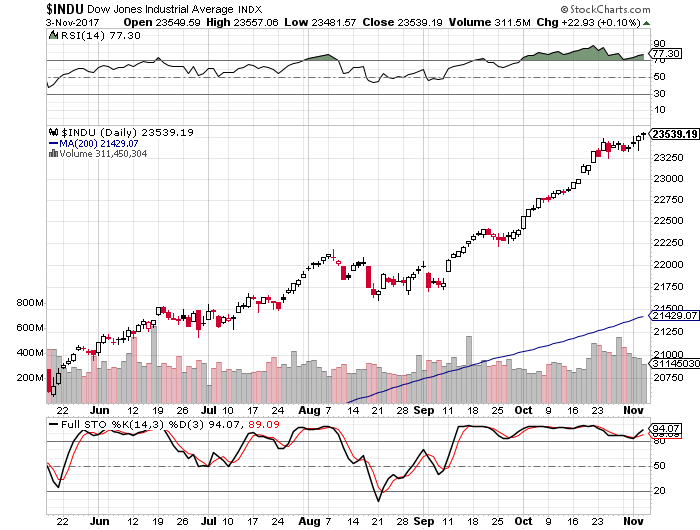
  • The Dow remains well above 23,000.
  • Shiller’s Adjusted S&P P/E ratio is now at 31.57 Now at arguably the highest level in history (if we adjust for 2000 distortions) and still above 1929 top of 29.55.
  • Weekly RSI at 82 – overbought. Daily RSI is at 74 – overbought.
  • Prior years corrections terminated at around 200 day moving average. Located at around 18,300 today (on weekly).
  • Weekly Stochastics at 99 – severely overbought. Daily at 94 – overbought.
  • NYSE McClellan Oscillator is at -20.Neutral.
  • Volatility measures VIX/VXX remains at suppressed levels. Commercial VIX long interest decreased slightly to 83K contracts net long. 
  • Last week’s CTO Reports suggest that commercials (smart money) are shifting their positioning back to net short. Short interest has shifted slightly higher during the week. For now, the Dow is 7X, the S&P is at 3X net short, Russell 2000 is now at 7.5X net short and the Nasdaq is net neutral.

In summary: For the time being and long-term, the market remains in a clear bull trend. Yet, a number of longer-term indicators suggest the market might experience a substantial correction ahead.  Plus, the “smart money” is positioning for some sort of a sell-off.

If you would like to find out exactly what happens next based on our Timing and Mathematical work, please Click Here. 

ATTENTION!!! Please note, we have moved most of our free editorial content to our new website MarketSpartans.com Please Click Here to view it.


ELLIOTT WAVE UPDATE:

Since many people have asked, I will attempt to give you my interpretation of Elliott Wave and how it is playing out in the market. First, I must admit. I don’t claim to be an EW expert, but I hope my “standard” interpretation is of help.

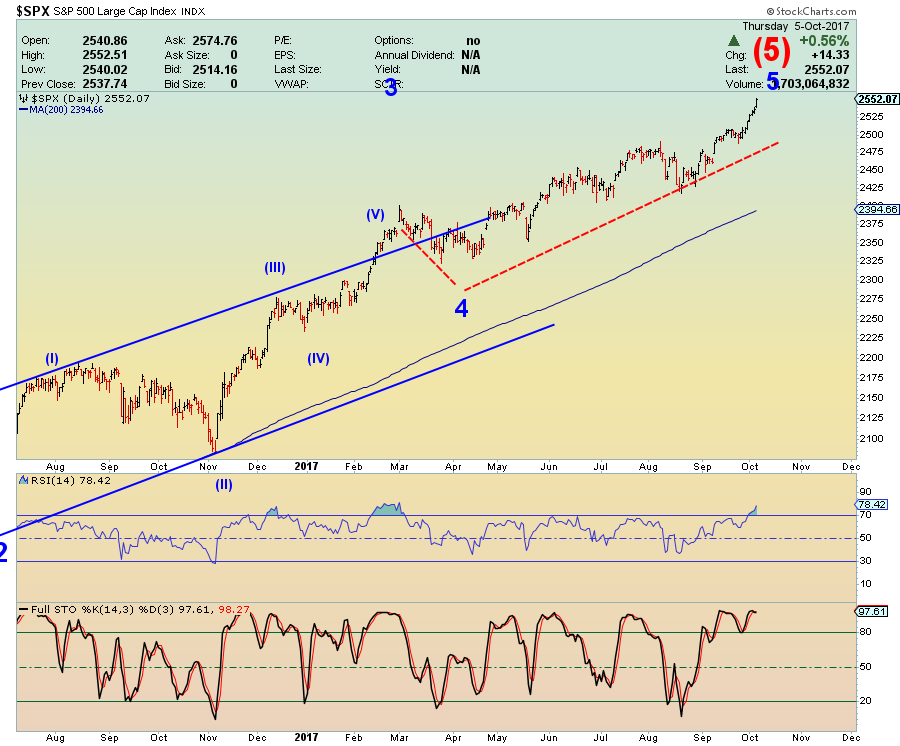
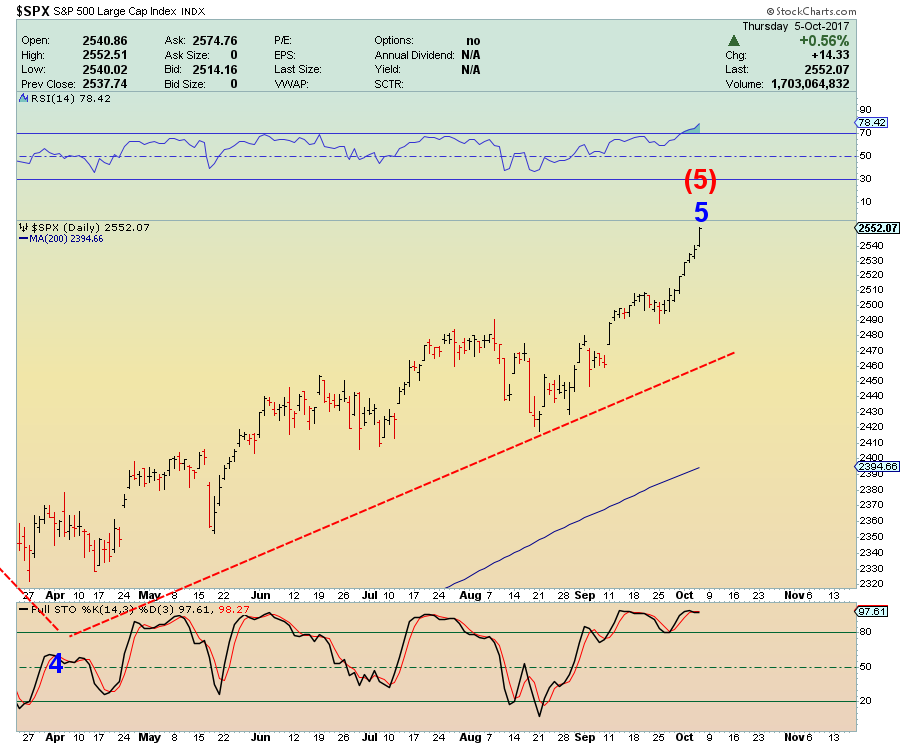
Let’s take a look at the most likely recent count on the S&P.

Explanation:

Long-Term: It appears the S&P is quickly approaching the termination point of its (5) wave up off of 2009 bottom. If true,we should see a massive sell-off later this year. Did it already complete? Click Here

Short-Term: It appears the S&P might have completed its intermediary wave 3 and now 4. It appears the market is now pushing higher to complete wave 5 of (5). If true, the above count should terminate the bull market. Did it already complete? Click Here

If you would like to find out exactly what happens next based on our Timing and Mathematical work, please Click Here. 


ATTENTION!!! Please note, we have moved most of our free editorial content to our new website MarketSpartans.com Please Click Here to view it.


What If President Trump Is Indeed Brilliant – And If He Is – Will He Collapse The Stock Market Next

I am going to propose something outlandish here. President Trump is indeed playing 8 dimensional chess while the rest of us are trying to figure out checkers. Bare with me for a second.

As you know, I have been an outspoken critic of President Trump over the last few months,  after voting for the guy in November.

Why? 

Well, he has flipped on nearly all major issues he has campaigned on. In addition, he has turned into a psychopathic warmonger who is now inches away from a nuclear conflict.

Finally, he has taken credit for the stock market run up that has nothing to do with him personally. A huge mistake that we have covered here before  Trump Voter: Is President Trump A Complete Idiot Or Just Pretending To Be?

If you recall, during the Presidential campaign Mr. Trump has said that the stock market is in a “Big, Fat and Ugly”, bubble and that Janet Yellen was juicing it.  That is to say, he is very much aware of the fact that we are in a financial bubble.

Anyway, this post is already getting long, so, here is my hypothesis……

  1. Trump is very much aware of the stock market bubble.
  2. He proceeded to juice the market with the help of central bankers and his tax plan. Tax plan that was very short on detail until a few weeks ago. Even now it is just a 9 page summary that quite a few people have said is full of hot air and will never pass in its current form. Perhaps that was done by design as well. I suggest you read David Stockman’s Blog in that regard or if you need more information.
  3. Once the Congress kills Trump’s tax plan, the stock market will/should collapse. We even get this Treasury secretary: Pass a tax bill or markets will tank
  4. Market crashes from today’s obscene valuation levels.

Any rational person might be questioning my sanity right about now, wondering what in the world am I talking about.

That would be 2018 mid-term elections.

To basically drain the swamp and to assume full control. Just imagine what would happen if Trump points towards  the legislative branch and blames them for the market/economic collapse. They will be thrown out of office. Checkmate and game over.

I guess we can conclude this with 3 simple questions. Have I lost my mind? Is President Trump an Idiot? Is President Trump playing at a much higher playing field that we mere mortals don’t understand?

I guess we are about to find out. 

In terms of the stock market, the situation is incredibly complex. If you would like to find out what happens next, based on our mathematical and timing work, please Click Here.

As The FED Predicts Inflation Should We Prepare For A Massive Deflationary Spiral?

If there is one conundrum Janet Yellen can’t explain, or so she claims, is the case of missing inflation. After all, after printing Trillions in a zero interest rate environment it should be clearly evident.

It is not. The 10-Year note is slightly above 2% while most commodities are in various stages of a bear market.

I find it difficult to believe that Ponzi Finance operators at the FED can’t figure out where their missing inflation is. For GOD’s sake, just read this blog.

Most of the money that Janet Yellen and other central bankers printed went directly into speculative assets. You know….. stocks, bonds, real estate, bitcoin, art, fancy cars, etc…..That is the reason the stock market is selling at the highest valuation level in history.

Instead, we get the following nonsense from the FED

“We continue to expect that the ongoing strength of the recovery will warrant gradual increases in that rate to sustain a healthy labor market and stabilize inflation around our 2 percent longer-run objective.” Fed officials are nonetheless watching price pressures closely, Yellen said, as the “biggest surprise in the U.S. economy this year has been inflation.”

Sure, the economy appears strong because the FED has used its unlimited credit card to give an appearance of prosperity. Yet, the underlying issue of massive debt loads remains.

And that is precisely why we will not see inflation. Just a deflationary collapse.

Again, we have already witnessed this inflation in asset prices, now at unsustainable levels. When the debt bubble finally pops, so will those values.  That alone will plunge us back into a deflationary spiral or where we left of in 2008-2009.

Only outright monetization or debt default can trigger inflation at this stage. But that comes at a price as well. Interesting times ahead….that’s for sure.

In terms of the stock market, the situation is incredibly complex. If you would like to find out what happens next, based on our mathematical and timing work, please Click Here.

Weekly Stock Market Update & Forecast – October 13th, 2017

– State of the Market Address:

  • The Dow is now approaching 23,000.
  • Shiller’s Adjusted S&P P/E ratio is now at 31.15 Now at arguably the highest level in history (if we adjust for 2000 distortions) and still above 1929 top of 29.55.
  • Weekly RSI at 77 – overbought. Daily RSI is at 78 overbought.
  • Prior years corrections terminated at around 200 day moving average. Located at around 18,100 today (on weekly).
  • Weekly Stochastics at 99 overbought. Daily at 96 – severely overbought.
  • NYSE McClellan Oscillator is at +9. Neutral.
  • Volatility measures VIX/VXX remains at suppressed levels. Commercial VIX long interest increased to 112K contracts net long. 
  • Last week’s CTO Reports suggest that commercials (smart money) are shifting their positioning back to net short. Short interest has shifted slightly higher during the week. For now, the Dow is 10X, the S&P is at 3X net short, Russell 2000 is now at 8X net short and the Nasdaq is net neutral.

In summary: For the time being and long-term, the market remains in a clear bull trend. Yet, a number of longer-term indicators suggest the market might experience a substantial correction ahead.  Plus, the “smart money” is positioning for some sort of a sell-off.

If you would like to find out exactly what happens next based on our Timing and Mathematical work, please Click Here. 

ATTENTION!!! Please note, we have moved most of our free editorial content to our new website MarketSpartans.com Please Click Here to view it.


ELLIOTT WAVE UPDATE:

Since many people have asked, I will attempt to give you my interpretation of Elliott Wave and how it is playing out in the market. First, I must admit. I don’t claim to be an EW expert, but I hope my “standard” interpretation is of help.

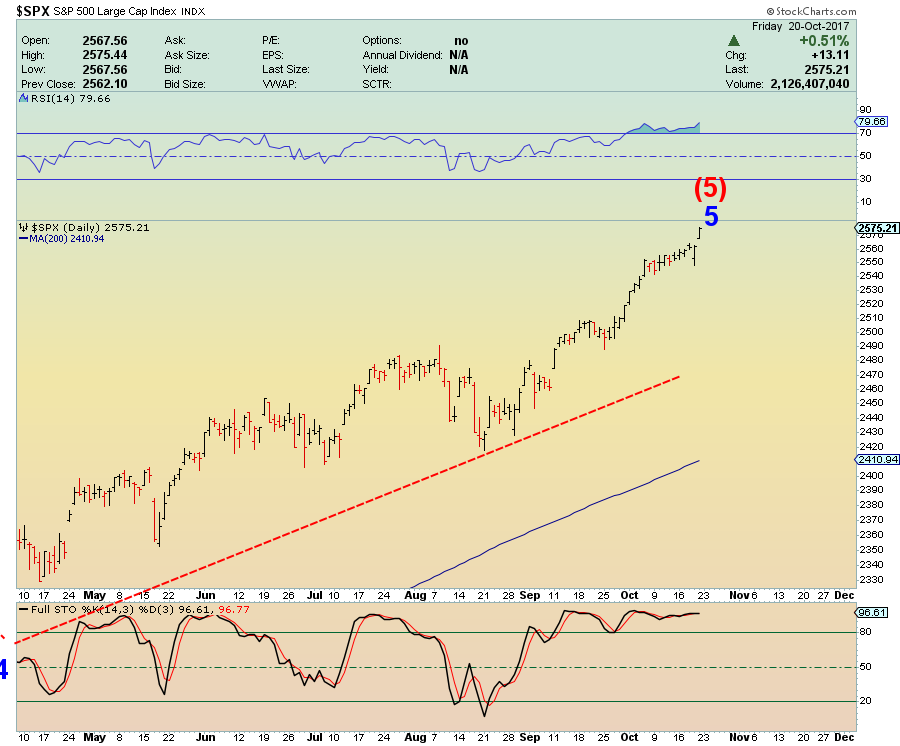
Let’s take a look at the most likely recent count on the S&P.

Explanation:

Long-Term: It appears the S&P is quickly approaching the termination point of its (5) wave up off of 2009 bottom. If true,we should see a massive sell-off later this year. Did it already complete? Click Here

Short-Term: It appears the S&P might have completed its intermediary wave 3 and now 4. It appears the market is now pushing higher to complete wave 5 of (5). If true, the above count should terminate the bull market. Did it already complete? Click Here

If you would like to find out exactly what happens next based on our Timing and Mathematical work, please Click Here. 


ATTENTION!!! Please note, we have moved most of our free editorial content to our new website MarketSpartans.com Please Click Here to view it.