InvestWithAlex.com 

The Cost Of Missing Out On Today’s Rally Is Staggering

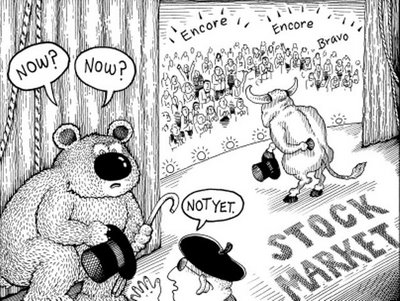
Or so says the mainstream financial media. According to them, you must be some sort of a crazy lunatic not to believe in what the market is doing. After all, the returns are easy and sweet.

I have personally heard it all before at 2000 and 2007 tops. And I have read about the many other instances where the above statement makes a rare appearance. Just take a brief look at how bullish this article is……

Bloomberg: The Cost of Missing the Market Boom Is Skyrocketing

Skepticism in global equity markets is getting expensive.

From Japan to Brazil and the U.S. as well as places like Greece and Ukraine, an epic year in equities is defying naysayers and rewarding anyone who staked a claim on corporate ownership. Records are falling, with about a quarter of national equity benchmarks at or within 2 percent of an all-time high.

You’ve heard people being bearish for eight years. They were wrong,” said Jeffrey Saut, chief investment strategist at St. Petersburg, Florida-based Raymond James Financial Inc., which oversees $500 billion. “The proof is in the returns.”

To put this year’s gains in perspective, the value of global equities is now 3 1/2 times that at the financial crisis bottom in March 2009. Aided by an 8 percent drop in the U.S. currency, the dollar-denominated capitalization of worldwide shares appreciated in 2017 by an amount — $20 trillion — that is comparable to the total value of all equities nine years ago.

And yet skeptics still abound, pointing to stretched valuations or policy uncertainty from Washington to Brussels. Those concerns are nothing new, but heeding to them is proving an especially costly mistake.

Clinging to such concerns means discounting a harmonized recovery in the global economy that’s virtually without precedent — and set to pick up steam, according to the International Monetary Fund. At the same time, inflation remains tepid, enabling major central banks to maintain accommodative stances.

“When policy is easy and growth is strong, this is an environment more conducive for people paying up for valuations,” said Andrew Sheets, chief cross-asset strategist at Morgan Stanley. “The markets are up in line with what the earnings have done, and stronger earnings helped drive a higher level of enthusiasm and a higher level of risk taking.”

The numbers are impressive: more than 85 percent of the 95 benchmark indexes tracked by Bloomberg worldwide are up this year, on course for the broadest gain since the bull market started. Emerging markets have surged 31 percent, developed nations are up 16 percent.

Big companies are becoming huge, from Apple Inc. to Alibaba Group Holding Ltd. Technology megacaps occupy all top six spots in the ranks of the world’s largest companies by market capitalization for the first time ever.

Up 39 percent this year, the $1 trillion those firms added in value equals the combined worth of the world’s six-biggest companies at the bear market bottom in 2009. Apple, priced at $810 billion, is good for the total value of the 400 smallest companies in the S&P 500.

Overall, U.S. corporate earnings are expected to rise 11 percent this year, on track to be the best profit growth since 2010. And after years of disappointments, European profits are set to climb 14 percent in 2017, Bloomberg data show. The expectations for both regions are are roughly in line with forecasts made at the beginning of the year, defying the usual pattern of analysts downgrading their estimates as the months go by.

Meanwhile, Asia is home to some of the world’s steepest rallies, led by Hong Kong stocks that are up 29 percent this year. Shares in Tokyo also hit fresh decade highs this week, bolstered by investor confidence before the local corporate earnings season and a snap election this month.

“Asia will benefit from continued improving regional growth, stable macroeconomic conditions and undemanding valuations,” said BNP Paribas Asset Management’s head of Asia Pacific equities Arthur Kwong. Any pullback in Asian equities after the year-to-date rally presents a buying opportunity for long-term investors, he wrote in a note.

Global economic growth has been robust in most places, with Europe finally joining the party and the euro-area economy on track for its best year since at least 2010. The region’s steady recovery has eclipsed worries about populism, which a few years ago would have been enough to derail any stock market rally.

“I’ve never been so optimistic about the global economy,” said Vincent Juvyns, global market strategist at J.P. Morgan Asset Management. “Ten years after the financial crisis, Europe is recovering and we have synchronized economic growth around the world. Even if we get it wrong on a country or two, it doesn’t change the big picture, which is positive for the equity markets.”

Alright, alright……..I am a believer. Here, take my money and buy me those FANG things. And don’t forget some Bitcoin. I’ve never been so optimistic about any of this. 

On a more serious note and if you recall, these views were nowhere to be found at 2016 lows. On the contrary, many of the same people were expecting a collapse. Now they are as optimistic as ever. Perhaps that should be taken as a warning sign.

Finally and if history is any guide, be careful, the market might wipe out the above gains and excitement in a matter of days. Sending the cost of participating in this rally to the moon and back.

In terms of the stock market, the situation is incredibly complex. If you would like to find out what happens next, based on our mathematical and timing work, please Click Here.

Daily Stock Market Update & Forecast – September 14th, 2017 – Elliott Wave Edition

ELLIOTT WAVE UPDATE:

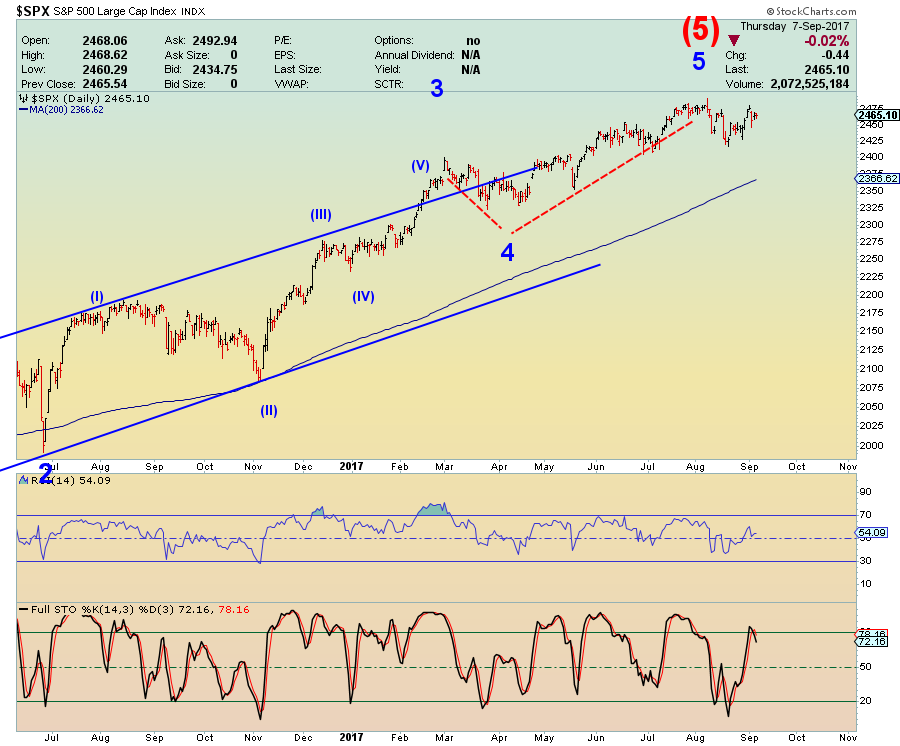
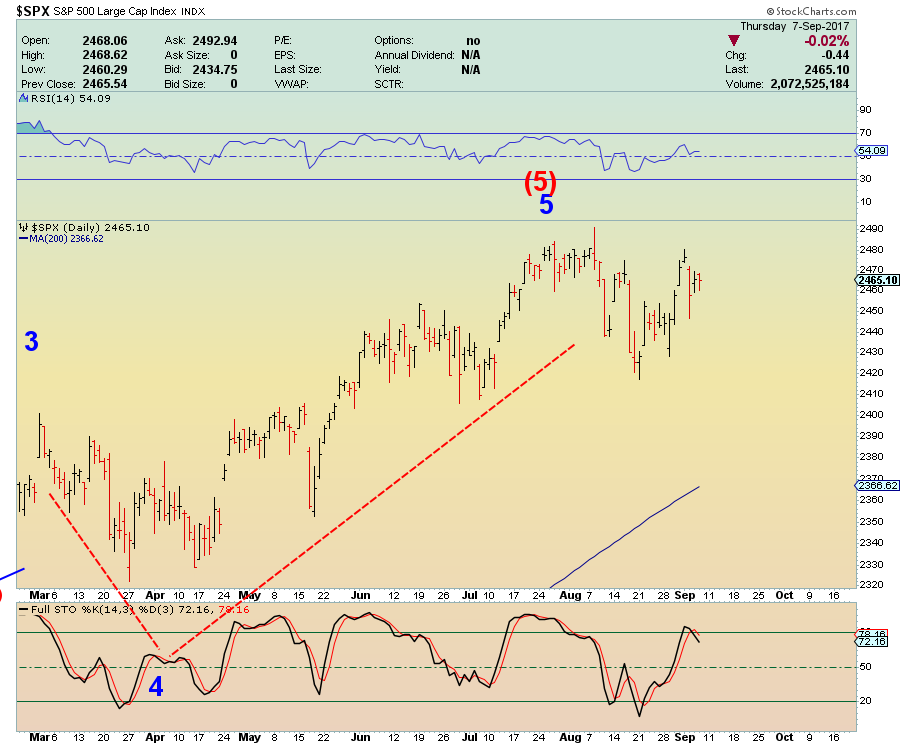
Since many people have asked, I will attempt to give you my interpretation of Elliott Wave and how it is playing out in the market. First, I must admit. I don’t claim to be an EW expert, but I hope my “standard” interpretation is of help.

Let’s take a look at the most likely recent count on the S&P.

Explanation:

Long-Term: It appears the S&P is quickly approaching the termination point of its (5) wave up off of 2009 bottom. If true,we should see a massive sell-off later this year. Did it already complete? Click Here

Short-Term: It appears the S&P might have completed its intermediary wave 3 and now 4. It appears the market is now pushing higher to complete wave 5 of (5). If true, the above count should terminate the bull market. Did it already complete? Click Here

If you would like to find out exactly what happens next based on our Timing and Mathematical work, please Click Here. 


ATTENTION!!! Please note, we have moved most of our free editorial content to our new website MarketSpartans.com Please Click Here to view it.


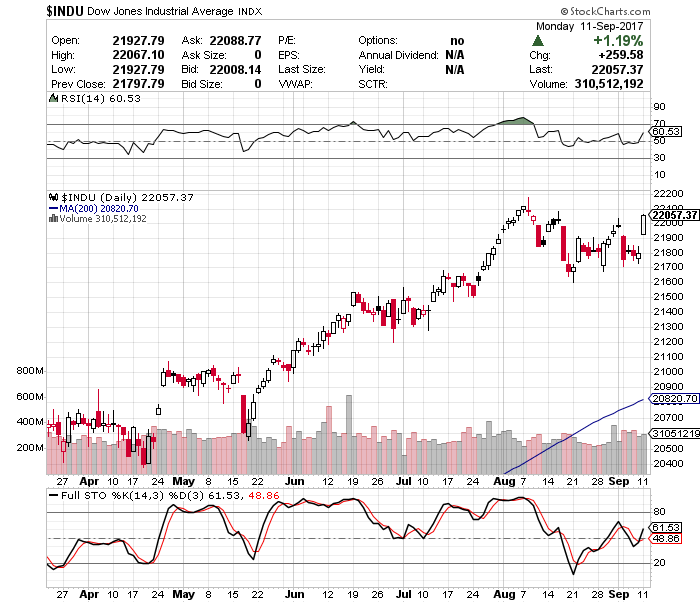
Daily Stock Market Update & Forecast – September 11th, 2017

– State of the Market Address:

  • The Dow finds itself back above 22,000.
  • Shiller’s Adjusted S&P P/E ratio is now at 30.45 Slightly off highs, but still…..arguably the highest level in history (if we adjust for 2000 distortions) and still above 1929 top of 29.55.
  • Weekly RSI at 67.86  – neutral. Daily RSI is at 60.53 – neutral.
  • Prior years corrections terminated at around 200 day moving average. Located at around 18,000 today (on weekly).
  • Weekly Stochastics at 78.82 – overbought. Daily at 51.53 – neutral.
  • NYSE McClellan Oscillator is at +13. Neutral.
  • Volatility measures VIX/VXX remains at suppressed levels Commercial VIX long interest increased slightly to 75K contracts net long. 
  • Last week’s CTO Reports suggest that commercials (smart money) are shifting their positioning back to net neutral. Short interest has shifted slightly lower during the week. For now, the Dow is 7X, the S&P is at 3X, Russell 2000 and the Nasdaq are net neutral. That is a substantial short position against the market.

In summary: For the time being and long-term, the market remains in a clear bull trend. Yet, a number of longer-term indicators suggest the market might experience a substantial correction ahead.  Plus, the “smart money” is positioning for some sort of a sell-off.

If you would like to find out exactly what happens next based on our Timing and Mathematical work, please Click Here. 


ATTENTION!!! Please note, we have moved most of our free editorial content to our new website MarketSpartans.com Please Click Here to view it.


Why Russia Believes The US Is Preparing For An Immediate War – Possibly Thermonuclear

If you are semi-aware of what is going on in the world you are familiar with the fact that Mr. Kim has been pocking Mr. Trump in the eye with his never ending and annoying missile launches. And doing so fairly successfully I might add.

“All options are on the table” is the lackluster response President Trump has been able to muster up thus far. The MSM believes in one of two things. First, any war with North Korea in unlikely. Second, in an unlikely case of a war, Seal Team 6 will liberate North Korea in about 30 minutes.

Our Russian counterparts hold a completely different view. Something worth listening to. In nothing else to protect your stock market profits.

‘Americans Preparing for War’: Why US Testing B61-12 Nuclear Bomb 

The recent flight tests of an upgraded nuclear bomb in the Nevada desert mean that the United States is preparing for war, military analyst Oleg Glazunov told Sputnik.

Just a few minutes ago I posted the following link Top Forecaster Predicts War With North Korea By September 12th

My analysis is as follows: 

There will be a devastating conflict with North Korea over the next two months. And yes, there is a real possibility that this conflict will go nuclear. If so, millions will die in Seoul, South Korea alone. As crazy as that may sound today.

Most importantly, there will be no advance warning. President Trump has said just about as much. In other words, by the time you wake up in the morning, half of Asia and possibly the West Coast might be dealing with radioactive fallout.

I wonder what that would do to the stock market futures. BTFD???

If you would like to find out exactly what happens next based on our Timing and Mathematical work, please Click Here. 


Daily Stock Market Update & Forecast – August 17th, 2017 – Elliott Wave Edition

ELLIOTT WAVE UPDATE:

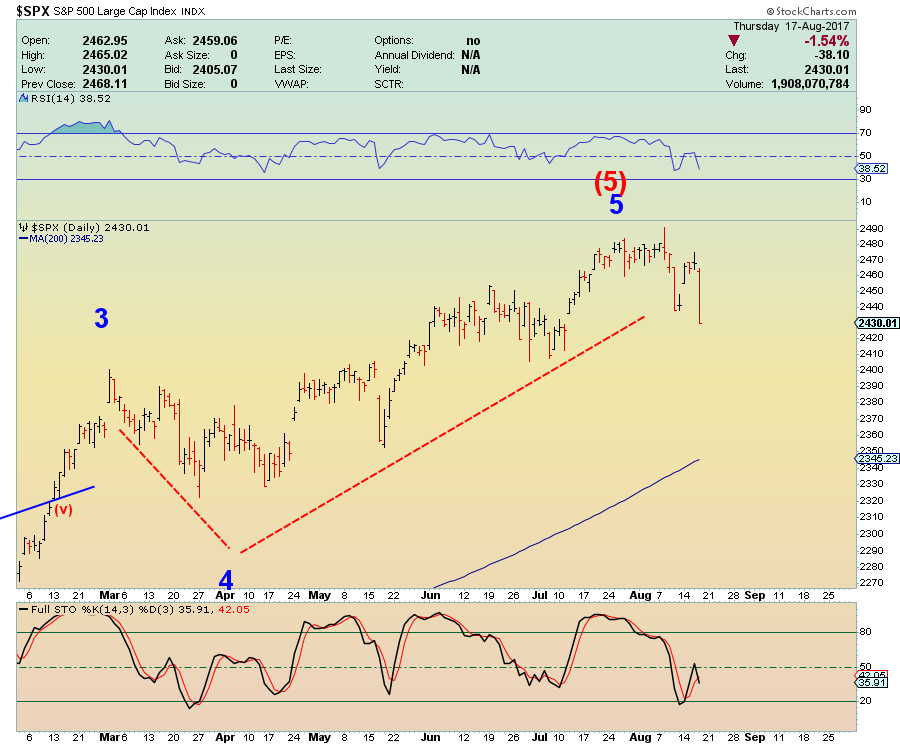
Since many people have asked, I will attempt to give you my interpretation of Elliott Wave and how it is playing out in the market. First, I must admit. I don’t claim to be an EW expert, but I hope my “standard” interpretation is of help.

Let’s take a look at the most likely recent count on the S&P.

Explanation:

Long-Term: It appears the S&P is quickly approaching the termination point of its (5) wave up off of 2009 bottom. If true,we should see a massive sell-off later this year. Did it already complete? Click Here

Short-Term: It appears the S&P might have completed its intermediary wave 3 and now 4. It appears the market is now pushing higher to complete wave 5 of (5). If true, the above count should terminate the bull market. Did it already complete? Click Here

If you would like to find out exactly what happens next based on our Timing and Mathematical work, please Click Here. 


ATTENTION!!! Please note, we have moved most of our free editorial content to our new website MarketSpartans.com Please Click Here to view it.


Daily Stock Market Update & Forecast – July 25th, 2017 – Elliott Wave Edition

ELLIOTT WAVE UPDATE:

Since many people have asked, I will attempt to give you my interpretation of Elliott Wave and how it is playing out in the market. First, I must admit. I don’t claim to be an EW expert, but I hope my “standard” interpretation is of help.

Let’s take a look at the most likely recent count on the S&P.

Explanation:

Long-Term: It appears the S&P is quickly approaching the termination point of its (5) wave up off of 2009 bottom. If true,we should see a massive sell-off later this year.

Short-Term: It appears the S&P might have completed its intermediary wave 3 and now 4. It appears the market is now pushing higher to complete wave 5 of (5). If true, the above count should terminate the bull market.If you would like to find out exactly what happens next based on our Timing and Mathematical work, please Click Here. 


ATTENTION!!! Please note, we have moved most of our free editorial content to our new website MarketSpartans.com Please Click Here to view it.


Trump Voter: Is President Trump A Complete Idiot Or Just Pretending To Be?

Before I offend you, directly or indirectly, in today’s charged political climate I have to admit to something worse. I am even a bigger idiot. After being one of the first to suggest he would win (InvestWithAlex Predicts: Donald Trump Will Be The Next President – May 2016) and voting for the guy in November and I feel utterly betrayed by him on multiple levels.  At same time, anything but Hillary – right?

From completely reversing on the Fed and Janet Yellen, to bending over to Saudi Arabia. From bombing ISIS fighting troops in Syria to threatening a nuclear war with North Korea.

Russia’s witch hunt aside, much of Mr. Trump’s Presidency is a riddle wrapped in a mystery inside an enigma.

Now, before I bash the guy, I have to admit, he has already done quite a bit of good for the country. For instance, just a few days ago Trump ended covert CIA program to arm Syrian “Freedom Fighters (aka ISIS). His anti globalization and pro American movement is picking up speed and that is great for the country.

At the same time, Mr. Trump is a complete idiot. He doesn’t know it yet, but he has already destroyed his Presidency. And no, it has nothing to do with Russia.

Here is why…….

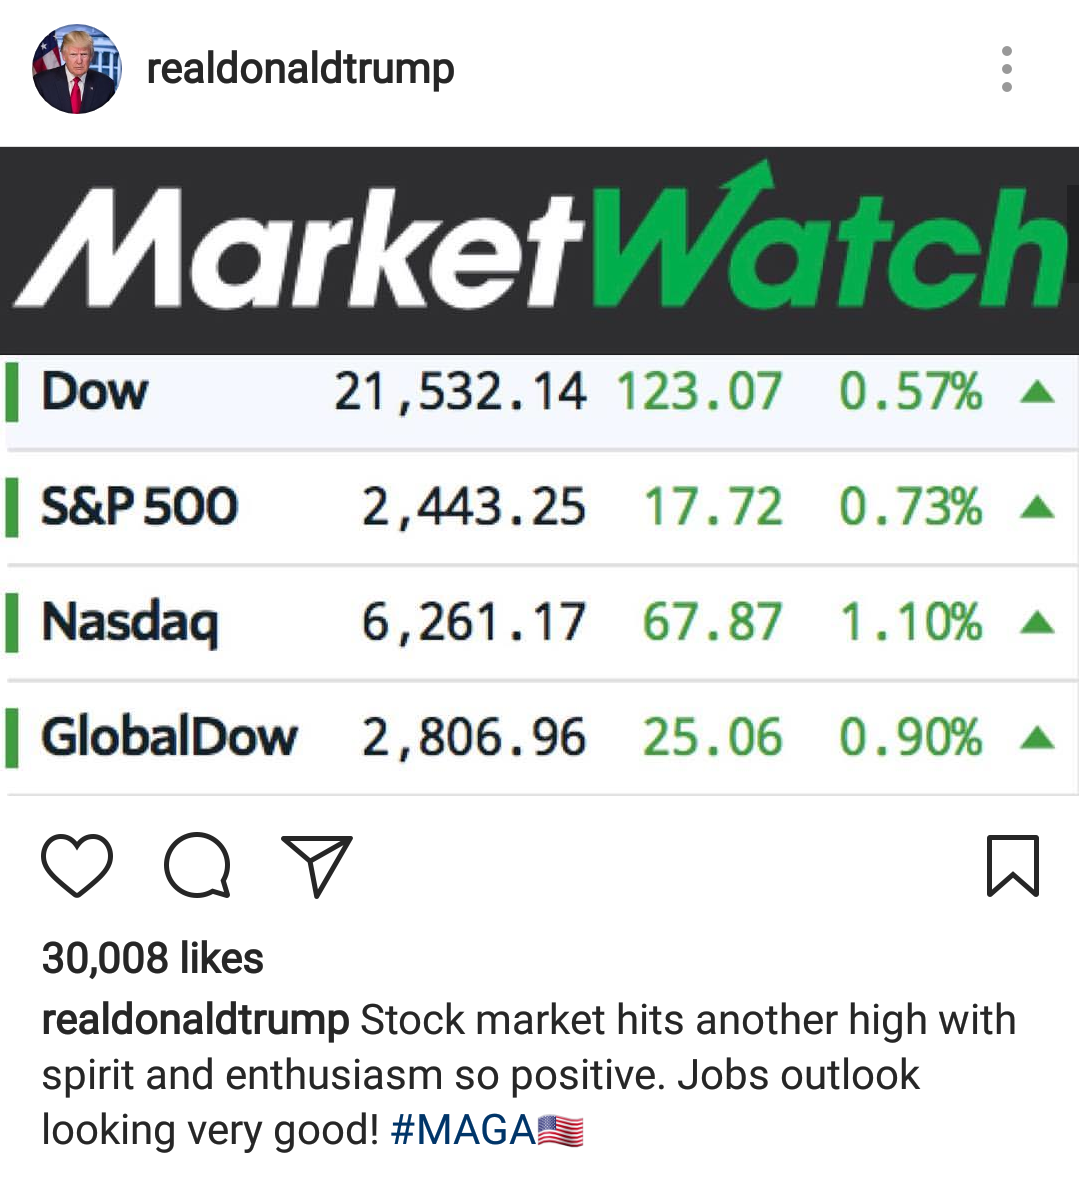
I have said this before and I will say this again. Forget Russia and everything else, this is the worst possible thing that Trump could have done.  It is even laughable. If we apply the same logic to Mr. Trump’s analysis, the rally off of 2016 pre-election bottom of 18% is minuscule.  Obama’s rally off of 2009 low took the S&P 215% higher into the end of his Presidency. By that measure alone Obama’s has made America so great that Trump simply cannot compete.

Perhaps David Stockman has said it the best in his recent article….

The Imperial City’s Fiscal Waterloo

The non-compliance with Wall Street demands for protecting the credit of the U.S. at all costs and the sight of political disarray in Washington will come as a shock. It will cause panic on Wall Street and an even greater headache for the Donald.

That’s because Trump has trumpeted the 18% rise of the stock market averages since Nov. 8 as an endorsement of his Presidency. Instead, he should’ve punctured the bubble on Day One by demanding Yellen’s resignation and blaming the crash on the Fed and its enablers.

Having taken the easy strategy of embracing the stock market bubble, Trump will soon face a double whammy of unfair blame. He soon will be blamed for the debt ceiling crisis that he inherited; and nailed for causing the third major stock market crash of this century. Even though it was fostered by a rogue central bank that he has not addressed, let alone subdued.

The analysis above is dead on. Pre-election Mr. Trump spoke about the stock market bubble, artificially low interest rates and easy credit (too easy) FED Policies. Suggesting he would deflate the bubble.

Instead, he has embraced it.

With Shiller’s S&P P/E Ratio above 30, arguably the highest valuation level in the history of the stock market (if we adjust for 2000 tech distortions), no one should be crazy or stupid enough to take the ownership of it.

Yet, that is precisely what Mr. Trump has done.

Over the last six months or so I have argued that Trump agenda is more or less dead on arrival. We saw that with Obamacare repeal/replace and we will see it with proposed tax cuts, debt ceiling increase and soon to be out of cash treasury.

In other words, congratulations Mr. Trump…..

You have bought yourself and/or have claimed ownership of arguably one of the biggest financial bubbles of all time.  When it finally blows, as it always does, it will take your Presidency down with it. Not Russia, not North Korea and not Mueller.  The Dow will utterly gut you, the S&P will kick you in the face and the Nasdaq will finish you off. All while Ponzi finance proponents Yellen and Obama laugh at you from the sidelines.

And that Sir makes you a complete and utter idiot.  

Make no mistake, an absolute bloodbath in equity markets is steaming our way. The only remaining question is…… when? If you would like to find out exactly when this sell-off will start, based on our mathematical and timing work, please Click Here. 

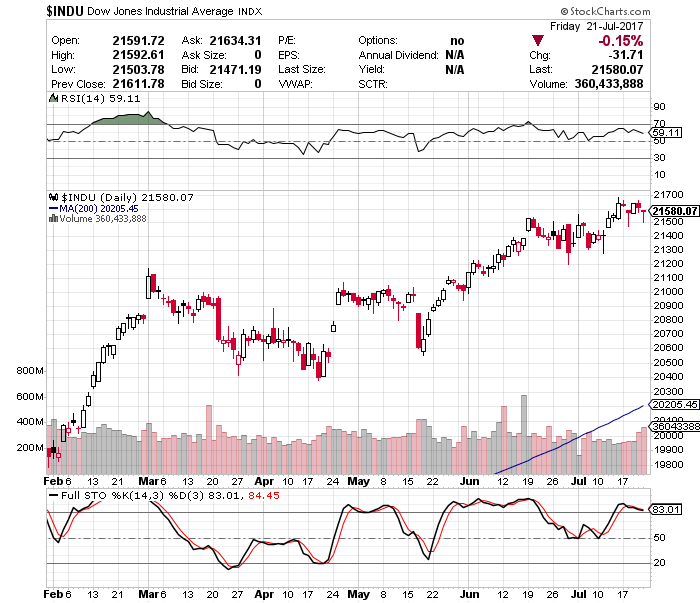
Weekly Stock Market Update & Forecast – July 21st, 2017

– State of the Market Address:

  • The Dow remains well above 21,000.
  • Shiller’s Adjusted S&P P/E ratio is now at 30.26  Arguably the highest level in history (if we adjust for 2000 distortions) and now above 1929 top of 29.55.
  • Weekly RSI at 73.01  – overbought. Daily RSI is at 59.11 – neutral.
  • Prior years corrections terminated at around 200 day moving average. Located at around 17,750 today (on weekly).
  • Weekly Stochastics at 92.10 – overbought. Daily at 83.01 -overbought.
  • NYSE McClellan Oscillator is at +30. Neutral.
  • Volatility measures VIX/VXX are once again sitting at or near their historic lows. Commercial VIX long interest remains the same. Now at 70K contracts net long. 
  • Last week’s CTO Reports suggest that commercials (smart money) are shifting their positioning to net short. Short interest has decreased slightly during the week. For now, the Dow is 5X, the S&P is at 3X, Russell 2000 is at 2X and the Nasdaq is at 2X short. That is a substantial short position against the market.

In summary: For the time being and long-term, the market remains in a clear bull trend. Yet, a number of longer-term indicators suggest the market might experience a substantial correction ahead.  Plus, the “smart money” is positioning for some sort of a sell-off.

If you would like to find out exactly what happens next based on our Timing and Mathematical work, please Click Here. 

ATTENTION!!! Please note, we have moved most of our free editorial content to our new website MarketSpartans.com Please Click Here to view it.


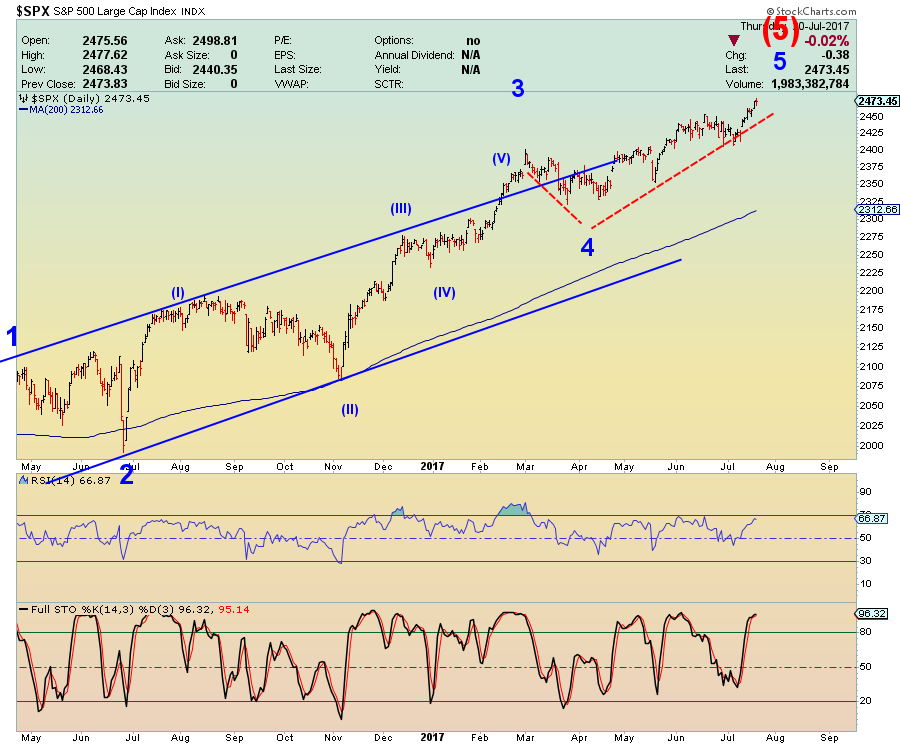
ELLIOTT WAVE UPDATE:

Since many people have asked, I will attempt to give you my interpretation of Elliott Wave and how it is playing out in the market. First, I must admit. I don’t claim to be an EW expert, but I hope my “standard” interpretation is of help.

Let’s take a look at the most likely recent count on the S&P.

Explanation:

Long-Term: It appears the S&P is quickly approaching the termination point of its (5) wave up off of 2009 bottom. If true,we should see a massive sell-off later this year.

Short-Term: It appears the S&P might have completed its intermediary wave 3 and now 4. It appears the market is now pushing higher to complete wave 5 of (5). If true, the above count should terminate the bull market.If you would like to find out exactly what happens next based on our Timing and Mathematical work, please Click Here. 

ATTENTION!!! Please note, we have moved most of our free editorial content to our new website MarketSpartans.com Please Click Here to view it.


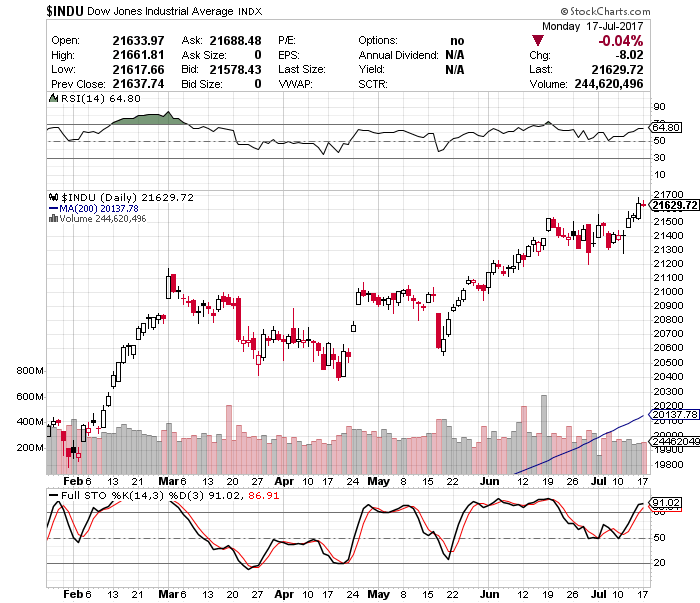
Daily Stock Market Update & Forecast – July 17th, 2017

State of the Market Address:

  • The Dow remains well above 21,000.
  • Shiller’s Adjusted S&P P/E ratio is now at 30.10  Arguably the highest level in history (if we adjust for 2000 distortions) and now above 1929 top of 29.55.
  • Weekly RSI at 75.35  – overbought. Daily RSI is at 64.80 – neutral.
  • Prior years corrections terminated at around 200 day moving average. Located at around 17,750 today (on weekly).
  • Weekly Stochastics at 90 – overbought. Daily at 91-overbought.
  • NYSE McClellan Oscillator is at +30. Neutral.
  • Volatility measures VIX/VXX are once again sitting at or near their historic lows. Commercial VIX long interest remains the same. Now at 70K contracts net long. 
  • Last week’s CTO Reports suggest that commercials (smart money) are shifting their positioning to net short. Short interest has decreased slightly during the week. For now, the Dow is 6X, the S&P is at 3X, Russell 2000 is at 2X and the Nasdaq is at 2X short. That is a substantial short position against the market.

In summary: For the time being and long-term, the market remains in a clear bull trend. Yet, a number of longer-term indicators suggest the market might experience a substantial correction ahead.  Plus, the “smart money” is positioning for some sort of a sell-off.

If you would like to find out exactly what happens next based on our Timing and Mathematical work, please Click Here. 


ATTENTION!!! Please note, we have moved most of our free editorial content to our new website MarketSpartans.com Please Click Here to view it.