InvestWithAlex.com 

Our MasterCard (MA) Time/Price Analysis Was Just Posted

Our timing and mathematical decomposition of MA suggests the following:

  • MasterCard is going to put in a major cycle top in around XXXX. After that, MasterCard is going to decline to its major cycle bottom anticipated to arrive within the next-coming 2-3 months (+/- cycle variance). In other words, MasterCard is going to develop a top to bottom fast move.
  • In the meantime, our software has identified two X-cycles: a mid-term X-cycle arriving in XXXX and a long-term X-cycle arriving in XXXX.
  • For the anticipated top, we have a preliminary level at XXXX.

If you would like to find out what MA will do going forward, in both price and time, as well as its associated trading parameters, please Click Here

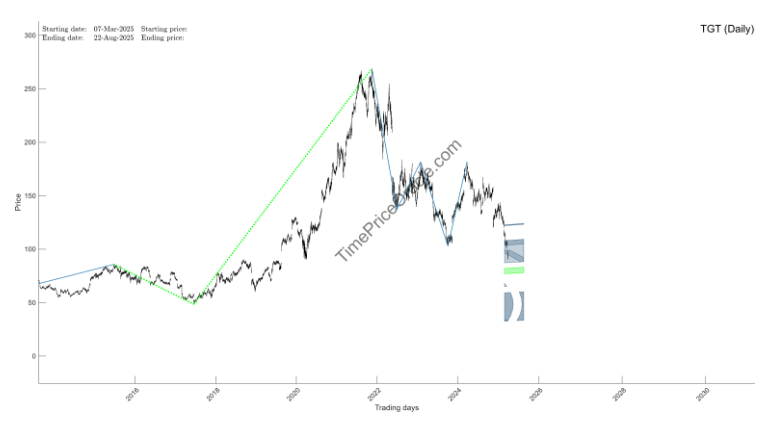
Our Next Fast Mover Is Ready To Slide

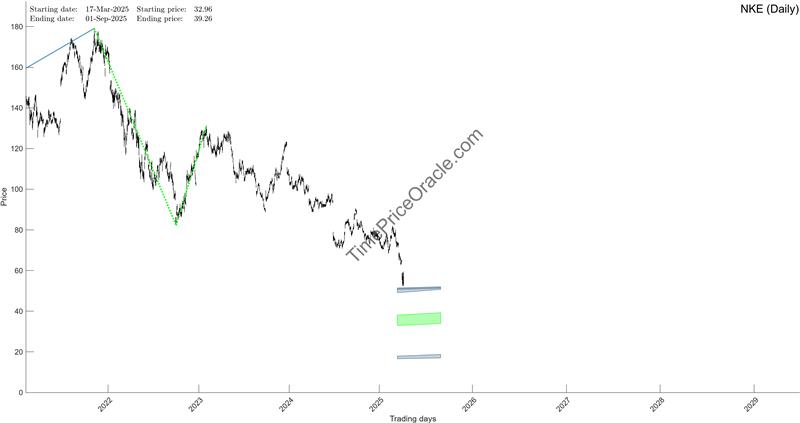
Fast movers are stocks that are about to stage powerful directional moves of 50%+ within a relatively compressed time window of 12 months or less.  Our software has identified the stock above as a fast mover.  And as the chart above suggests, the stock will soon hit the green region on the chart above, reverse and collapse. 

  • Time Target: A major cycle top is expected to arrive in………………….
    Price Target: Our price target is located at………………….. 
    Projected Move: A down move of approximately………………………..

If you would like to find out exactly what this stock is and what it will do going forward, in both price and time, as well as to see its associated time/price targets, please Click Here

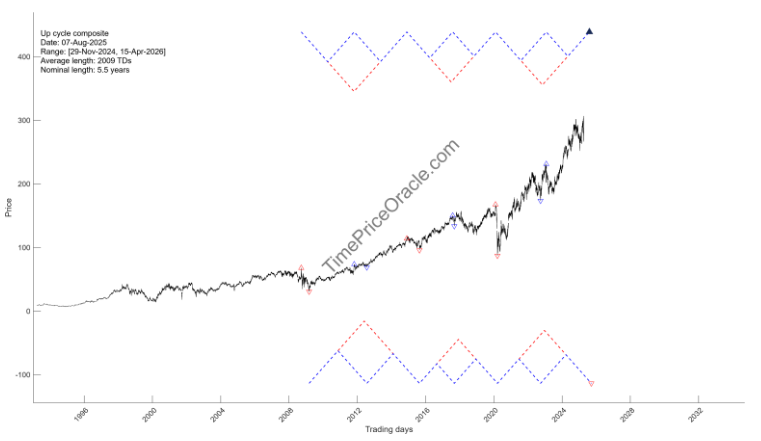
We Just Updated Our Amazon (AMZN) Forecast

Our updated mathematical and timing calculations for AMZN suggest the following:

  • Amazon is moving towards its 4-year down cycle composite mid-point expected to arrive on XXXX
  • Our software indicates that a cycle shift occurred moving the major up cycle completion point to XXXX
  • For the upcoming bottom, our software suggest XXXX. If Amazon breaks below that level, the next completion point is at  XXXX.
  • For the next-coming top, we have a wide, but a clear range of XXXX.

If you would like to find out what Amazon (AMZN) will do next, in both price and time, as well as see its associated time/price targets, please Click Here

Costco (COST) Is About To Costco

Our mathematical analysis of Costco suggests the following:

  • A mid-cycle top to mid-cycle bottom fast move is going to be developed from XXXX.
  • The extent of the anticipated move is going to be approximately from XXXX

In summary, COST is going to develop a mid-cycle top to bottom fast move approximately from XXXX. The drop in price is expected to be approximately from XXXX.

If you would like to find out what Costco (COST) will do next, in both price and time, as well as its associated time/price turning points, please Click Here 

Is Gold (GC) About To Top Out ???

We have been saying for quite some time that Gold will likely top out in early 2025 at around $3,000. Now that we are here, we have updated our Gold time/price forecast…….

  • We have approached the time target for the mid-cycle top and, as of today, GC hit our initial target range XXXX. Depending on when GC is going to put in the actual top, our updated targeting provides a slightly broader range for the top price: XXXX, which represents the area of intersection of long-term (developing since 1980) and mid-term (developing since 2010) geometries.
  • Once the top is in, GC will start to decline to its mid-cycle bottom scheduled to arrive in April 2026. Our initial targets are at $XXXXlevel. 

If you would like to find out what Gold will do next, in both price and time, as well as its associated exact time/price targets, please Click Here

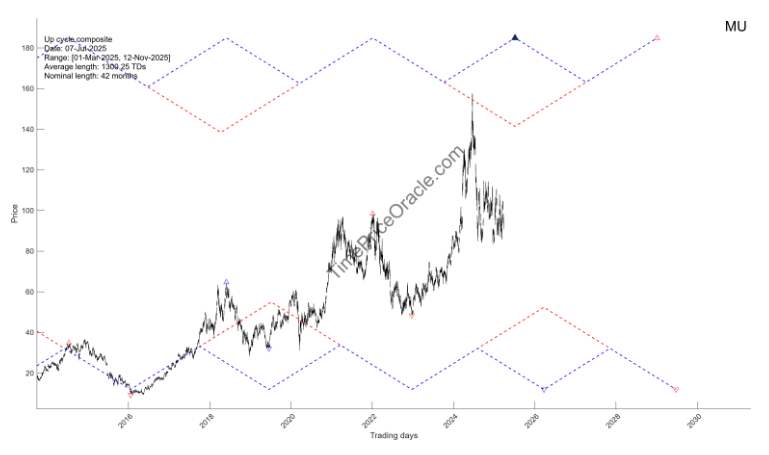
Our Next “Fast Mover” Was Just Posted

Fast movers are stocks that are about to stage powerful directional moves of 50%+ within a relatively compressed time window of 12 months or less.  Our software has identified the stock above as a fast mover.  And as the chart above suggests, the stock will soon hit the green region on the chart above, reverse and collapse. 

  • Time Target: A major cycle top is expected to arrive in………………….
    Price Target: Our price target is located at………………….. 
    Projected Move: A down move of approximately………………………..

If you would like to find out exactly what this stock is and what it will do going forward, in both price and time, as well as to see its associated time/price targets, please Click Here

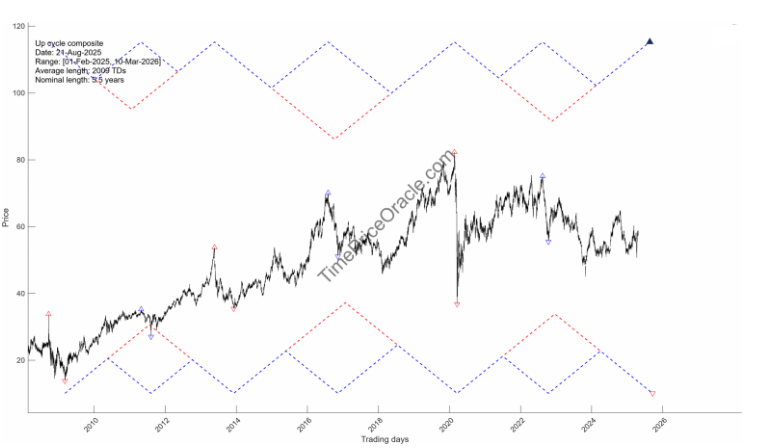
Our Exxon Mobil Corp. (XOM) Forecast Was Just Posted

Our timing and mathematical decomposition of XOM suggests the following:

  • XOM is moving to its major up cycle composite completion points arriving in XXXX.
  • After reaching the top, XOM will start to decrease to its major down cycle composite completion point anticipated in XXXX.
  • Our target is located at XXXX. 
  • The extent of the down move is expected to be around 20-25%.

If you would like to find out what XOM will do next, in both price and time, as well as its associated time/price targets, please Click Here
Our Next Fast Mover Is Ready To BlackRock (BLK)

Fast movers are stocks that are about to stage powerful directional moves of 50%+ within a relatively compressed time window of 12 months or less.  Our software has identified BlackRock as our next fast mover. As the chart above suggests, BlackRock (BLK) is about to top and then proceed to collapse within a relatively short period of time.

If you would like to find out exactly what BLK will do going forward, in both price and time, and see our associated time/price targets, please Click Here

10 Year Treasury Note Is Yet To TOP?

We just updated our 10 Year Treasury Index forecast. And as we have been saying for quite some time, it is yet to top……

  • Even though we are approaching the end of the cycle variance associated with the XXXX mid-cycle top, TNX hasn’t reached its price target. As indicated in the prior update, TIME extension is possible if our % target is not reached.
  • We still have the same target of XXXX (+/-0.1%) and here’s why. As you will see on the chart (see below), TNX broke above the so-called “mid-layer” built on a very long-term geometric structure (started in 1987), which is a definite indicator that TNX will reach higher targets.
  • We have a very powerful X-cycle arriving in XXXX which can be the completion point for the current rally. Once the actual top is confirmed, we will have a more accurate estimate in terms of the upcoming bottom. Note that an eventual bottom at 2.70% is highly probable.

If you would like to find out exactly when and where TNX will top, in both price and time, please Click Here