 Our daily report for the Dow Jones Intraday analysis has been posted. To see it, please Click Here.
If you would like to find out what the stock market will do next, in both price and time, short-term and/or long-term, please Click Here
Our daily report for the Dow Jones Intraday analysis has been posted. To see it, please Click Here.
If you would like to find out what the stock market will do next, in both price and time, short-term and/or long-term, please Click Here
I am seeing a lot of “this market makes no sense” articles lately. Case and point……
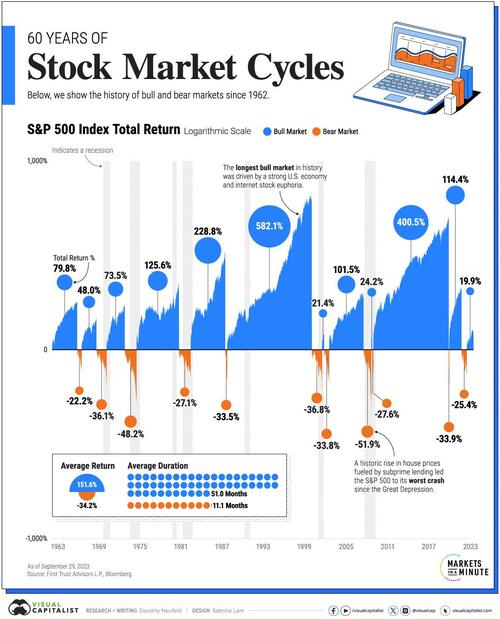
Visualizing 60 Years Of Stock Market Cycles
This Is Off The Charts”: Economist Claims 2024 Will Bring ‘Biggest Crash Of Our Lifetime’ In US
I would have to admit, fundamentally or historically speaking, this market makes no sense. It is an artificial façade type of a market that most money managers, as recently as 10 years ago, couldn’t have imagined.
Having said that, what the market is doing now is exactly what it should be doing. Mathematically speaking, of course. Allow me to explain…..
The market moves between mathematical time/price points of force. Further, it operates at different energy levels or prior environments that most people are not familiar with. For instance, we had two energy shifts in most recent history. In 1994 and 2015. And let me state something that would be controversial here. The most recent bull market started in 2015 (at energy shift) and not in 2009. The 2009 bottom was equivalent to the 1974 type of a bottom.
Now, this most recent energy shift has to do with inflationary monetary expansion as opposed to the fundamental expansion we have experienced between 1982-2000.
Where am I going with this?
I am simply pointing out that the market is doing exactly what it should be doing. Mid last year we have identified October 10th, 2022 (+/- 2 trading days) as an important projected bottom after which the market would go on to hit an all time high. And that is exactly what we have witnessed thus far.
The rest of our forecast was rather clear as well. Once the market reaches new all time highs, it will put in an important top before shifting gears into a severe bear market. The trick is to figure out exactly when that will happen.
Let me just say this……The top is coming and it is coming soon. If you would like to find out exactly when and where this top will arrive, in both price and time, please CLICK HERE
Over the years we have been able to figure out a way of identifying Fast Moving stocks. These are stocks that are about to stage powerful directional moves of 50%+ within a compressed time window of 12 months or less. To learn more about our fast movers and the math behind it, please Click Here
Charts below represent our latest find. If you recognize the charts, great. The stock in question is about to top and then proceed to collapse 50%+ over the next 10 months.
If you would like to obtain the exact time/price target for this upcoming bottom as well as our trading parameters, please Click Here.


If you would like to find out what the stock market will do next in both price and time, long-term and short-term, please Click Here. You can also find our MegaCap Stocks Time/Price Projections and our Fast Movers at the same link.

12/19/2023 – Another positive day with the Dow Jones up 251 points (+0.68%) and the Nasdaq up 98 points (+0.66%)
The stock market continues to perform as anticipated. I found the following article of interest ……
If you will recall, just a few short weeks ago most professional investors were running around screaming that the market was about to crash. And now we have bears going bullish and the land of milk and honey is just around the bend.
We don’t particularly hold either view. If you recall, since identifying October 13th, 2022 bottom with incredible precision we held a singular forecast. That all major indices will see their respective all time highs before the bull market terminates itself.
So, the real question right now should be, where does this bull market terminate? Luckily, we have the answer. If you would like to find out exactly where and when this market will top out, and most importantly, what happens next, please Click Here.
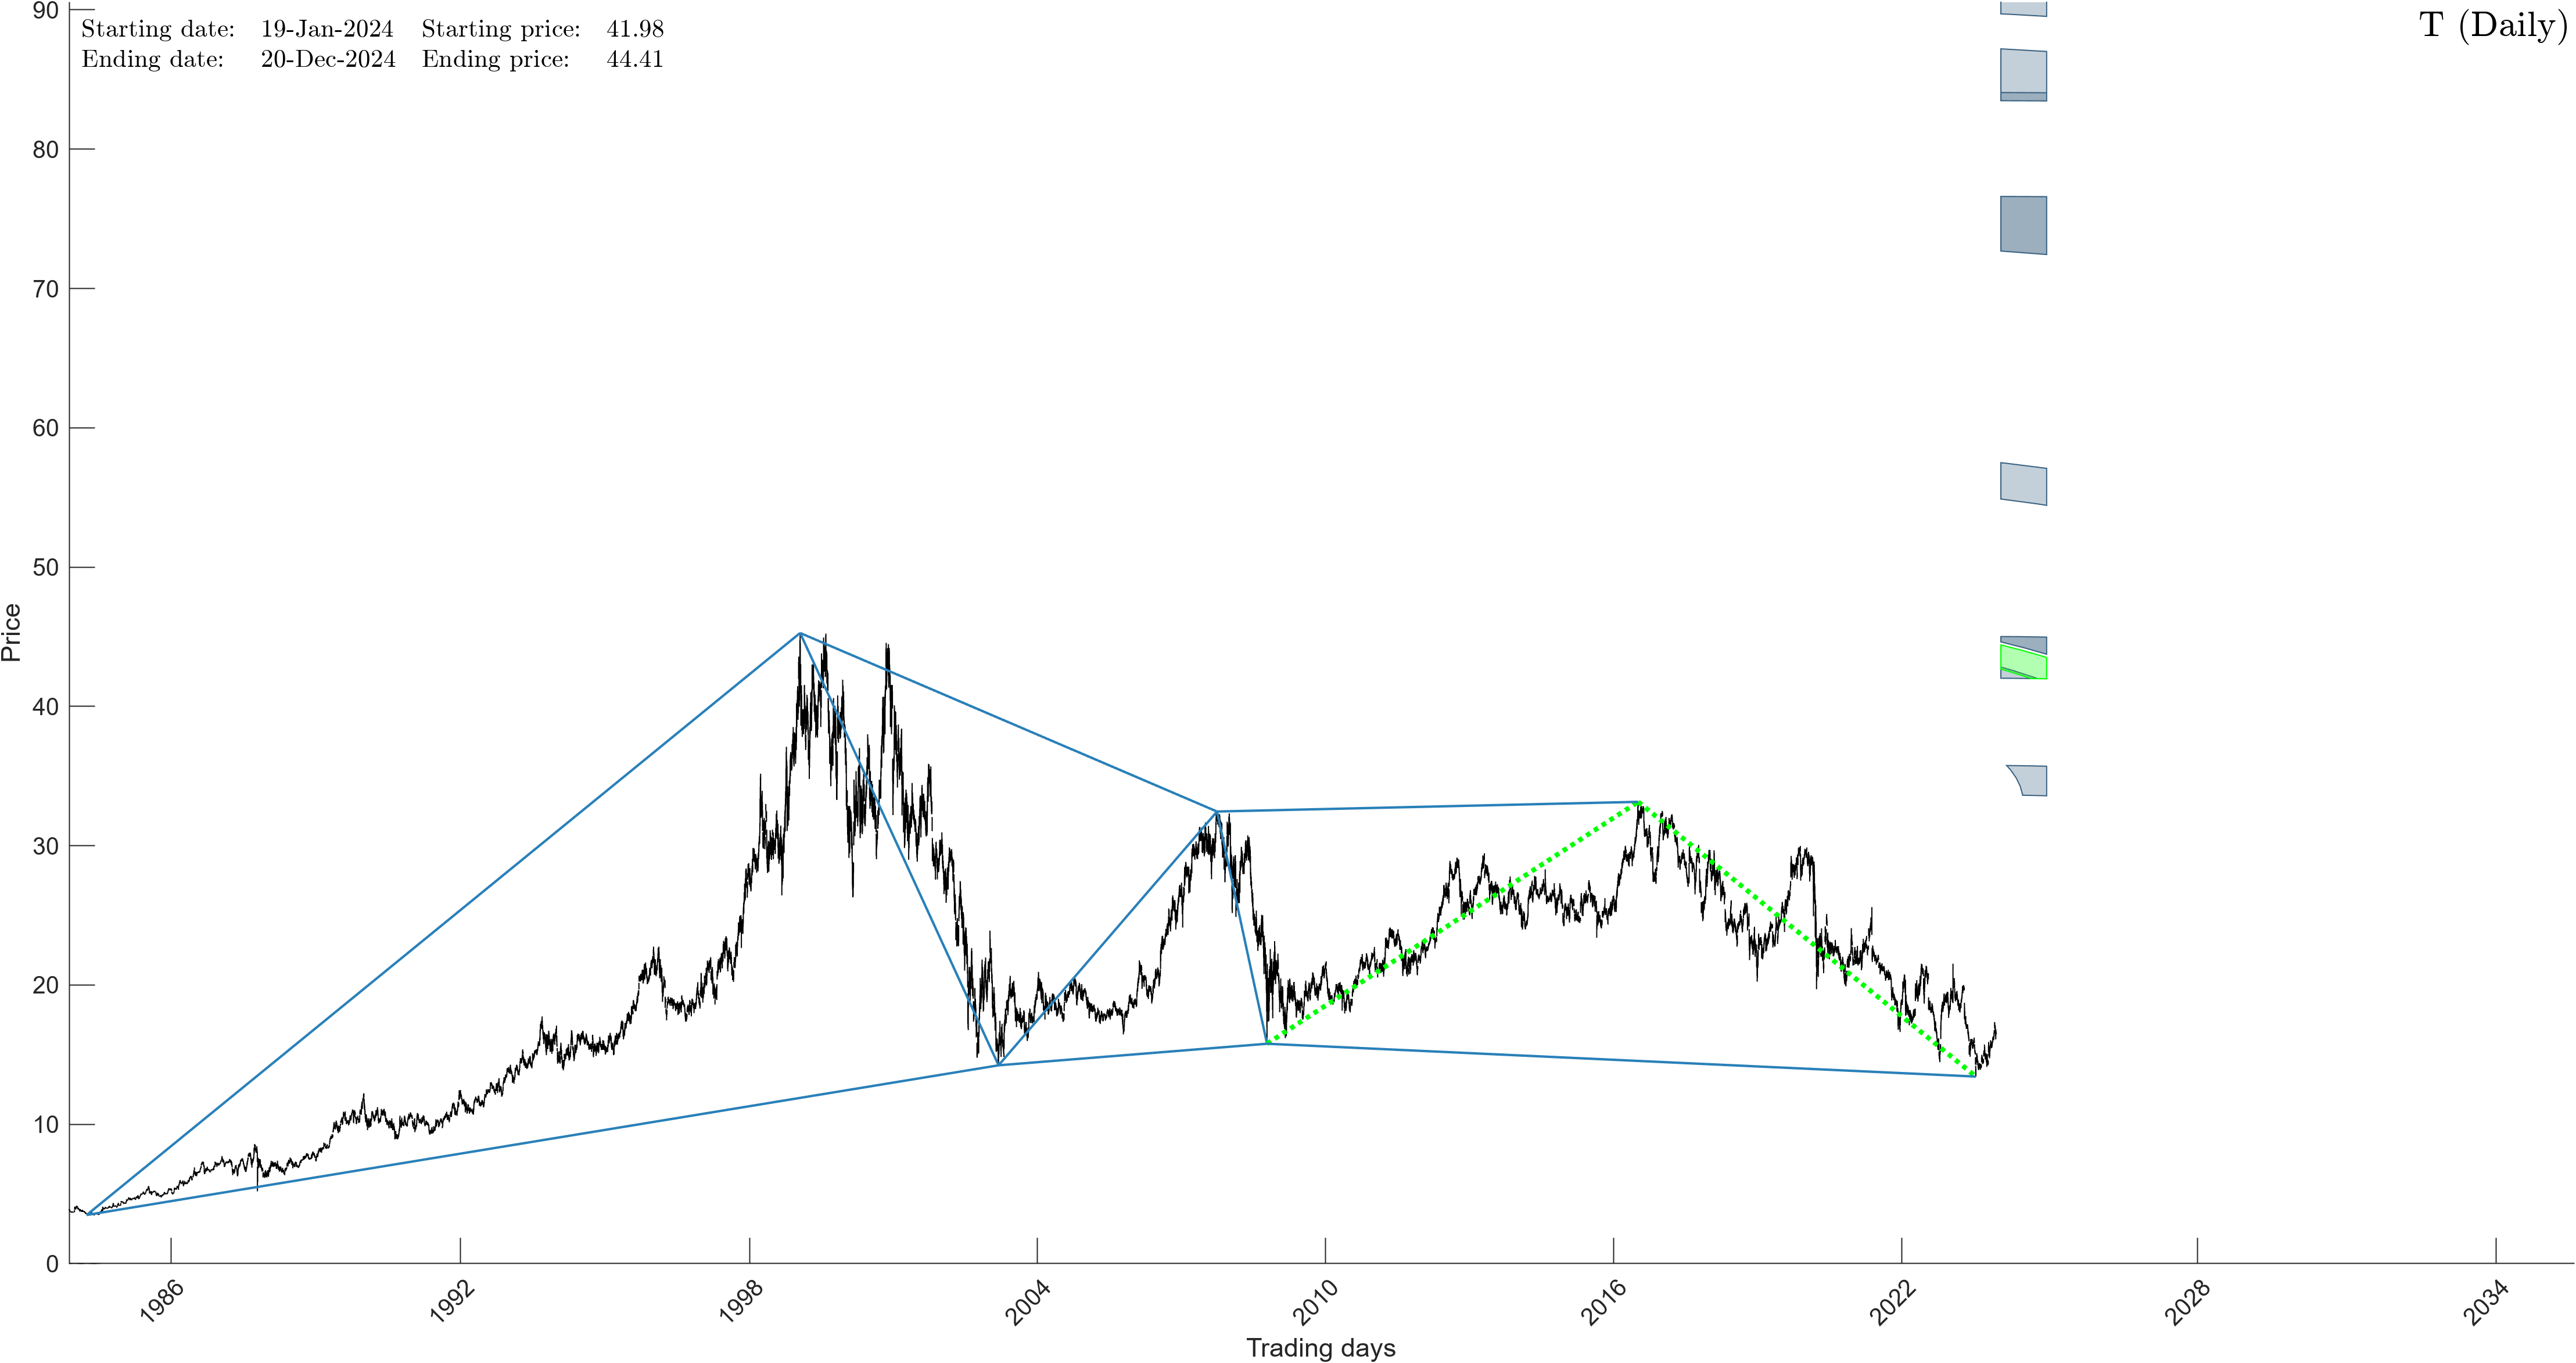 We are posting this entire AT&T (T) analysis in a free forum because we found the stock to be rather uninspiring going forward. Having said that, if you would like to see our other MegaCap stocks and their precise Time/Price projections, please Click Here
AT&T (T)
Date Of Analysis: December 19th, 2023
Our mathematical and timing analysis for AT&T (T) shows the following…..
In summary, AT&T offers very little in terms of a good trading opportunity at this time. Further, we found a number of interference patterns that render this stock a bit “unclear”. And while the stock is scheduled to rally, we would wait for the top to arrive before making any commitments.
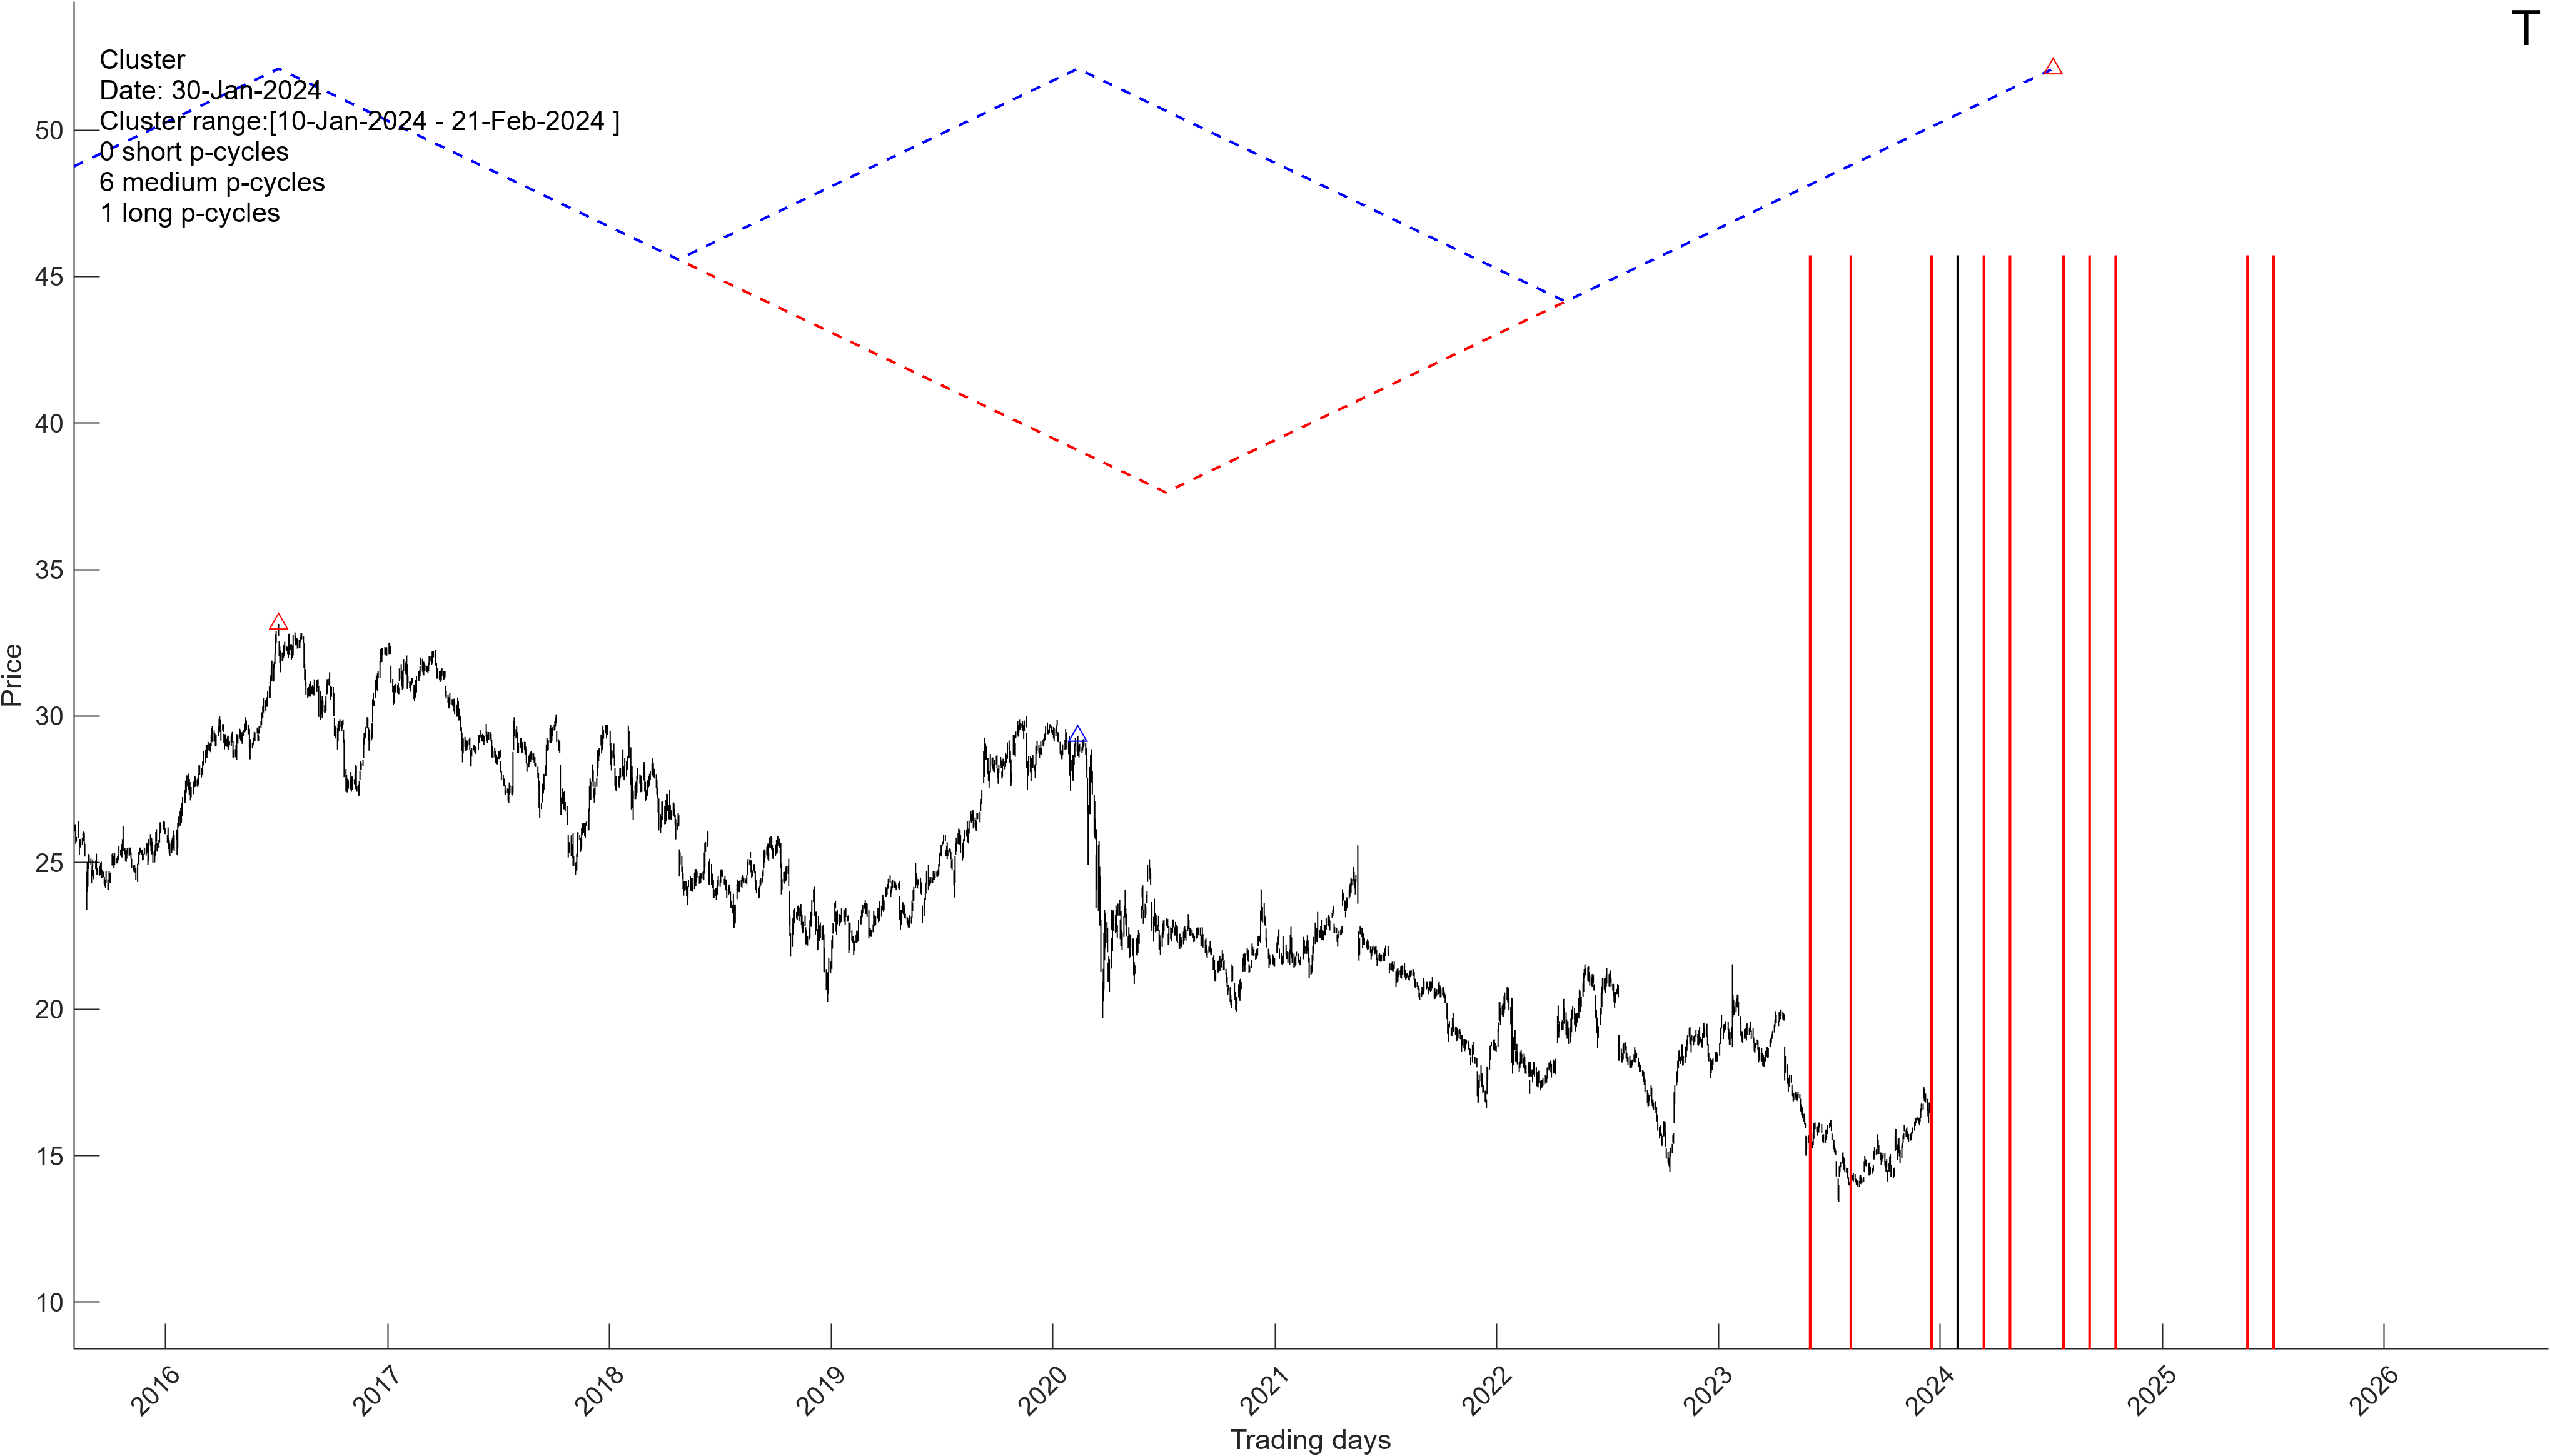
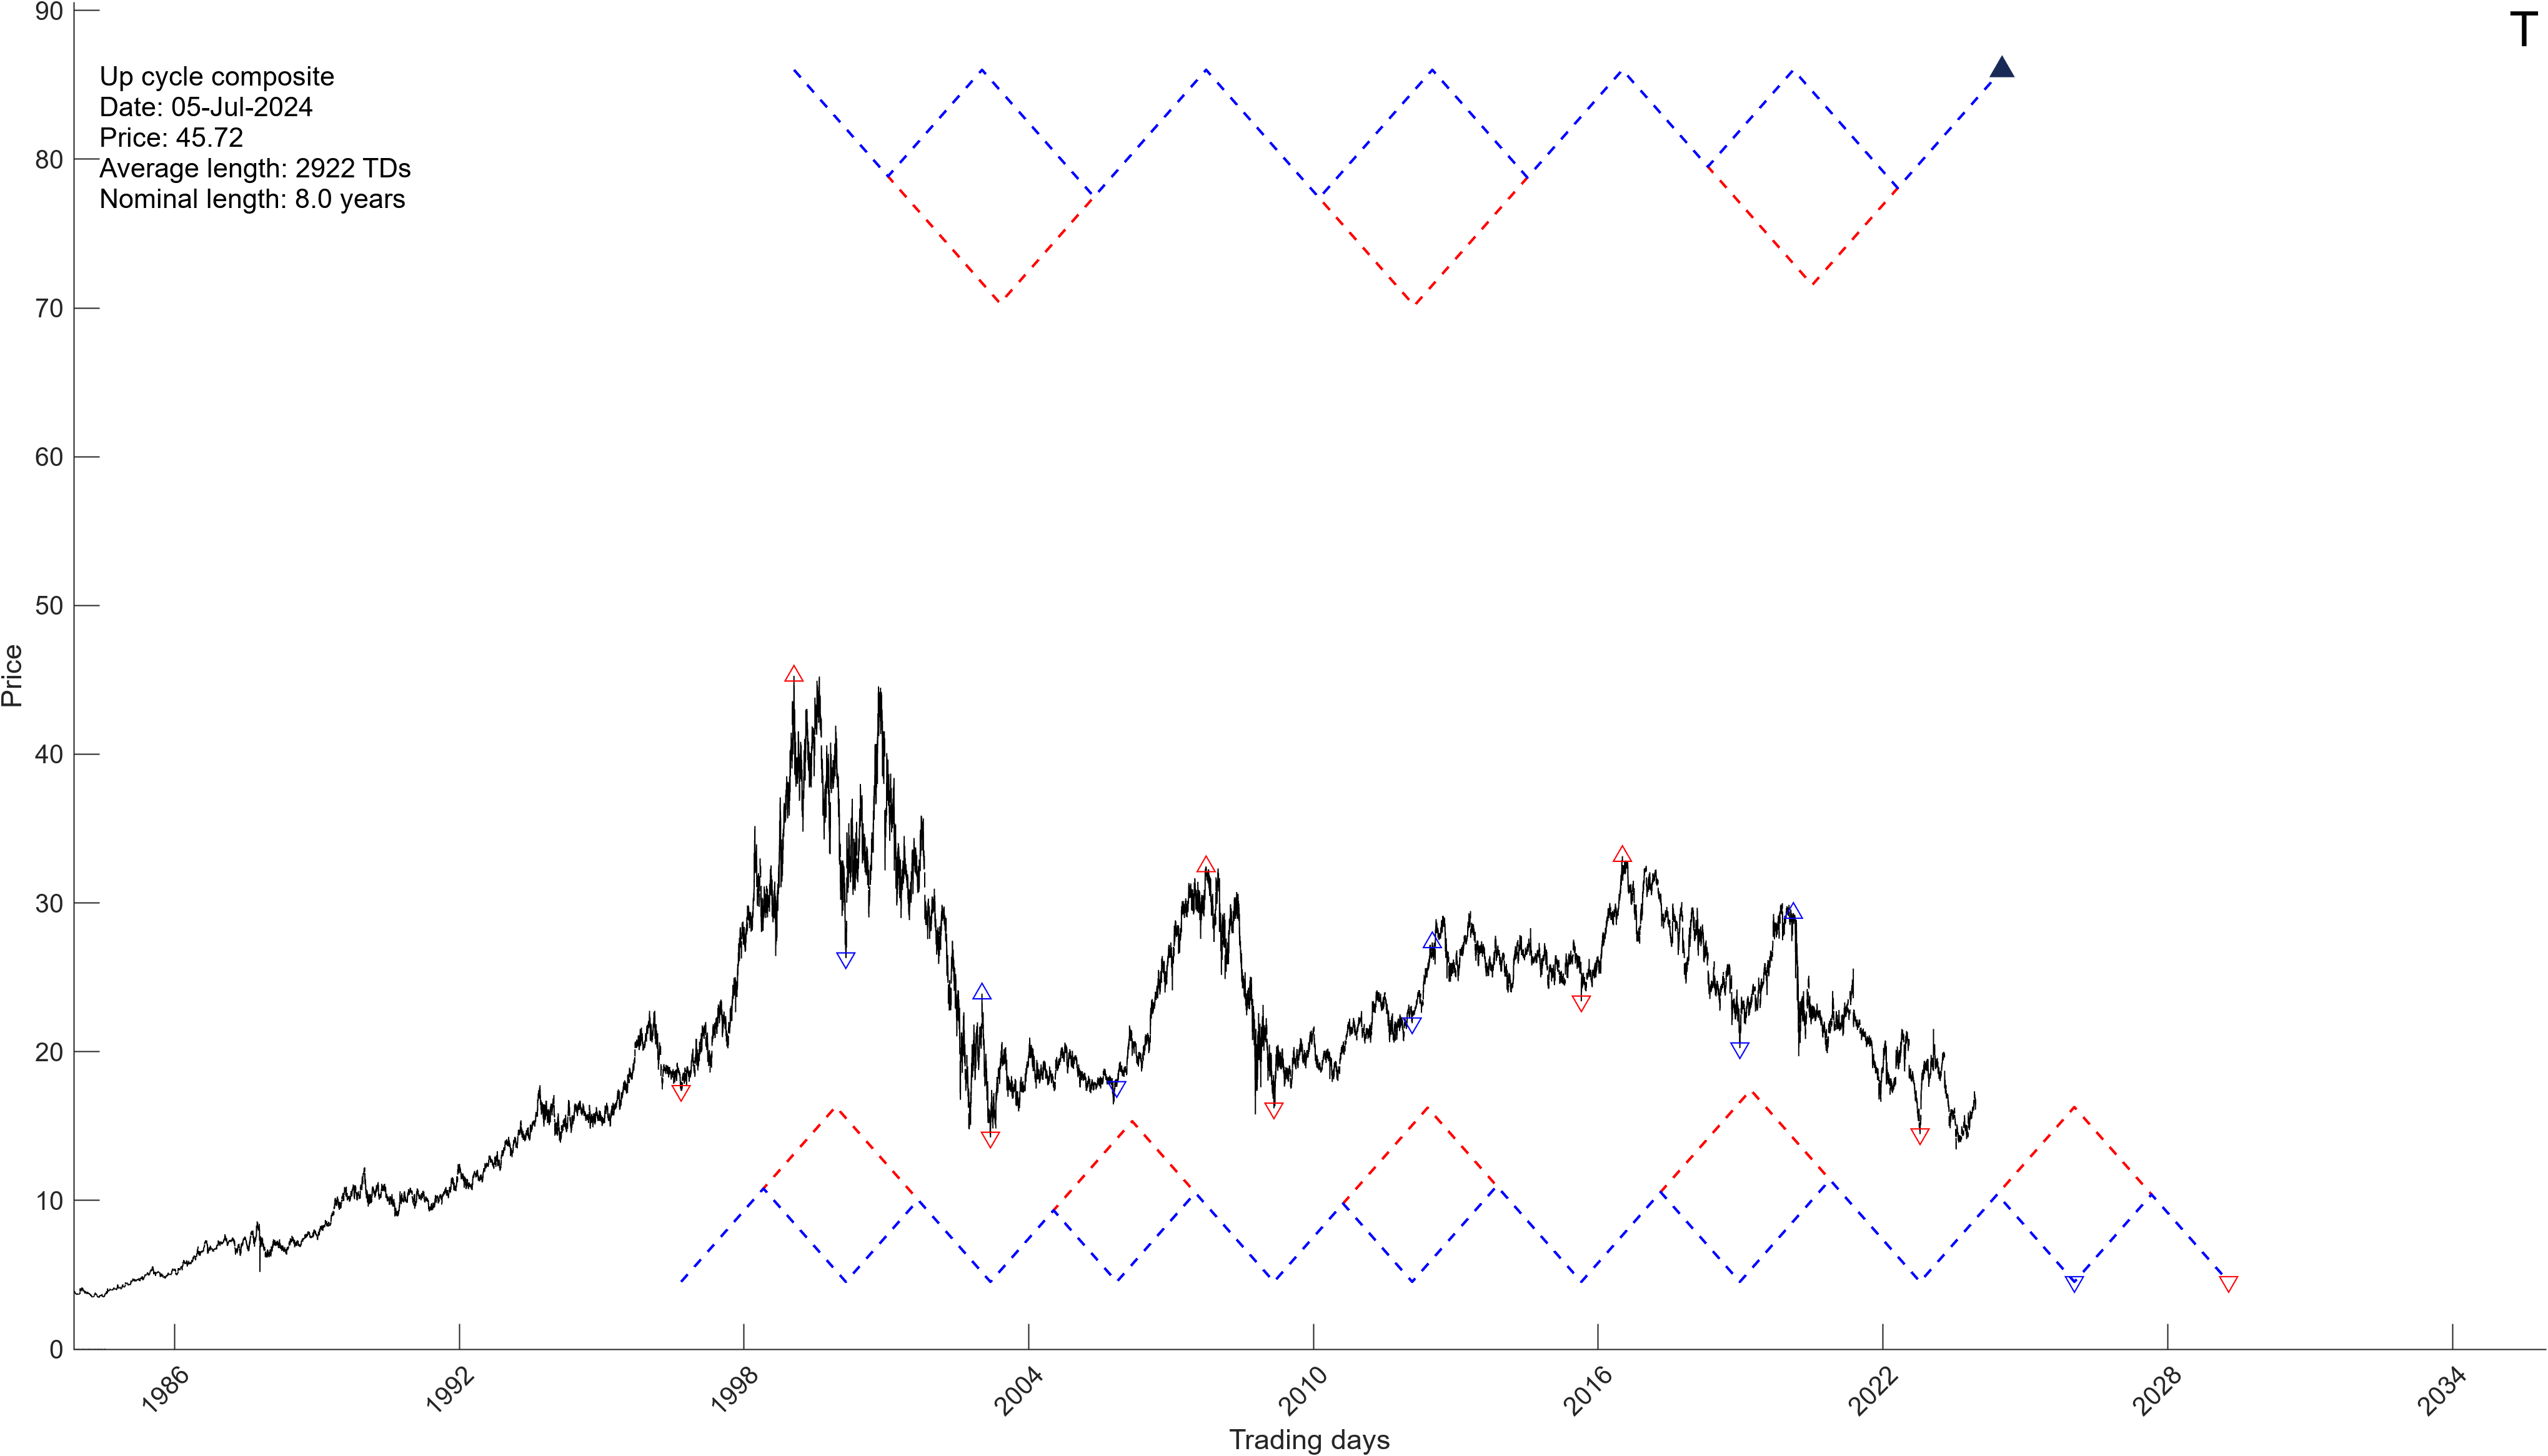
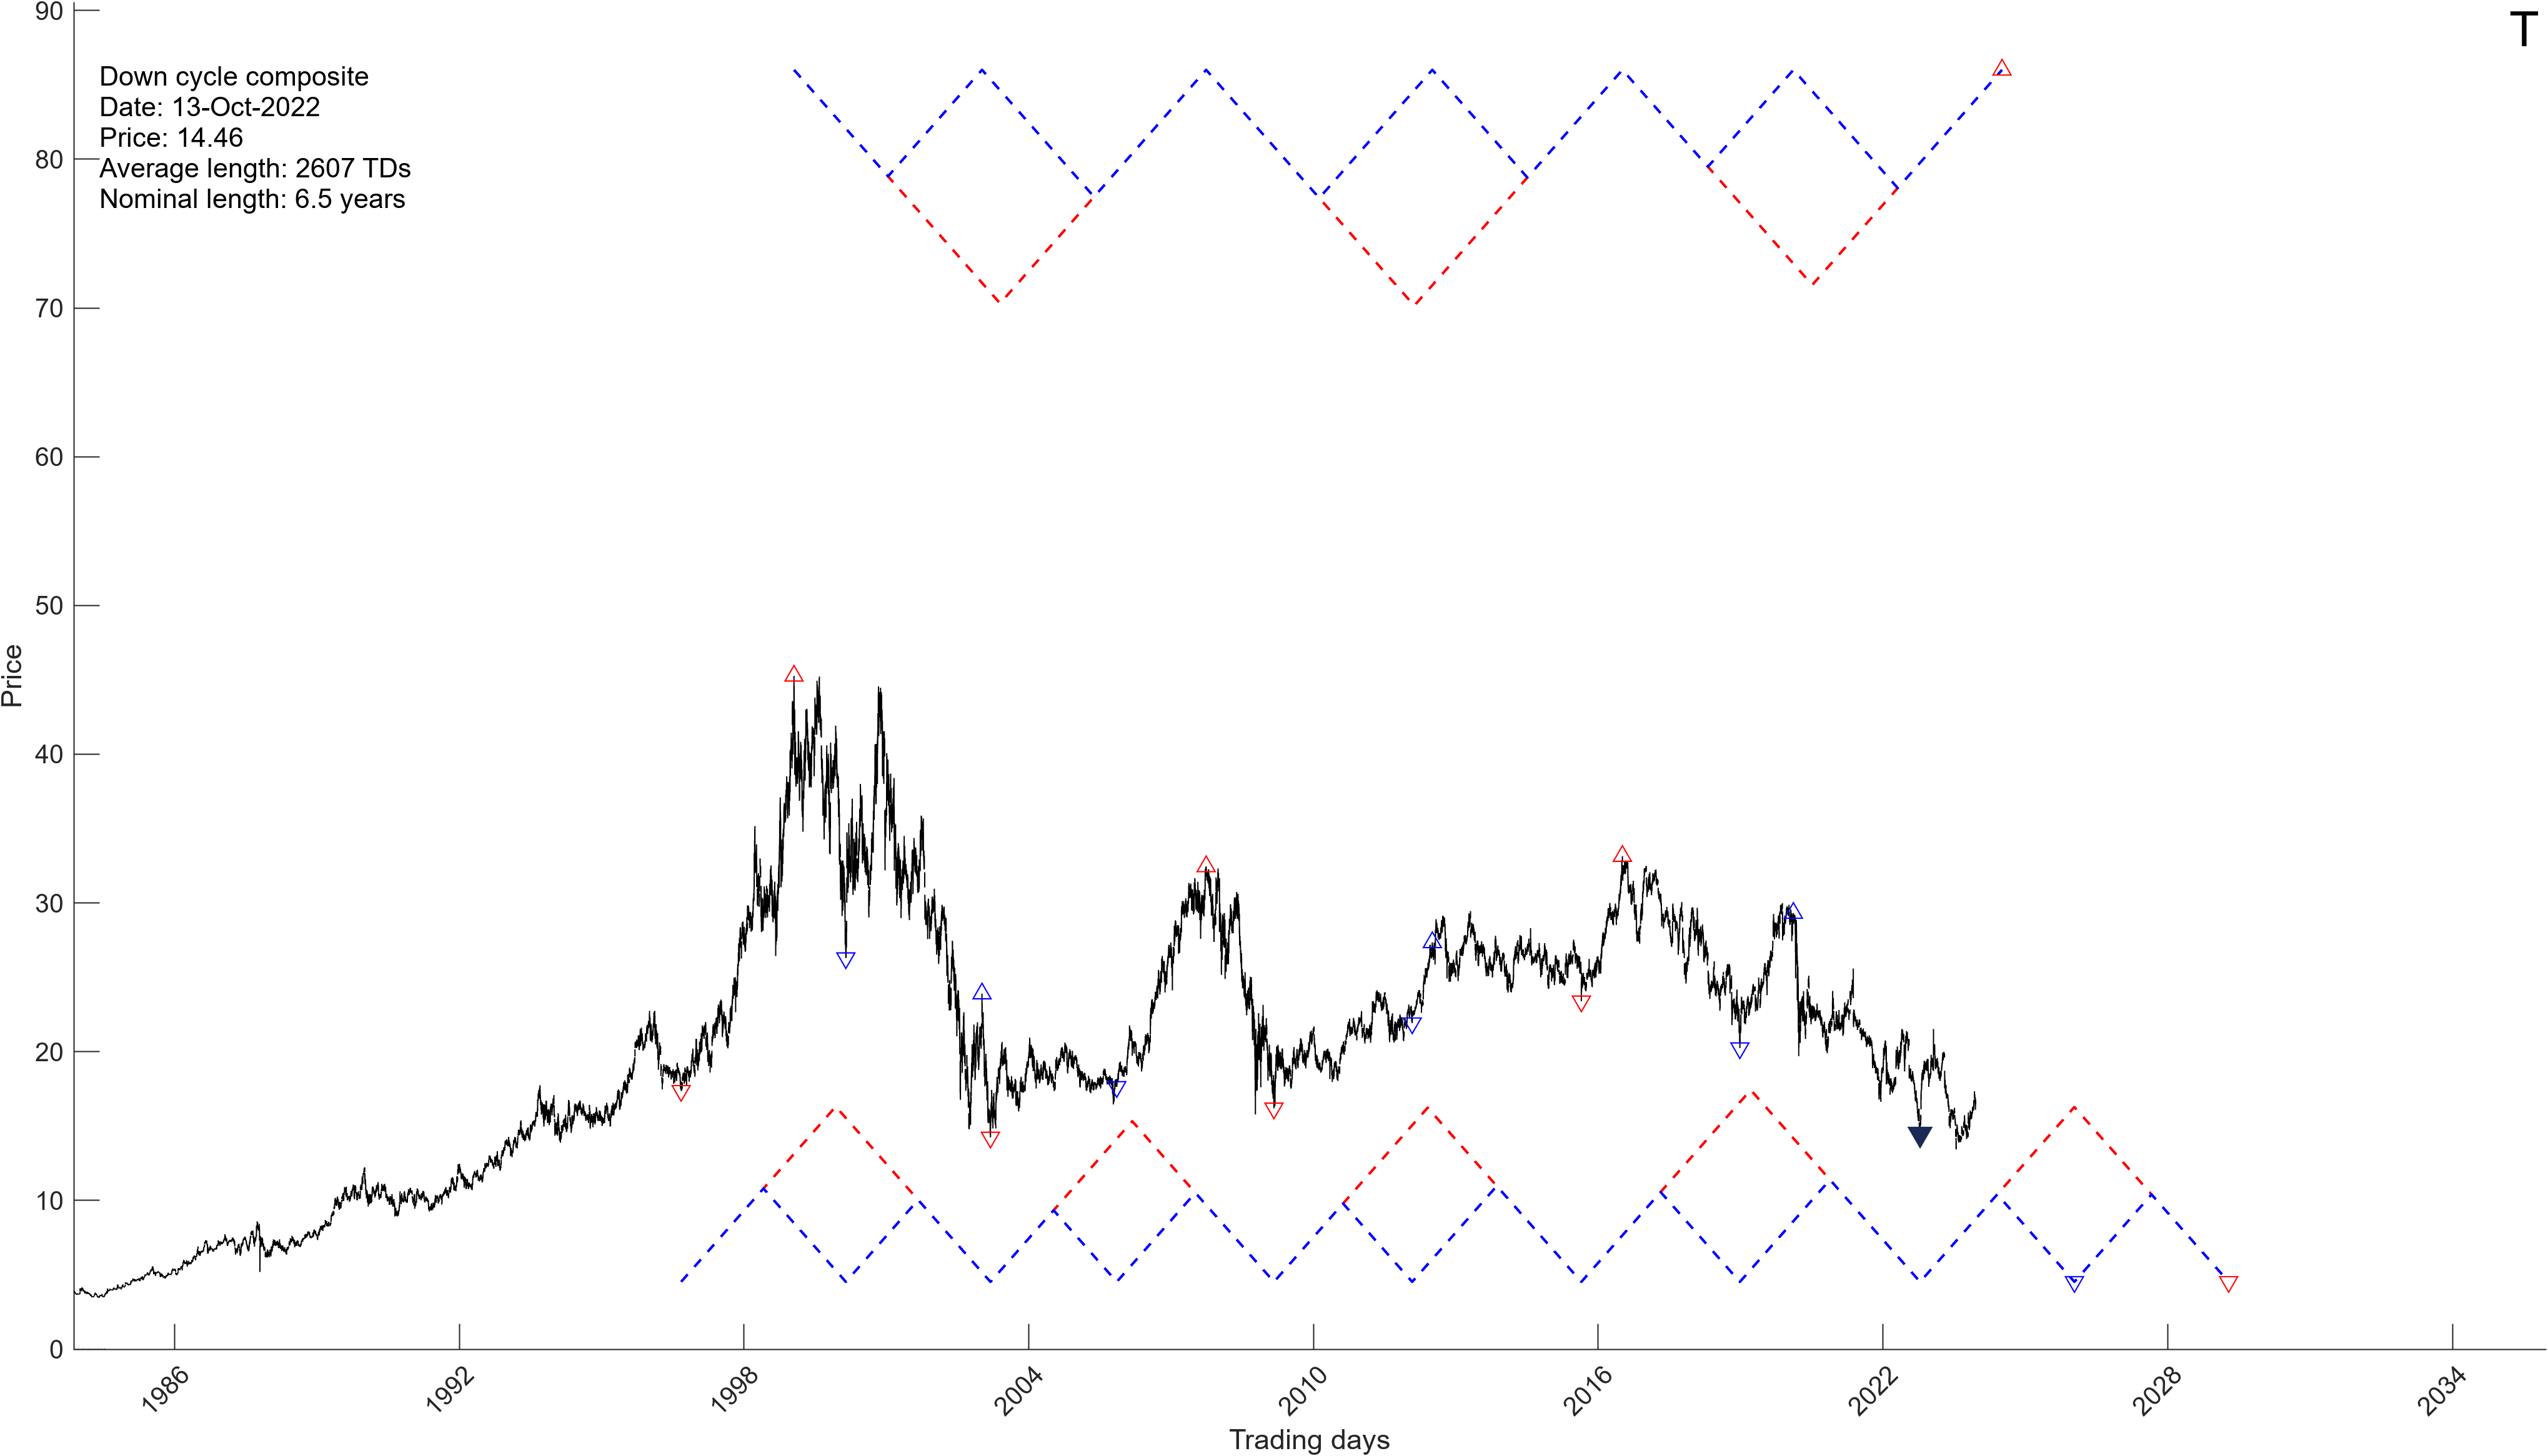
Chart below represents mid-term calculations for the Dow Jones. Red dots represent all possible mathematical points of force associates with this time frame. In other words, red dots represent all possible mid-term turning points over the next 5 trading days. Recall, the stock market must hit one of these points before any sort of a legitimate top can develop.
As a result, the overall setup is fairly easy. Click here to find out what the stock market will do next.

If you would like to find out what the stock market will do next, please Click Here

If you would like to find out what the stock market will do next in both price and time, long-term and short-term, please Click Here. You can also find our MegaCap Stocks Time/Price Projections and our Fast Movers at the same link.
Our mathematical chart below shows an important data point. The market is sitting at a major mathematical point of force (red dot) or a possible turning point. That is not to say the market will turn around at this juncture and begin to decline, but rather, to suggest the market might do so off of this point. To find out for sure, please Click Here

If you would like to find out what the stock market will do next in both price and time, long-term and short-term, please Click Here. You can also find our MegaCap Stocks Time/Price Projections and our Fast Movers at the same link.
