Another great write on the subject matter from Paul Craig Roberts and we couldn’t agree more. And before you celebrate this apparent failure, understand that we are now on a fast track to Armageddon. PCR is dead on accurate in his analysis. Read below.
Putin and Xi and Iran The Unready Updated
Updated December 9, 2024
This website relies on readers’ support
Putin and Xi and Iran The Unready
Paul Craig Roberts
The third front that Washington opened against Russia had immediate success. https://www.paulcraigroberts.org/2024/12/06/us-opens-a-third-front-against-russia/
Putin’s inability to ever finish a task has cost him Syria. Putin stupidly repeated the mistake he made with the Minsk Agreement with the Astana Agreement which permitted Washington to maintain illegal military bases in Syria, steal Syria’s oil, and route it to Israel via Turkey to fuel Israel’s destruction of Palestine.
The result was a massive strategic defeat for Russia, with its nine-year defense of Syria washed away in a few days.
Now only Iran and Saudi Arabia stand between Israel and Israel’s goal of Greater Israel. The Saudis having witnessed Russia and Iran’s inattention and inability to act are motivated to reestablish the petrodollar in exchange for American protection. Iran and Hezbollah having pissed away the strategic initiative will be the next to fall. The neoconservative plan to overthrow seven Muslim countries in five years has taken longer than intended but is on its way to success. Trump’s military and foreign policy appointees are all anti-Iran and will easily fall in with Israel’s agenda as it also serves Washington’s intent to control oil flows and waterways.
Erdogan, the president of Turkey, betrayed Muslims and Putin by allying with Washington and Israel in overthrowing Syria, a country that likely will disappear with portions going to Israel, Turkey, and the oil to the US. Netanyahu has already seized the Golan Heights buffer zone in Syria declaring necessity to protect Israel from threats.
The Western presstitutes are delivering the required narrative to control explanations. The US mercenary Arab forces are presented as “the Syrian opposition,” and the conflict, over with Assad’s departure, is said to have been “a civil war” resulting from Assad’s inflexibility and misrule. In other words, the media finds no US/CIA fingerprints in Syria’s overthrow. As avoiding Putin’s defeat is important to the Russian media, the same story is likely to repeat in the Russian media.
Encouraged by Putin-the-Unready’s inaction on all fronts, the “US is beefing up missile deployment in Europe,” reports RT and also in Japan where the flight time to Vladivostok is 8 minutes. Again Putin is pissing away his strategic advantage, as he did with the Minsk Agreement, while the US develops and deploys hypersonic missiles. Clearly, the Russians do not want war; yet they continue to be hyped as warmongers. while they bring war closer by their inaction.
The quick, easily achieved, enormous victory Washington gained over Russia and Iran in Syria means the assault on the two countries will continue, thus maximizing the chance that Putin will have to surrender or resort to nuclear war.
I sometimes wonder what world the Russians operate in. Putin was unprepared for the color revolution in Georgia, a former province of Russia. He was unprepared for Georgia’s invasion of South Ossetia. He was unprepared for Washington’s overthrow of the Ukraine government. He was unprepared for the US/Ukrainian prepared attack on Donbas Russians. He was unprepared for the overthrow of his Syrian ally. He is unprepared for the current US efforts for a second color revolution in Georgia. It is astonishing that a leader who is forever caught off guard can think that legalisms and truth are the road to peace, Russia’s position as outlined by Lavrov to Tucker Carlson.
As Karl Marx said, force is the only effective force in history. In the past I disputed this, but I am less sure today. It is ironic that it is the “American democracy” that adheres to the Marxist-Leninist line and not the country that emerged from Marxism-Leninism.
The Russians believe in the efficacy of truth. The West believes in the efficacy of force.


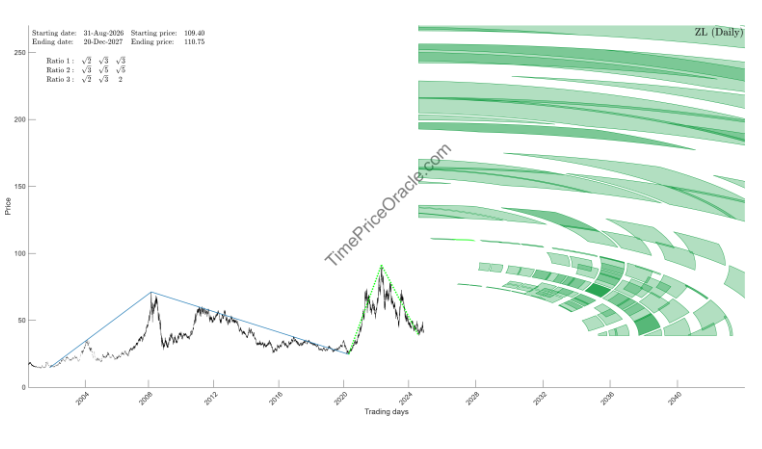
 We just updated our ZL forecast. Let me begin by first sharing our forecast from May of this year. At that time we stated the following….


