If you ever want to ascertain the primary psyche of the American culture, just watch 1 hour of TV, paying particularly close attention to the commercial breaks. Here is what “The Man Behind The Curtain” wants you to do. The worst part is… most people seem to comply.
First, you must go to college, get a massive student loan and get a bunch of credit cards. After you graduate, buy your girlfriend a giant diamond ring, get married and she will love you forever. Then buy a house, a new car, start a family, get a dog and drink a lot of beer. Of course, the overwhelming pressures associated with all of the above will grind you into the ground. But not to worry, our top notch pharmaceutical and medical industry got you covered. Bonner pills, ADD pills, depression pills, high blood pressure pills, surgery and who can forget ….adult diapers. And that’s your future, in a nutshell.
In all of the above, one thing stands out. There is nothing more prevailing in the American culture than the notion that any self respecting, reasonable American with half a brain should own his/her own house. If you don’t, you are viewed as a failure. Now, before I destroy that notion with a few simple calculations and tell you why the housing market is going down the drain again (yes, it’s happening right now), please allow me to destroy the notion of home ownership with some simple common sense.
Reason #1: You Will Never See Your $50-100K Cash Down Payment Again:
Let’s say you are a responsible member of society and instead of getting Interest-Only-No-Down-Payment-I-Am-Never-Going-To-Pay-It-Back Loan, you get a typical 30-Year fixed with 20% down payment. In fact, you have worked incredibly hard and saved up $50,000 – $100,000 to do just that. Congratulations. However, the stupidest think you can do next is to buy a house and get a mortgage. If you do, kiss that money goodbye. Under today’s monetary conditions you are never going to see it again.
“But Alex, my realtor is telling me that buying a house right now is an opportunity of a lifetime….if I don’t do it now, I will never be able to afford it again, recovery is here, the prices are about to go through the roof, blah, blah, blah…” – Everyone.
Well, unless your realtors name is George Soros or Warren Buffett, tell your realtor to go pound sand. What we have experienced between 1994-2007 in the real estate sector is not only atypical, but is truly once in a lifetime. More on that later, but if you are lucky enough to sell the house you buy today at a breakeven, you will still not see the down payment again. It will simply roll over into your next house. From my point of view it is a lot better to invest that money into your future as opposed to park it in an illiquid asset that is likely to lose at least 50% of its value over the next 2 decades.
Reason #2: Closing Costs, Maintenance & Property Taxes:
Finally got that house of your dreams? Great, now bend over and take it like a man. Everything in this house will break down over the next 20 years and it will cost you a boatload of money to maintain. Throw in closing costs and property taxes and you talking about real money. Realtors themselves estimate you should budget about $8,000-$12,000 annually on a $500,000 house. Sure, there is an interest deduction on your taxes, but typically (based on your family’s tax structure) the costs above are never fully recovered.
Reason #3: It’s Not An Investment:
Stop saying that your house is an investment. Just stop. It’s a debt burden, not an investment. Investments produce income and pay dividends. Your house doesn’t do either unless and until you rent it out. Yes, your house can exhibit capital appreciation, but that is not an investment either. That is more accurately defined as a speculation. What we saw during the housing boom was just that. Speculation. Household incomes didn’t go up 500% between 1994-2007, but house prices did. People who were in the real estate sector simply got lucky. Now, it’s time to ride this Cho Cho Train down.
Reason #4: Your House Is A Trap:
Got that house of your dreams in The City of Compton, California? Congratulations, you are now trapped. Even if you get a $100K job offer to wax dolphins in Fiji, you won’t be able to take it. You will be tied down and unable to sell your house at break even. Particularly over the next 2 decades and that is exactly where “Corporate/Government Interests” want you to be. They don’t want you to have the ability to move and get a better job elsewhere. They want you to be tied down, “to have roots”, to be paid less. That wouldn’t be the case if you could increase your salary 25-100% by simply picking up your things and moving across the country.
And that’s just a few of the points. I can keep going, but I think you get the point. The housing myth is just that….a carefully crafted marketing message.
Now, let’s get to the best part.
Here are the reasons why you should be mentally committed if you are even thinking about buying a house. Plus, why you should sell your house NOW if you are misfortunate enough to OWN one.
First, you must understand where we are and the cause/effect behind today’s market.
UNDERSTANDING THE HOUSING MARKET, ECONOMY, SPECULATION AND DRIVERS BEHIND BOTH.
Yes, I called for the real estate crash and credit collapse as early as 2005. While my call was a little bit early and premature, eventually it was right on the money. Now, I am saying that the housing crash is not over.
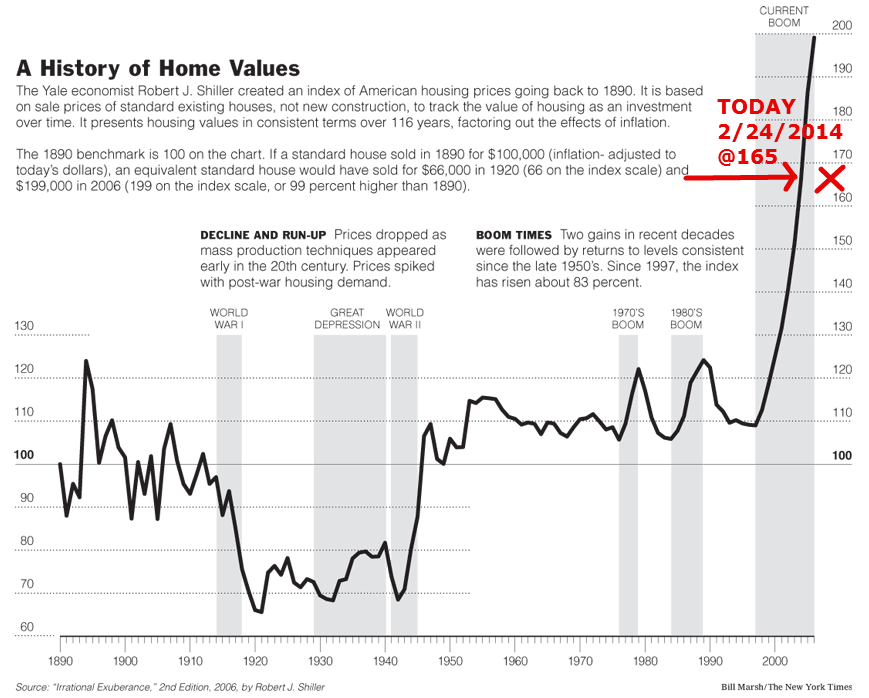
Before we can understand where we are now and where we are going in the future we must understand where we came from. The Real Estate run up that we have experienced between 1997-2007 has no historical precedent. Real estate data going all the way back to 1890 clearly shows that the US housing market basically appreciated at the rate of inflation. Yes, there were some bubbles and substantial declines, but overall, appreciation at the rate of inflation is an appropriate way to look at the US real estate sector.
A QUICK HISTORY LESSON:
All of that changed in 1997 when Bill Clinton signed The Taxpayer Relief Act into law, basically allowing $250,000 in tax free capital gains in real estate. While real estate was already appreciating at a good clip at that time, that law added fire to the trend.
Later, fearing significant economic slowdown in 2002-2003 the Bush administration added a huge amount of jet fuel to the Real Estate Bubble by cutting interest rates and making mortgage finance available to everyone (yes, even to the dead people). As people used to say, if you can fog a mirror you can get a mortgage. Of course, all of that led to the largest finance bubble in the history of mankind that “kind of” melted down in 2007-2009. I say “kind of” because most of those excesses are still within our financial system and will have to be worked through in the future.
WHERE ARE WE NOW?
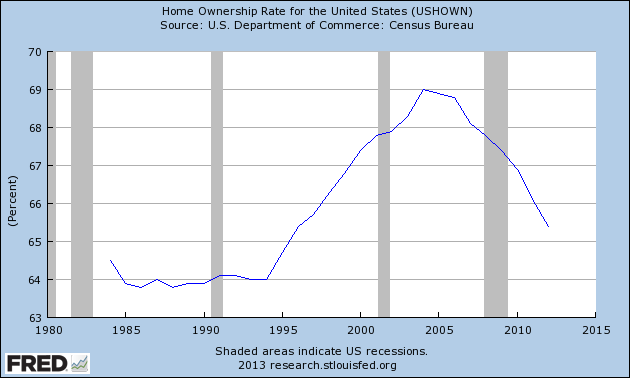
Issue #1: US Home Ownership Rate Is Plunging
On historical basis, home ownership rate in the US is in free fall. Take a look at the chart. I think it speaks for itself.
Issue #2: Real Estate Affordability Is Plunging
Take a look at the chart as it speaks for itself. The affordability index is in free fall as well. Most certainly, due to higher interest rates and rising prices. 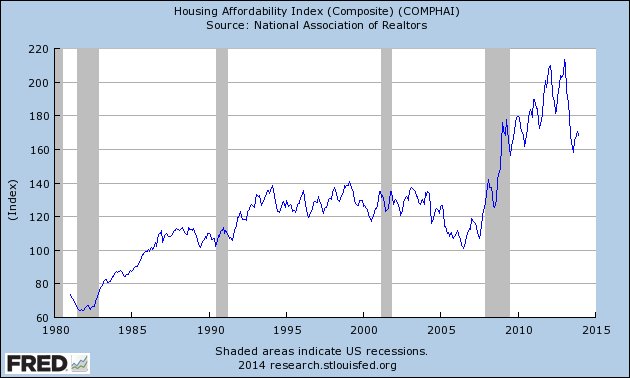
Issue #3: Interest Rates Are Going Up
The trend has shifted up and the 10-year rate is up 100% over the last 12 months. I gave detailed interest rate analysis here. Please take a look here.
Issue #4: US Economy & The Stock Market Is About To Turn Down (Big Time)
This has been the primary trend in our blog since inception. Based on our mathematical and timing work the stock market will go through a bear market between 2014-2017. Pushing the US Economy back into a severe recession. To learn more about the upcoming bear market please Click Here and read the report. With further job losses , lower incomes and an economic contraction it would be impossible for the real estate sector to sustain any sort of a rebound. On the contrary, as the economy tanks real estate prices are bound to collapse further.
Issue #5: Who Is Buying All Of These Properties For Cash Today?
Chinese buyers, hedge funds, banks themselves, investors, speculators, etc….. Who cares!!! Remember all those Japanese investors buying everything they could in California and Hawaii in the late 1980′s. I wonder how that turned out for them.
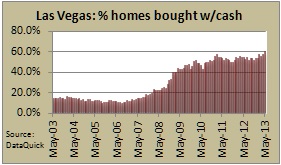
In one of my previous reports I have outlined how large hedge funds, including Blackstone Group, are buying tens of thousands of real estate properties across the nation. With some hedge funds and financial institutions going to the extreme and investing in the likes of plumbers and dentist to help them find and manage properties(Click Here To Read). In Las Vegas alone 70% of real estate purchases over the last year have been done by investors. If all of this doesn’t not scream out “Market Top” at you, I really don’t know what will.
On a more serious note, notice that I didn’t say Average American Family. That is the only category that we should track if we want to accurately predict the future trend in the US Real Estate market. Every other category is irrelevant over the long run. And guess what? They are not buying. See the charts above.
Issue #6: Bear Market In Real Estate (sucks people back in)
As I have said in one of my previous posts (US Real Estate At A Turning Point), this is how the bear market works. This is the stage #2 bounce, before the big decline (stage #3). The bear market tends to suck people back in, offer them perceived safety and a high return before slamming the door, ripping their head off, drinking their blood and taking all of their money. The US Real Estate market is topping in Stage #2 run up here. That is why you are seeing so many divergences. The market should turn down soon. Beware.
FUTURE OF REAL ESTATE:
Real estate is not made of Gold. There is a tremendous amount of land available in California, Florida, Nevada and all over the US. There is no housing shortage. As such, expect real estate to decline significantly in order to revert back to its natural inflation adjusted mean. It might take a few years, it might be different for various cities, but one way or another the market will get there.
HOW FAR DOWN?
Let’s do very simple math for the San Diego market. It doesn’t have to be exact for our purposes.
Setup:
- San Diego Median Family Income: $61,500
- As Per Various Financial Guidelines Families Shouldn’t Spend More Than 30% Of Their Income On Housing. That means a $1,500/monthly payment.
- Median Home Price in San Diego: $425,000
- Interest Rates: 30 Year Mortgage 4.35% (Rates as of 2/21/2014)
With such fundamental input variables median house value should be $300,000 -OR – A 30% DECLINE ($1,500x360month@4.72%)
What if interest rates go to 7% over the next 5 years, which can easily happen?
The fundamental value of the median house drops further to $225,000 -OR- A 47% DECLINE
Also, don’t forget that markets oftentimes overshoot to the bottom, just as they set blow off tops. In such a case I wouldn’t be surprised to see a median price of $150,000- 200K -OR- A 65%-50% DECLINE
You say impossible….. I say study financial markets. Nothing is impossible. Here is another way to look at this. Have household incomes increased 500% over the last 20 years? Nope. They have barely moved. Therefore, real estate decline in excess of 50% would simply return the prices to their inflation adjusted base.
TIMING:
In one of my earlier reports “I Am Calling For A Real Estate Top Here“ I clearly outlined the fundamental reasons of why the real estate market has peaked and is now in the process of rolling over. I continue to believe that the nationwide real estate prices are in the process of setting in a top. Since real estate is local, it is much more difficult to identify exact tops. As such, we must go back to the stock market in order gage a better understanding of WHEN the real estate market will tank.
Typically, the stock market foreruns the actual economic recession by 6-12 months. In other words, the stock market prices break down 6-12 months before Economic Data confirms a recession. While real estate prices, in theory, should start breaking down in conjunction with the stock market, that is not always the case. As such, it would be prudent for us to say that the housing prices will start breaking down 6-9 months after the start of the bear market in stocks.
As you know, it has been my claim (based on my mathematical and timing work) that the stock market topped out on December 31st, 2013 ushering in the final leg of a cyclical bear market. If such is the case, we can safely assume that we will start seeing drops in real estate prices sometime in the summer of 2014. Once the market rolls over and confirms, we should see a significant acceleration to the downside in real estate price over the next 3 years (at least).
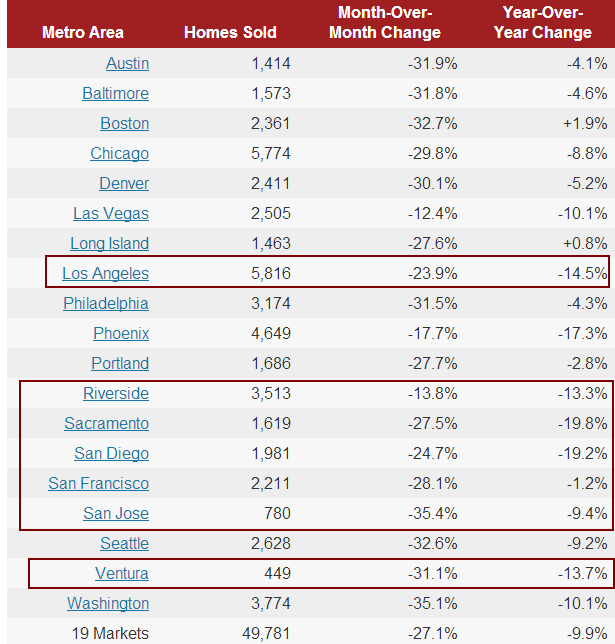
With that said, we already starting to see evidence that the housing has topped. Please see volume data from RedFin.com below. As always, the volume of sales is first to go. Prices tend to follow.
WHAT SHOULD YOU DO?
That part is somewhat simple. If you do not own a home and thinking about buying one…..just DON’T do it. You will save a lot of cash (and your down payment) by renting and waiting for the market to come down over the next few years.
If you already own a home the situation is a little bit tricky. Listen, I am no fool and understand that your house is a home and is important for family formation/structure. If you are happy with you home and could care less what is going on in the real estate market……stay put. However, if you are thinking about selling your home, right now would be a great time to do so.
If you own rental properties that generate positive cash flow and they are not in any way tied into the upcoming real estate decline, keep them. If you are buying investment and/or rental properties as a “speculation” in hopes of capital appreciation or a “flip” you are better off liquidating all of your positions (right now) and getting out.
CONCLUSION:
Now, I understand and agree that there are various market forces at play that make the picture a lot more complicated. Interest rates, timing, mortgage finance, cash buyers, the FED, foreign buyers, speculation, location, supply/demand, etc…. However, fundamentals will always prevail over time. Everything else is just temporary BS.
Did you enjoy this article? If so, please share our blog with your friends as we try to get traction. Gratitude!!!


