InvestWithAlex.com 

Stock Market And 3-Dimensional Analysis

1994-2014 Analysis 

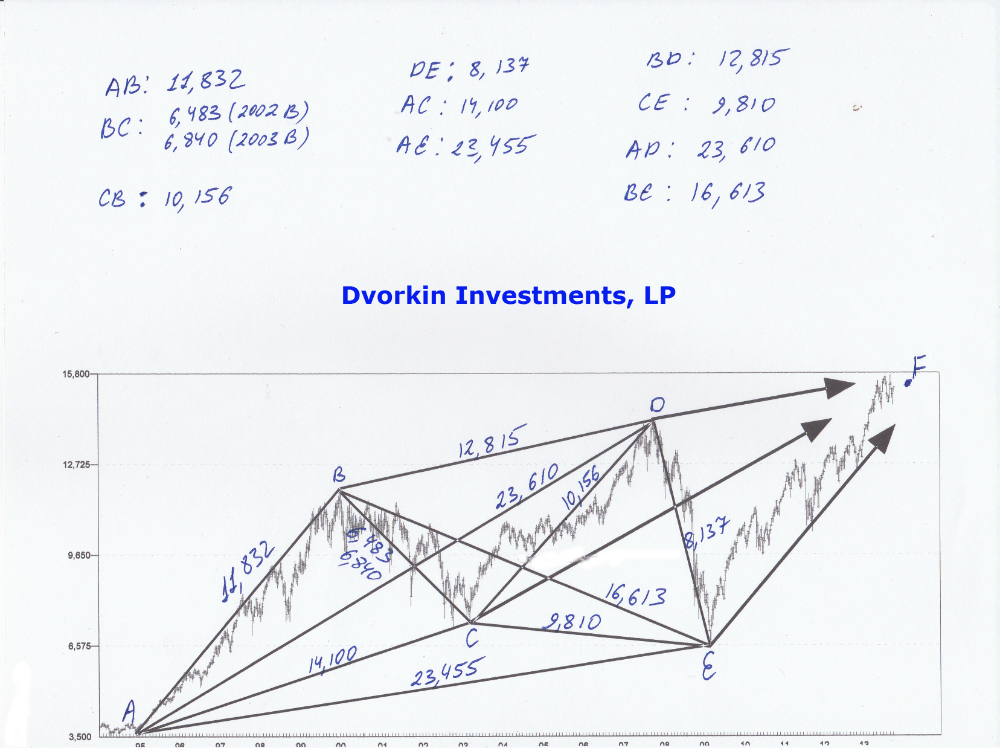
Once again the chart above represents 3-Dimensional movements within the stock market. The numbers above unify price and time into one number and are calculated as per Pythagorean Theorem formula given to you earlier.

While we have already looked at the number of these moves before let’s take a look at one more to cement our knowledge. Let’s take a look at the DE move as an example.  During this bear market decline of 2007-2009, the market moved exactly 7809 points in exactly 2288 trading hours.  When we apply our 3-Dimensional calculation we get a 3-DV of 8,137, which is the number you see on the chart. I highly encourage you to run every number on the chart above to confirm the numbers and to gain a better understanding.      

Now, understand something very important.  While the chart above is a long term chart representing the DOW between 1994-2013, it doesn’t have to be. The chart above could be the stock market chart over the last century or it could be a daily chart representing 2 hours of trading. The time frame doesn’t matter.  The same rules of 3-Dimensional analysis apply to all time frames.

What are the rules?

Rule #1: By identifying 3-DV on the chart you know exactly what the next move will be. It will either be identical to the one preceding it or a derivative of it. Meaning that once you know what the DE on the chart is, you can predict with great accuracy what the EF move will be. To the day and to the point. That’s how accurate this work is. Much more on that later.  

Rule #2: Make sure you know the time frame you are analyzing.  If you are using a long term chart, as above, make sure you do not shift to the short term chart and anticipate the same size movements.  For example, do not take DE 8,137 value and they try to find it on the daily chart. It will not work. You will only be able to find this value or the value of its derivative on the long term chart.

Rule #3: Always square price and time. When calculating your 3-DV make sure your time variable and your price variable are squared(match in size).  In simple terms, at certain times you would have to shift your time variable between minutes, hours, days and month.  Let me illustrate what I mean by showing you the right and the wrong way to do this.

Let’s assume for a second that you are looking at the chart above.  Current market is a high energy, fast moving market.  As such you have to use the hourly time frame to square the chart.  It would be wrong to use any other TIME variable.  Let’s take a look at the move labeled CD. Between 2003 bottom and 2007 top the market moved…

Price Move: 6,838 POINTS

Time Move: 7510 TRADING HOURS OR 1,155 TRADING DAYS -OR- 231 WEEKS -OR- 58 MONTH (there are 6.5 trading hours in 1 trading day)

If you want to generate a proper 3-DV measurement you have to use 7,510 trading hours as your primary TIME input. That input squares  (matches) the price movement. If you were to use trading days or weeks or months, the PRICE portion of the formula would overwhelm the equation and you would end up with a worthless measurement that is not applicable to the stock market analysis. Let me show you what I mean.  

To be continued……

Did you enjoy this article? If so, please share our blog with your friends as we try to get traction. Gratitude!!! 

Overconfidence Kills

A Word Of Caution

overconfidence investwithalex

It is important that I pause here for a second and caution you that arbitrary use of 3-Dimensional analysis techniques described in this book could be very dangerous. Having learned this the hard way, please allow me to tell you a cautionary tale.

Back in 2006 and after years of looking into this type of analysis I have made a number of significant breakthroughs that led me to believe that I have finally fully cracked the 3-Dimensional analysis and have fully cracked the “stock market code”.  What followed was nothing short of amazing. Over the next 30 trading days I was able to predict the stock market within daily resolution and with 90-95% accuracy. Needless to say I was making a lot of money.

Yet, this same work and the success it brought have led me to an overconfidence level that should not be exhibited by any reasonable investor.  It led to me to make large bets in situations that do not warrant it, all because my mathematical 3-Dimensional work has indicated a certain move in a particular direction. This strategy worked until  one day when my analytical work backfired and led to massive losses in my fund.  Instead of a powerful move to the downside (which my work predicted), there was a powerful move to the upside, wiping out all of my gains and causing large losses in the process.

For the purposes of this book the lesson here is twofold.

First and foremost, do not use these techniques in an arbitrary fashion or with 100% confidence.  Yes, this work can and does predict the market with incredible accuracy, but that accuracy can only be attained after a substantial investment of your time into performing any such 3-Dimensional analysis.  You should never  follow anyone analysis or make use of simple tools or use it just because you saw it in this book without first understanding of WHY you are doing so.  Let me repeat that, until you reach the level of analysis where you clearly understand WHY you are doing something, do not use the tools here in an arbitrary fashion.  

Second,  never be 100% confident in your work. Even if your 3-Dimensional work has advanced substantially and you consistently making exact forecasts, be wary of it.  Always maintain the psychological investor mind frame that your analysis might be wrong. Never bet the farm based on your analysis and never back yourself into a corner. Always use stop losses and always leave room for maneuver, even if you are 100% confident. Remember, you will have plenty of opportunities to make money.              

It is my hope this warning steers you clear of trouble and helps you avoid the mistakes that I have made. Now, back to the stock market analysis. 

Did you enjoy this article? If so, please share our blog with your friends as we try to get traction. Gratitude!!!

The Secret Behind How The Stock Market Works (Part 5)

Let’s take a quick look at a real stock market example to see the amazing precision this technique offers us.

Long Term Dow Structure2 

I cannot overstate how amazing this chart is. Just a few points. 

  • As we have already discussed, the move between 1994 bottom and 2000 top was 11,832 3-DV UNITS. The Dow topped at exactly 11,866 in January of 2000. Amazing!!! 
  • The up move between 1994 bottom and 2000 top was 11,832 3-DV UNITS. The down move between 2000 top and 2002 bottom was 6,483 3-DV UNITS. When you combine both values together you end up with a value of 18,315 3-DV UNITS. The move took 9 years. 
  • The up move between 2002 bottom and 2007 top was 10,156 3-DV UNITS. The down move between 2007 top and 2009 bottom was 8,137 3-DV UNITS. When you combine both values together you end up with a value of 18,293 3-DV UNITS.  The move took 7 years. 

So, the combined move took 16 years and there was only 22 3-DV UNITS of variance between the moves.  This variance over the 16 year period of time can be attributed to as little as 2 trading days and a few hundred points on the Dow.  This example alone should put to rest all claims that the stock market is random and unpredictable. Once again, when we identify the exact structure of the stock market through using our 3-Dimensional analysis we can time the market with great precision. 

For example, if we understand the structure above we know that the move between 2002 bottom and 2007 bottom will be identical in 3-DV UNITS to the move between 1994 bottom and 2002 bottom.  Just by having this information alone one should be able to figure out the stock market with great precision.  Further,  once we have hit the  from 2007 top and analyst using this technique knows that the upcoming down move will be exactly 8,127 3-DV UNITS. (18283-10156=8,127)

The only thing left to figure out at that stage is the angle or the velocity of the upcoming decline. Multiple ways will be shown to figure out that inflection point over the next few chapters, but for now let’s assume that this information is already available. That would mean that once the 2007 top is confirmed you would know exactly where the market would bottom.  So, while everyone is freaking out in late 2008 and early 2009 you are either shorting the market and making a lot of money or you are setting yourself up for the upcoming bull market that you know will start in March of 2009.

Either way, I hope this clearly illustrates how powerful this 3-Dimensional analysis can be. Also, please keep in mind that the example above is just a tiny sample of the information available to you once the 3-Dimensional analysis is performed. 

Did you enjoy this article? If so, please share our blog with your friends as we try to get traction. Gratitude!!! 

The Secret Behind How The Stock Market Works (Part 4)

So, how do we measure the stock market in 3-dimensional space? 

By using simple math.  However, before I go any further I would like to give credit where the credit is due.  The technique below was first developed by a brilliant market analyst by the name of Bradley Cowan. If you are serious about performing stock market analysis I encourage you to seek out his work.

In order to measure the stock market in 3-dimensional space, we must unify price and time values into a one joined value. How do we do that? By using simple geometry and Pythagorean Theorem.  For our purposes here is all you need to know.  We call the outcome 3-Dimensional Value (3DV)

3DV-INVESTWITHALEX

As such and in order to properly calculate the value we need two numbers.  Time and value over a studied period of time.  As a reference point, we typically measure these values between bottom-to-top -OR-  top-to-bottom moves. Let’s take a quick look at the real life examples for a quick reference point.  There was a strong bull market between November 1994 and January of 2000(a 5-year cycle).  

More precisely, the market moved exactly 8,296 points in exactly 8,437 trading hours. The move occurred between BOTTOM on 11/24/1994 and TOP on 1/14/2000. There are 6.5 trading hours each day the market is open. I highly recommend you verify these numbers and perform sample calculations on your accord for better understanding.

Now, to calculate 3DV according to the formula above

SQRT(8296^2+8437^2)= 11,832.75 
*SQRT= Square Root

The 11,832.75 value is the 3-Dimensional Value we are seeking. It is the first step in our Timing financial analysis.  An analyst who is willing to put in the work,  will soon start seeing periodicity and recurring patterns of the same size movements on multiple time frames. Once the sequence of such moves is understood, exact forecasts into the future could be made. For example, let’s take a look at our 3DV of 11,832.72.   Do you know that the stock market topped out on January 14th, 2000 at the price of 11,866.55 or just 33 points away from our 3DV.

Do you believe that is a coincidence?   No, not at all. As I have told you before, there is a mathematically exact structure within the stock market and once that structure is understood, the stock market(and individual stocks) can be timed and predicted with great precision. 

To Be Continued…..

Did you enjoy this post? If so, please share our blog with your friends as we try to get traction. Gratitude!!! 

The Secret Behind How The Stock Market Works (Part 3)

3d tunnel - invest with alex

……continuation

Second, along the same lines, I want you think of a simple pine tree seed.  Before that seed is put into the ground and the tree begins to grow, that seed contains all available information about the tree. The seed is already pre-programmed with what that tree will look like. How tall, how many branches, their direction, their variation, etc… everything. No doubt, the environmental factors will have an impact, but such factors are typically within a certain range of variance.  Should we have the technology, we should be able to know exactly what the tree will look like just by looking at the seed.  Now the scientists can even take seeds that are tens of thousands of years old and set them on a proper growth trajectory. Amazing.

Back to the stock market.  We have to begin thinking about the stock market not as a simple chart of price moving over time(2-dimensional representation),  but as a complex natural system.  If you look at and study nature, nothing in nature is two dimensional.  Our perception could be two dimensional, but the nature itself and everything that exists in nature is 3-dimensional.  Everything from galaxies to the smallest particles are 3 dimensional.  With that said, is it possible that the stock market is not a simple 2 dimensional system, but a more complex 3 or even a  4 dimensional system?

The answer is YES.

With proper understanding now in place we can start looking at the stock market in a completely different way. The stock market is not a simple 2-dimensional structure (up and down over time) but a much more complex 3-dimensional system.  In addition to moving up/down and sideways, it also moves in volume of space.  While it is a little bit difficult to understand at first, please allow me to illustrate. I want you to take a look at the 3-dimensional tunnel above.

Imagine for a second that you are standing at the entrance and looking into the tunnel. Further, imagine that there is a snake in the tunnel that is moving away from you in a screw like fashion while hugging the wall of the tunnel. Got that picture in your mind? Great.  That is a good representation of how the stock market truly works.   Now, if you are to walk to the outside of the tunnel and stand at the half way point (preferably at a good distance from the tunnel) you will only see up and down movements of the snake as it move along the wall in a screw like fashion throughout the length of the tunnel (from left to right).  And indeed, that is exactly what we see on a typical 2-dimensional stock market chart.

Simply put, when we look at any existing stock chart, we see the shadow of the move and not the move itself.  In reality, the market moves up/down, over time and in 3-dimensional volume of space (not to be mistaken with transactional volume).  Once we understand that the stock market is a 3-dimensional phenomena we can begin to apply all scientific and mathematical rules that could be found/applied in nature.  Just as with the human being and the tree seed examples above, the stock market has its own “Genetic/DNA Code” and sequence and once that code/sequence is understood exact forecasts could be made. 

Here is the best part. Once we start seeing the market that way we can begin analyzing and measuring the market in a completely different way.  Instead of using technical analysis, trend lines, etc… it gives us the ability to bring in exact scientific and mathematical models into the analysis part of the equation.  Where typical stock market forecasts are inaccurate at best , this mathematical modeling allows us to bring in precision that was unavailable before. Simply put, it allows us to predict the stock market with astonishing accuracy.

So, how do we measure the stock market in 3-dimensional space?  To be continued….

It is now your time to become a Superhuman. To live the life full of love, happiness, joy, bliss, ecstasy, content and success. 

The Secret Behind How The Stock Market Works (Part 3)

Warning: Shocking Life or Death Situation Needs Your Immediate Attention

Donate Directly To Two Amazing Families In Desperate Need For Everything After Typhoon Haiyan In The Philippines

Dear Friends, 

I have two very good friends in the Philippines who are in desperate need of your help.  Their families have lost everything in the aftermath of Typhoon Haiyan. What’s worse is that their families are mostly comprised of the elderly and the kids (see pictures below). Their homes have been destroyed and they have no water and no food….. they are literally starving to death.  Please see more details below.

Melanie on the left Jessica in the middle Ugly guy on the right is me
Melanie on the left, Jessica in the middle, Ugly guy on the right is me

I first met Melanie and Jessica (cousins) shortly after I have arrived in Manila. I was walking through a local mall when I saw two beautiful girls sitting at a coffee shop talking. I have approached and asked them if they know if there was a Pet Shop in the mall because I have to buy a hamster for a friend I have. They looked me up and down, gave me a dirty look and told me with 100% assurance that I am out of luck as there are no hamsters available for sale in the Philippines. We have been friends ever since. 

They have even worked for me and I have never met more deserving people.  Here is what I can tell you.  They came to Manila from Leyte  at the age of 18, without knowing a single soul and without a penny in their pockets. Somehow they have managed to put themselves through a University while working full time. All while sending most of the money they have earned back to their families. I don’t know how they did it, but they did.

Not only are these girls beautiful and smart, but they are incredibly hard working and honest.  Yet, sometimes life is not fair and bad things happen to good people.  Sometimes life turns around and punches you in the face. That is what has happened here.  The largest storm ever recorded, Typhoon Haiyan, has literally wiped out their home town from the face of the earth.  While their families have managed to survive (although some people are still unaccounted for) they have nothing left. Everything their families have had is now gone.

When I say everything, I mean everything. Their families have managed to escape the Typhoon with just the clothe on their backs, but that’s it.  After 4 days of no communication we just found out from a friend that they are sitting in the evacuation center with thousands of other people trying to survive.  As of now they have no water nor food left and are literally starving to death. 

They desperately need your help. NOW.  

I know it’s a lot easier to give money to Red Cross or countless other organizations. Give,feel good and forget about it (so to speak). Yet, this is your chance to do a lot more than just to give and forget. Not only will every single penny that you will give go towards their families (no overhead cost), but I will keep you updated on all of the developments. Instead of just throwing money at the problem and not knowing what came out of it,  I will keep you posted on where every single dollar goes.   

I beg you to just give something.  Even if it’s just a $1 or $5.  I know times are tough, but I guarantee you that it is not as tough for you as it is for the families in question. They are dying of starvation.  Just skip Starbucks tomorrow and send $5 to help these people out.  If you can send more, we would be forever grateful.  Please Click On The PayPal Donation button below to do so. Once again, every single penny will go towards helping these families 1. Survive and 2. Rebuild.   We have no time to wait,  please donate now.

Click on the Donate button below. Enter the amount you would like to donate and follow the steps. Thank you in advance for your help. 


(***If you can’t send anything, I ask that you share this post with your friends so we can get more exposure).

QUESTIONS & ANSWERS:

Where were they from?

They are from a small town called, Leyte, Leyte.  By now everyone knows of Tacloban City as it has been in every major media outlet. Leyte is a small town 30 miles to the west of Tacloban City. The eye of the storm has passed directly over the town and has decimated it completely. 100% of the city has been wiped out.  

map-leyte

What is it a strong storm?

Typhoon Haiyan was the strongest storm EVER recorded. Category 5, with wind speeds of up to 200 MPH. Nothing could withstand that power. Not even the structures build in the US. Everything in its path was destroyed.  Just to give you a reference point, this storm was 3 times more powerful than hurricane Katrina which decimated New Orleans.

Please see before and after pictures for reference. 

Latest News Coverage: Clinic in typhoon-hit city overrun with patients


What is the extent of the damage to their properties and the lives of their family members?

Catastrophic. 100% destruction to everything. They have nothing left. Their homes have been completely destroyed. Please click on the pictures below to see the extent of the damage. These used to be their homes. We just got the pictures.   

house2

house1

house3

house4

house5

What is the status of their families?

They are living at a local school. The school has been severely damaged by the typhoon as well. They have no food and no water. They are literally starving to death. Supplies are on the way, but they desperately need more help….NOW.  All together, there are about 20 family members in need.  12 of them are elderly and young kids. Here is just one picture I have. I will post more as they become available. 

Grandma and 2 grand kids. They are starving now.
Grandma and 2 grand kids.

niece

Who are you and how do I make sure this is not a scam?

My name is Alex Dvorkin and I own/write this blog and own a few businesses. You can learn more about me here. Here is my Facebook and Twitter for your verification as well. 

To Make Sure Girls Are Real (You can also search for them in other Social Media outlets to make sure  they are real).

Melanie Facebook: 

Jessica Facebook: 

The PayPal Account you will be donating to is under my business name ExpertZoo.com. You can verify that through whois database registry. Once again, every single penny will go towards the families and I will post prove later.

Why should I donate?

For you $5 is nothing, for them it’s the difference between life and death.  Basically, I want you to save a life today and help another human being in need. It will come back to you 100 fold. I promise.  Plus, every single penny will go directly towards helping these families and not towards overhead. Donate as much as you possibly can. 

OK, how can I donate?

Please click on the PayPal button and donate any amount that you wish. Simply enter the amount and follow the steps. Thank you in advance for your help.


(***If you cannot donate, I ask that you please share this with your friends so we can increase exposure and maximize donations. Please email me at alex@investwithalex.com  should you have any questions. Thanks)

How To Use Sex To Predict The Stock Market With 100% Accuracy

Better Representation Of The Stock Market

Continuation of The Secret Behind How The Stock Market Works

Let me repeat that one more time.  TIME or TIMING is the most important element when it comes to stock market investing.

So much so that once you understand that fact and once you have a better understanding of how the stock market works you will be perplexed as to why most people and analyst on Wall Street completely ignore the TIME part of the equation.  Going even further I will make two controversial statements that I will prove in this section of the book without a shadow of the doubt.

1. The stock market and/or individual stocks are not random.

Not at all.  Quite the opposite, they are exact. The stock market moves in 3 dimensional space between mathematical points of force while tracing out an exact structure. In more simple terms, the stock market or individual stocks are moving exactly as they should and with mathematical precision.

2. The stock market and/or individual stocks can be predicted into the future  with great accuracy.

Since the stock market moves with mathematical precision while tracing out points of force, once the overall structure is fully understood, exact calculations could be made in order to predict the stock market or individual stocks. Well into the future and on multiple time frames.  From hourly moves to moves spanning centuries. 

God does not play dice with the universe, —Albert Einstein

The quote above is right on the money.  It means that nothing in nature is random.  As Einstein himself said on numerous occasions, the only randomness out there is things we do not yet understand. I tend to agree.  As such, the only reason we believe the stock market is random is because we do not yet understand its exact mathematical composition. To understand why, we must first look at nature, how things work and how all of it applies to the stock market. Let me give you two examples.

First, let’s take a look at the human being at the moment of inception. Not birth, but fertilization. When the genetic material of the sperm and the egg is combined to create a new cell that will rapidly start dividing. I want you to think about that single cell for a second. When genetic material is combined, in that split second an exact forecast could be made about what kind of a human being will be born. If we had the technology,  in that split second we would know all possible information about that person.

For instance, we would know if it would be a boy or a girl. We would know the eye color, height, hair type and color, exact length of fingers and toes, blood type, predisposition to certain diseases, psychological predisposition, character traits, etc…   We would also be able to know exactly what that human will look like at the age of 5, 25, 50, 80, etc…  In addition, we would be able to make a pretty good guess about when that organism will die. All of that at the point of conception and all based on the DNA sequence/genetic composition alone. All of that information is available at the point of conception if we had the technology to decipher it. Maybe one day.

Certainly,  the environmental factors such as accidental death, living conditions, etc… will have an impact on the human being in question, but not as much as you think.  You are probably scratching your head now wondering what any of this has to do with the stock market.  Well, most of us look at human life as random and unpredictable, yet, an exact forecast could be made about your human composition at the moment of conception. Same with the stock market……  To be continued

Did you enjoy this article? If so, please share our blog with your friends as we try to get traction. Gratitude!!!  

How To Use Sex To Predict The Stock Market With 100% Accuracy

Warning: Real Estate Implosion Is Starting

BusinessWeek Writes: D.R. Horton CEO: Somebody Please Tell Home Buyers Rates Are Still Low

 crying-house-investwithalex

The Texas-based builder’s new home orders dropped 2 percent from the year-earlier period, which Horton Chief Executive Officer Donald Tomnitz attributed to consumers’ high sensitivity to tiny interest rate changes. “I don’t mean to date myself, but … no one around this table can remember mortgage rates being higher than 6 percent or 7 percent,” he said. “And I think one of the factors that we are dealing with, quite frankly, is most analysts, and most young buyers—especially first-time home buyers in the market today—have been accustomed to low rates for all their lives.”

The difference in sales price is only $34,096, but the 2013 buyer will end up paying about $104,000 more over the life of the loan, including an additional $64,000 or so in interest payments. That’s not an insignificant amount of cash. It’s enough to cover a bare-bones Tesla (TSLA); it’s also roughly 25 percent more than the median household income in the U.S.

Read The Rest Of The Article Here

Just as I have said many times before we are continuing to see signs that the Real Estate Market is beginning to roll over. This latest whining from D.R. Horton CEO is a clear indication of that.

A few weeks ago I went out on a limb and called for a housing market top. I gave you the exact reason why the real estate market is topping and what you should anticipate going forward. Once again, you can read the article here… I Am Calling For A Real Estate Top Here   As one of the signs and as anticipated we are starting to see crazy talk from industry insiders.  Even though interest rates are still historically low Mr. Tomnitz is blaming buyer perception of interest rates for slow down in his business. As if buyers are waiting for interest rates to come down again. Maybe that is the case, but I highly doubt it.

The real reason behind the slowdown is un-affordability of real estate in this country and a massive (unsustainable) speculative bubble that has been created in the sector once again. If I could, I would tell Mr. Tomnitz get ready for the 3rd leg down in the real estate market. 

If history teaches us anything, it will be much more violent than the 2006-2010 decline in real estate prices. 

Did you enjoy this article? If so, please share our blog with your friends as we try to get traction. Gratitude!!! 

Warning: Real Estate Implosion Is Starting

The Secret Behind How The Stock Market Works

Confused-investwithalex

For most people the stock market is an enigma.  It is a mystical creature that many have tried to tame, but very few have ever come close to succeeding. When you think you finally have a good understanding of how it works, the markets tends to turn around and slap you in the face. When the news is great it goes down and when the news is bad it surges higher. Only to turn around and repeat the sequence in the opposite direction. Leaving most people frustrated and without any sort of guidance.  

Over the last 200 years hundreds of different approaches and analytical tools have been developed by people from all walks of life to try and predict the market.  Everything from fundamental analysis to studying the planets/astrology, from complex mathematical formulas to technical analysis, from computerized trading  to consulting fortune tellers, witchcraft, etc….  While many have claimed to figure it out, only a few have. Thus far I know of only two people who have been able to break the stock market code.  From what I have seen their work proves it without any doubt.

The most prominent and the most accepted stock market theory today is called “Efficient Market Hypothesis”. The theory basically states that the overall stock market is efficient as it continuously and immediately discounts all available information. Under such circumstances it is impossible to outperform the market over an extended period of time. While loved by academia, this hypothesis is, for the most part, dismissed by true market practitioners.

Even the king of investing Warren Buffett has not only dismissed the theory by making a number of compelling arguments against it, but he has also proved  without a shadow of a doubt that the stock market can be beat over an extended period of time.  His investment returns prove that.  In simple terms, just as the clock is right twice a day, so is the efficient market theory. The market is indeed efficient but only at various points and at various times as the overall stock market continues to oscillate up and down.  

Since there is no real workable theory on how the stock market really works and since so many people have tried to figure it out in the past but have failed, is there any chance for us to understand it?

The answer is  YES.  

Not only to understand it, but predict it with great accuracy. That’s what this section of the book is all about. To take a completely unique look at the stock market from a different vantage point in order to finally understand how the stock market works.  Further, such a view will allow us to understand why the market has behaved as it did in the past and it will allow us to predict what’s coming next.  It goes without saying that having access to such knowledge can be incredibly valuable and profitable.

So, how does the stock market work?

First, you must understand something very important. If you look at any stock market chart you will see price (Y Axis) moving over time (X Axis) in 2 dimensions.  In today’s analyst society all attention is given to the Y Axis or study of the price movements and very little (if any) attention to the study of time. Yet, the TIME is the most important element. .

…….to be continued….

The Biggest Problems With Value Investing (Part 2)

swirly-clock-investiwthalex

I respectfully disagree.   There are two issues to consider.

First, the opportunity cost of capital is real.  What happens if your perfect value investment (Rocket Ship or Waking Beast) hasn’t moved anywhere over the last 3-5 years even though the market is up 60% over the same period of time? What if another stock that you have considered at the same time has appreciated 150% while your stock has lagged behind or worse, declined?  Well, the impact on your capital in real and opportunity cost is significant. An ill timed move over a certain period of time can end up costing you millions in opportunity cost alone. While diversification can help you mitigate the impact of opportunity cost, it can also reduce your returns should you diversify too much.   

Second, while this might not be an issue for individual investors, this is a significant issue for professional money managers who must present their performance and answer to investors on regular basis. As such, most money managers end up under constant pressure to perform. To generate positive returns for their investors while outperforming the competition.  Should they fail to do so, investors will not hesitate for a second to pull their money and allocate it to a better performing fund.

That is true even if the stock picks the manager has generated are well researched and shall provide the investment fund with outsized returns if given enough time. Unfortunately, most investors have a very short time frames and if they do not see immediate results they express their dissatisfaction by turning their back on the money managers and by walking away. 

That is why TIMING must become  increasingly important issue not only for individual investors but for money managers as well.  Just imagine for a second what would happen if you could identify the exact timing of any anticipated move.

What if you could take a look at any given Rocket Ship or Waking Beast value stock and add another level of analysis that would allow you to identify exactly when that stock is going to start going up and at what point it will stop.  What if you are able to determine the velocity of any such move and establish an exit point with great precision and long before it occurs.  

Well, now you can.

That is what the second part of this book is all about.  TIMING.  We will add a level of timing analysis to your typical and well known value approach to investing.  This quantum jump forward in financial analysis shall help you supercharge your investment returns while further reducing risk. We will take an in depth look at my unique method of timing the stock market (and individual stocks) and how you can apply this same type of analysis towards your own research  and investing.

Further, we will take an in depth  look at the overall stock market so I can show you exactly how it works. Through using modern science and mathematics I will show you how and why the overall stock market truly moves.  For the first time in your life you will have a complete understanding that the stock market is neither volatile nor random, but acts exactly as it should by tracing out mathematical points of force in 3 dimensional space.

By the end of the TIMING section you should be able to use concepts discussed here to time the stock market and/or individual stocks with great accuracy. Leading you to amazing results,  market beating performance and a much lower risk profile.

Let’s get to it. 

Did you enjoy this article? If so, please share our blog with your friends as we try to get traction. Gratitude!!!