10/2/2018 – A mixed day with the Dow Jones up 123 points (+0.47%) and the Nasdaq down 38 points (-0.46%)
The stock market finds itself at an incredibly important juncture. Things are about to move. If you would like to find out what happens next, based on our timing and mathematical work, in both price and time, please Click Here.
Now that your day trading grandma is fully invested, what happens next?
U.S. HOUSEHOLDS LOADED UP ON STOCKS

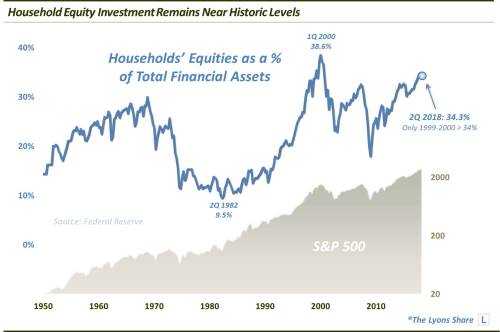
Outside of the 2000 dotcom bubble, U.S. households have never had more of their assets invested in the stock market.
The U.S. stock market, i.e., the S&P 500, soared back to new all-time highs again today – always a welcomed development for investors. And it is especially welcomed now considering the fact that investors are loaded up with stocks at the moment. That information comes courtesy of one of our favorite investment related statistics.
From the Federal Reserve’s Z.1 release, we find that U.S. Households had a reported 34.3% of their financial assets invested in the equity market as of the 2nd quarter. Outside of a slightly higher reading in the 4th quarter of 2017, that is the highest level of stock investment in the 70-plus year history of the series, other than the 1999-2000 bubble top.
The above is consistent with numerous other indicators we have looked at before. For instance, Shiller’s Adjusted P/E Ratio is at 33.50 (double the mean) and arguably at the highest level in the stock market’s history (if we adjust for 2000 tech distortions).
The margin debt is nearly 2.5 times higher than it was at 2007 top and numerous bullish sentiment indicators are flashing an all time high.
In other words, everyone is long, strong and on margin at the highest valuation level in the stock market’s history. What can possibly go wrong?
We might have an answer.
If you would like to find our exactly what the stock market will do next, based on our mathematical and timing work, in both price and time, please Click Here
