2/6/2019 – A negative day with the Dow Jones down 21 points (-0.08%) and the Nasdaq down 26 points (-0.36%)
The stock market remains at an incredibly important juncture. Things are about to accelerate in an unexpected way. If you would like to find out what happens next, based on our timing and mathematical work, in both price and time, please Click Here.
I just realized that I never performed full analysis of our well defined December 26th, 2018 bottom. And since I have to do so for our “market calls” section anyway, today is as good as any other day.
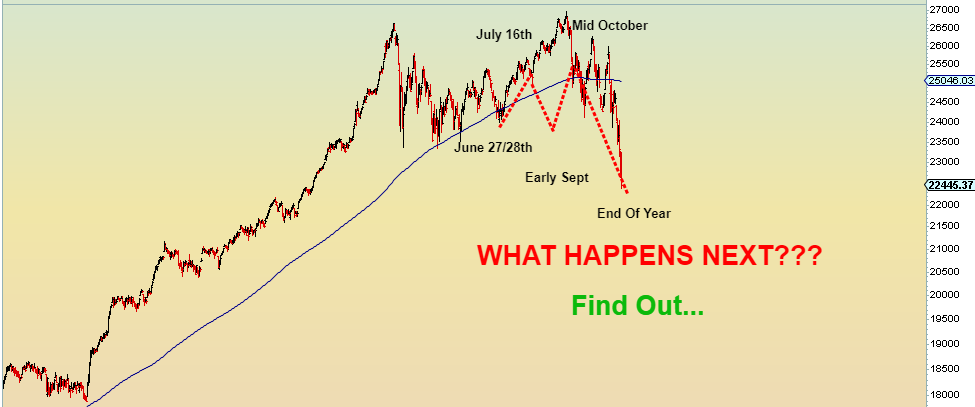
Our subscribers have been looking at the following chart since about June of 2018…..

In early June of 2018 we presented our subscribers with the following chart. At that time it was just a red dotted line you see above projecting upcoming stock market moves. June 27/28th bottom was a direct hit. The biggest discrepancy for the forecast above was our anticipated early September bottom. September 11th bottom ended up being much shallower than we originally anticipated.
The forecast was slightly adjusted in our weekly/daily updates with price/time calculations as we went along and an important top arrived on early October.
Not too bad for a forecast issued 6 months ago.
Leading into December low I issued the following warnings to our premium members.
December 8th Update: Market’s structural composition suggests the market will very quickly slice though both 24K and 23K on the Dow over the next 10 trading days. Once those major support levels are taken out, the Dow might very quickly collapse to 20K by the time our December TIME turning point arrives.
December 15th Update: The Dow did briefly break below 23K on Monday, followed by an ideal structural bounce discussed in our daily updates. It appears the bounce did conclude on Wednesday and that we are now in very early stages of Wave 3 down. A word of caution. These structural locations in the stock market are incredibly dangerous and/or violent.
As we came into December most traders/investors were anticipating a massive “Santa Rally”. Our work was projecting the exact opposite months ago and we made sure our subscribers knew.
Subsequently, as the market approached our December 27th (+/- 1 trading day) important TIME turning point, two mathematical points of force were identified on the Dow in our daily updates. One was located at about 20,750 and the other at 21,725 (+/- 50 points). A trade entry point and a plan of action were offered at the time for our 21,725 PRICE turning point.
Like clockwork, the Dow proceeded to bottom on December 26th at 21,713 and the rest, as they say, is history.
Not all of our market calls are as accurate as the one above has been. Yet, we do our best in an attempt to nail them all…..tops and bottoms.
If you would like to find out exactly what the stock market will do next, in both price and time, based on our timing and mathematical work, please Click Here.
Please Note: Our latest call was a direct hit. While everyone was panicking our work projected an important bottom on December 27th (+/- 1 trading day) on the Dow at 21,725 (+/- 50 points). An actual bottom was put in place on December 26th at 21,713.
