A negative week with the Dow Jones down 1,108 points (-4.18%) and the Nasdaq down 292 points (-3.75%)
For weeks we have been warning you that the market was about to move. Does this week qualify? If you would like to find out what the stock market will do next, in both price and time, based on our timing and mathematical work, please Click Here
Despite this week’s sell-off, bullish investors have never been more bullish. With BTFD crowd out in force Market Participants Freak Out: Buy The F$#@ing Dip Is The Mantra Of The Day
Now, I highly encourage you to watch the video below in full as it clearly reflects the state of today’s sentiment.
To quickly summarize if you don’t have the time: David Stockman, whom I regard as one of the best researched macro economists out there is quite literally dismissed, laughed at and pummeled by the bulls. One liners such as “you missed the rally, when did you sell, this time is different, you are a broken record with a bad track record, the earnings are surging, etc….” are used repeatedly.
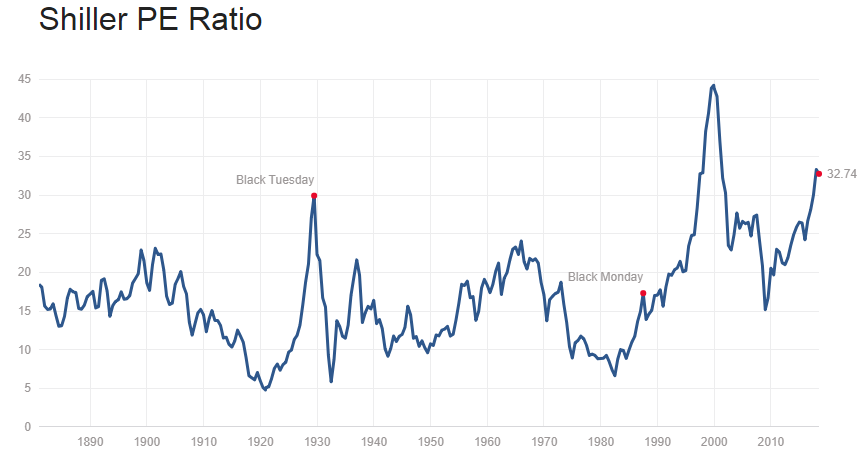
Now, these so called brilliant bullish investors keep talking about surging earnings and CHEAP forward P/E of 16. Making today’s market extremely cheap. I have two charts to show them.

![]()
I have beaten these charts to death over the last few months, so I won’t go into detail here. Simply put, numerous indicators such as the Buffett Indicator, Price/Sales, Shiller P/E (not forward junk), etc….all suggest that we are presently in the most expensive market in the history of humanity. Especially, if we make adjustments for lack of 2000 tech earnings.
Hence, the everything bubble of today.
That is to say, eager bulls should not be so quick to dismiss well researched bears or they might soon be re-learning the lessons of 2000 and 2007.
Luckily, you don’t have to guess as the fundamental practitioners above do. If you would like to find out exactly what the stock market will do next, in both price and time, please Click Here.
