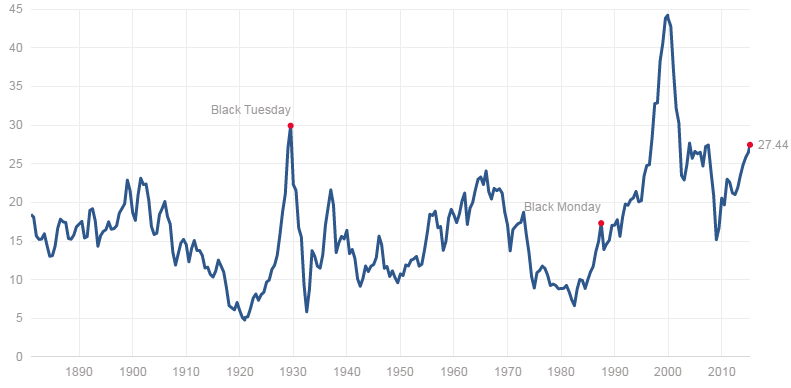
I have displayed the chart above on quite a few occasions before. It is an easy way to illustrate just how overvalued we are today. Consider this. The chart above suggests that the stock market has been more expensive on only two other occasions. Right before the 1929 crash and in 2000. We are now above 2007 overvaluation bubble levels.
Further, the S&P would have to fall over 50% from today’s levels just to revert back to its mean. And we are not even talking about overshooting to the downside.
With that in mind, this articles brings today’s “Overvaluation Premise” into question.
Are Grantham And Hussman Correct About S&P 500 Valuations?
To save you time, the author uses accounting tricks and today’s environment to bring up Shiller’s P/E ratio mean from 16.6 to today’s 27. Justifying today’s valuation levels in the process.
That is to say, the author uses “This Time Is Different” premise to make his argument.
Is it?
It never is. Listen, you can argue all of sort of things through the use of mathematics and statistics. For instance, you can even argue that most of the stocks today deserve infinite valuations because interest rates are at zero.
Plus, I can’t tell you how many times I have heard the same argument and its application to the housing and stock valuations right before the 2007 top. At the end of the day, you have to decide who is right here. This time is different or over 200 years of financial data. I will leave that decision up to you.

One Reply to “Is Our Overvaluation Premise Wrong?”
Comments are closed.