If you would like to find out what the stock market will do next, in both price and time, short-term and/or long-term, please Click Here
If you would like to find out what the stock market will do next, in both price and time, short-term and/or long-term, please Click Here

1/12/2024 – A mixed day with the Dow Jones down 118 points (-0.31%) and the Nasdaq up 3 points (+0.02%)
Why?
Because the market will force them to.
I found this article to be of interest No Smoking Gun Yet To Justify Magnitude Of Fed Rate-Cuts
Keep raising rates….are you out of your mind? Yes and No!!!
Earlier in the day we updated our mathematical Time/Price 10-Year Note (TNX) Forecast You Won’t Believe What Interest Rates Will Do Next
In that forecast, while we do not share exact Time/Price targeting data, we do suggest that TNX hasn’t topped yet or that October’s high was not the final high. In other words, another leg higher is expected.
Here is the thing. The FED tends to follow the market and not lead it. Particularly the short end of the curve. Over the years I have presented a mountain of evidence to support this notion.
Meaning, if our overall TNX calculations are correct, and I have no reason to doubt them, interest rates are about to surge higher one more time. And if so, the FED will follow.
And that, ladies and gentlemen, should get very interesting.
Having said that, if you would like to find out what the stock market will do next, in both price and time, please Click Here.

Our latest 10 Year Note analysis was just posted and you won’t believe what happens next. Let’s just say Bill Ackman might have covered his position too soon.
10- Year Treasury Index (TNX) – UPDATE
Date: January 9th, 2024
Our mathematical and timing work for TNX suggests the following:
In summary, our price and time calculations suggest the top for TNX is not yet in. It is scheduled to arrive in XXXX of 2024 and top out at around XXXX. Then be cut in half by XXXX 2025. This is consistent with our overall stock market forecast.
IF YOU WOULD LIKE TO FIND OUT EXACT TIME AND PRICE PARAMETERS ABOVE -PLEASE CLICK HERE
Hell must be getting cold as even lifelong Liberals at the top of their food chain are beginning to understand what is happening. Took them long enough. This is a must watch interview with Bret Weinstein. Full interview can be viewed here The Tucker Carlson Encounter: Bret Weinstein
Click Here To Find Out What The Stock Market Will Do Next In Both Price & Time

Our daily report for the Dow Jones Intraday analysis has been posted. To see it, please Click Here.
If you would like to find out what the stock market will do next, in both price and time, short-term and/or long-term, please Click Here

As you know, we run a complex set of multi-dimensional calculations in order to identify upcoming turning points in the market.
For instance, the chart above takes prior mid-term moves, calculates them and then projects upcoming turning point into the future. Represented by the red dots above. The trick is to know which one is the actual turning point.
That is done by converging various TIME turning points with geometric composition of the market. That gives us the final answer.
So, which dot above is the final top – if any?
If you would like to find out, please Click Here

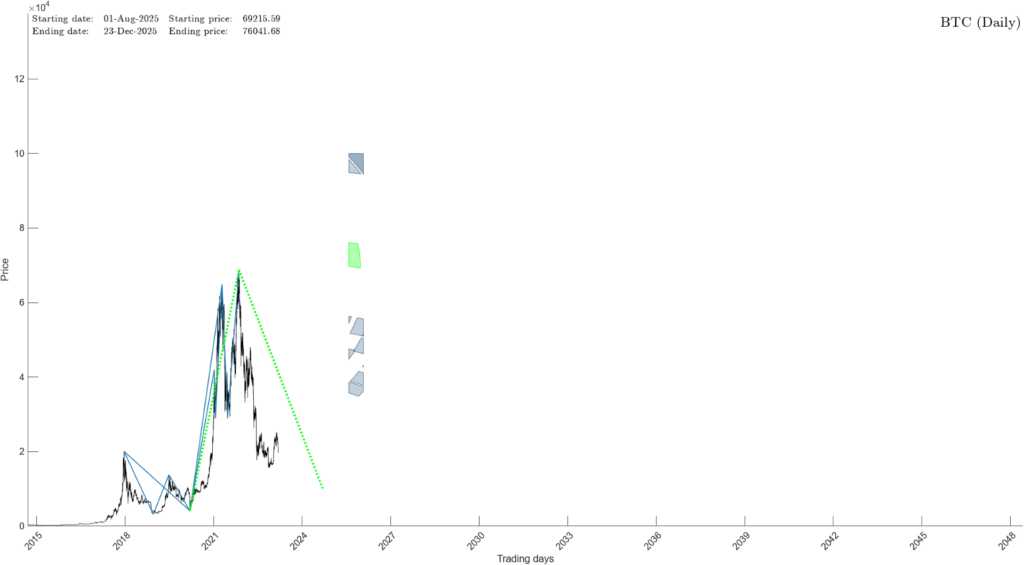
Here we go again………….to the moon !!!
Bitcoin could hit $80,000 by year-end, says this prominent asset manager
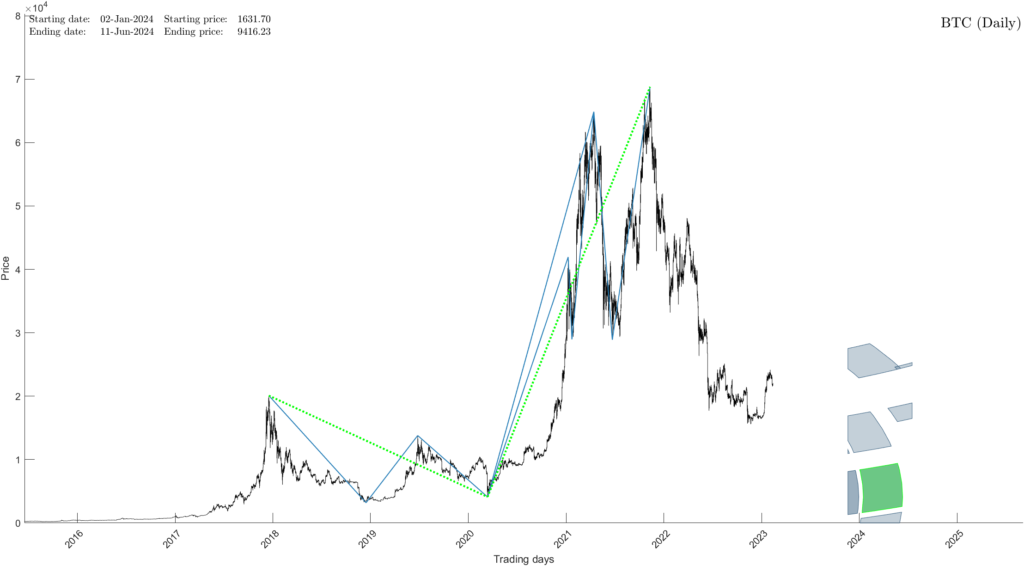
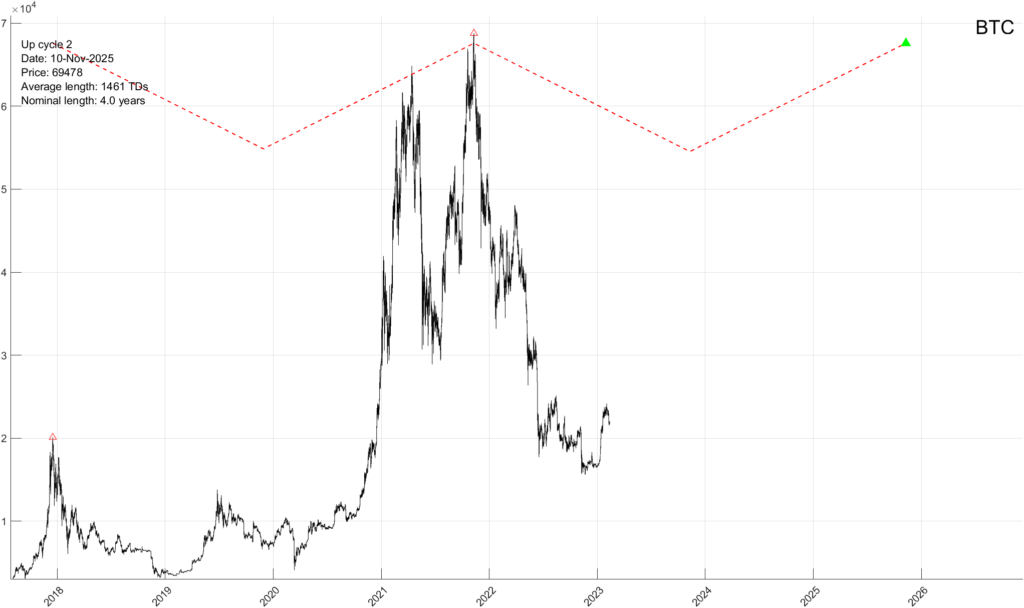
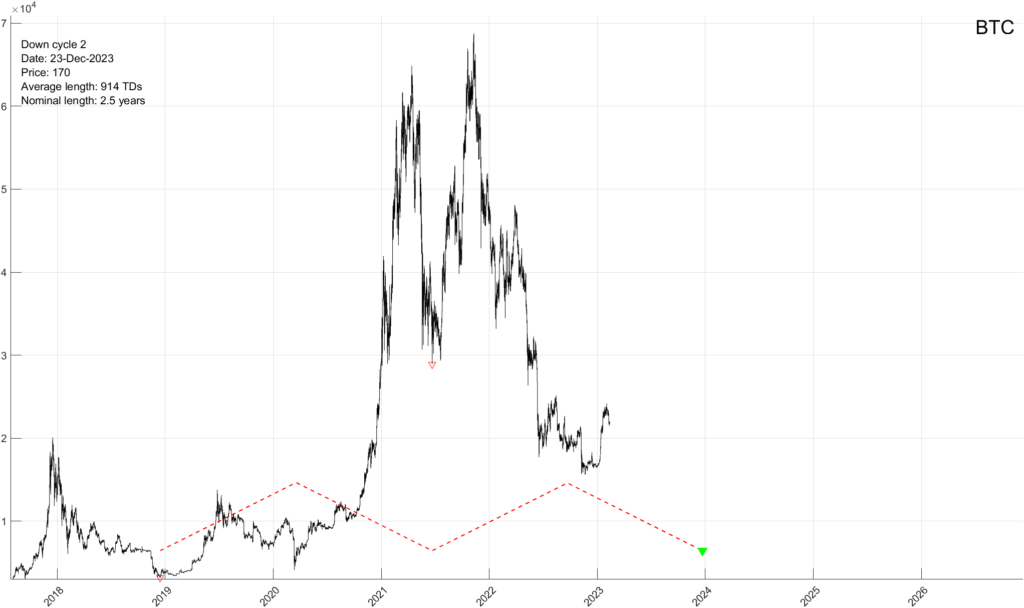
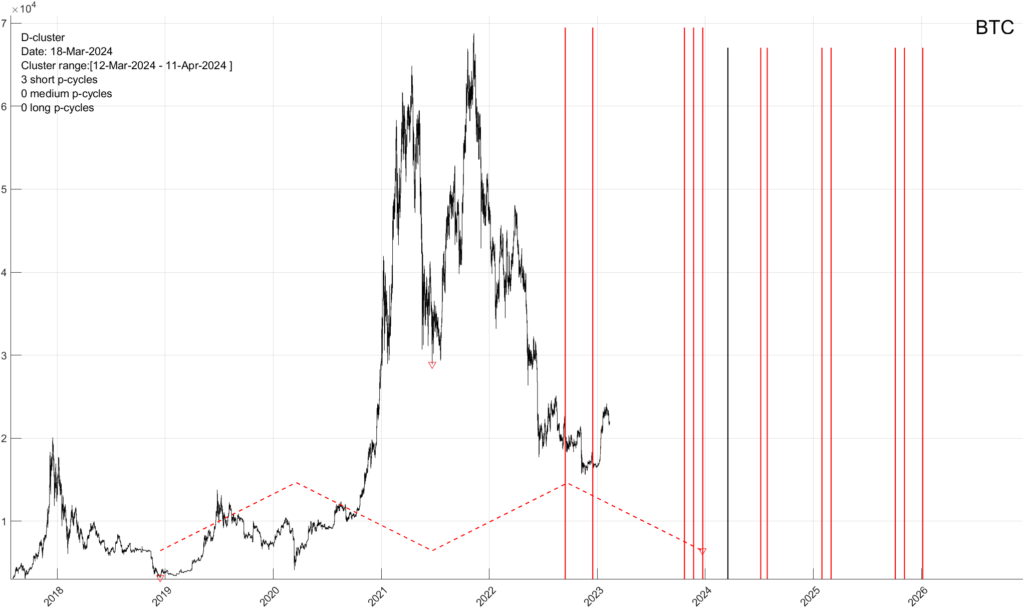
In early January of 2023 we confirmed Bitcoin’s November of 2022 bottom as a longer-term precise mathematical bottom and have suggested at the time that Bitcoin will run up to above $30K. No one believed us at the time – what else is new.
It appears now that the proverbial Bitcoin bulls are coming back from the dead, their outlandish predictions are once again gaining steam. Not so fast….here is our latest Bitcoin (BTC) update……
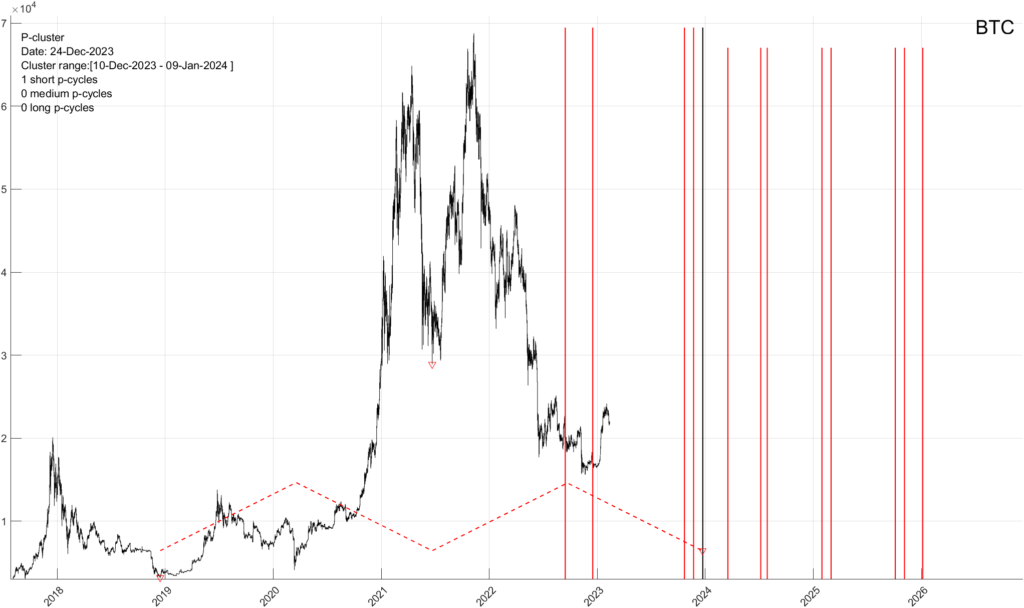
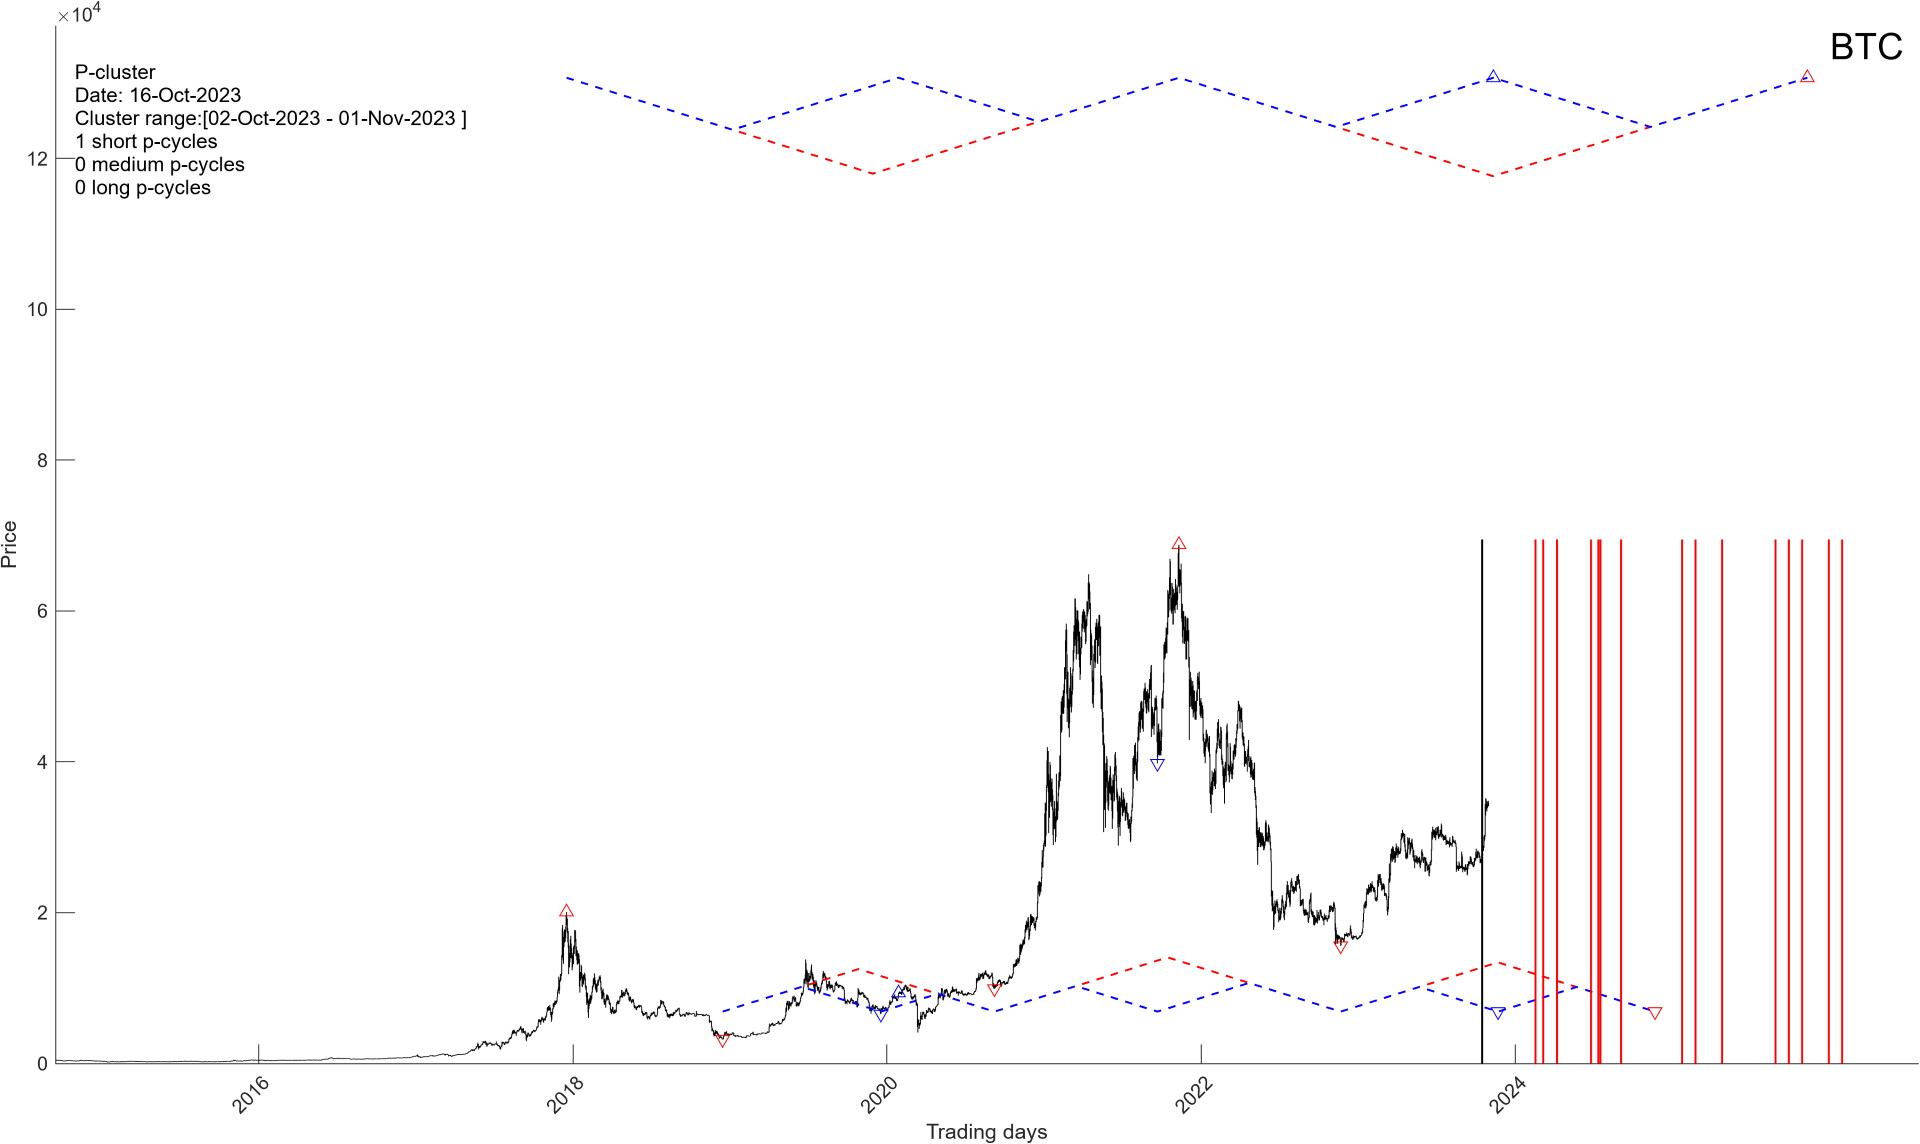
BITCOIN (BTC)
Date of Analysis: October 30th, 2023
Our mathematical and timing analysis for Bitcoin shows the following…….
In summary, expect a range bound Bitcoin until a major bottom arrives around XXXX of 20XX. Then a powerful move higher to a new all time high. A more exact targeting analysis will be available as we approach the junctures above.
If you would like to see our exact TIME & PRICE targets for Bitcoin’s (BTC) major bottom, as well as our precise turning point “targeting analysis” , please CLICK HERE