
Click Here To Find Out What The Stock Market Will Do Next In Both Price & Time
 We are posting this entire AT&T (T) analysis in a free forum because we found the stock to be rather uninspiring going forward. Having said that, if you would like to see our other MegaCap stocks and their precise Time/Price projections, please Click Here
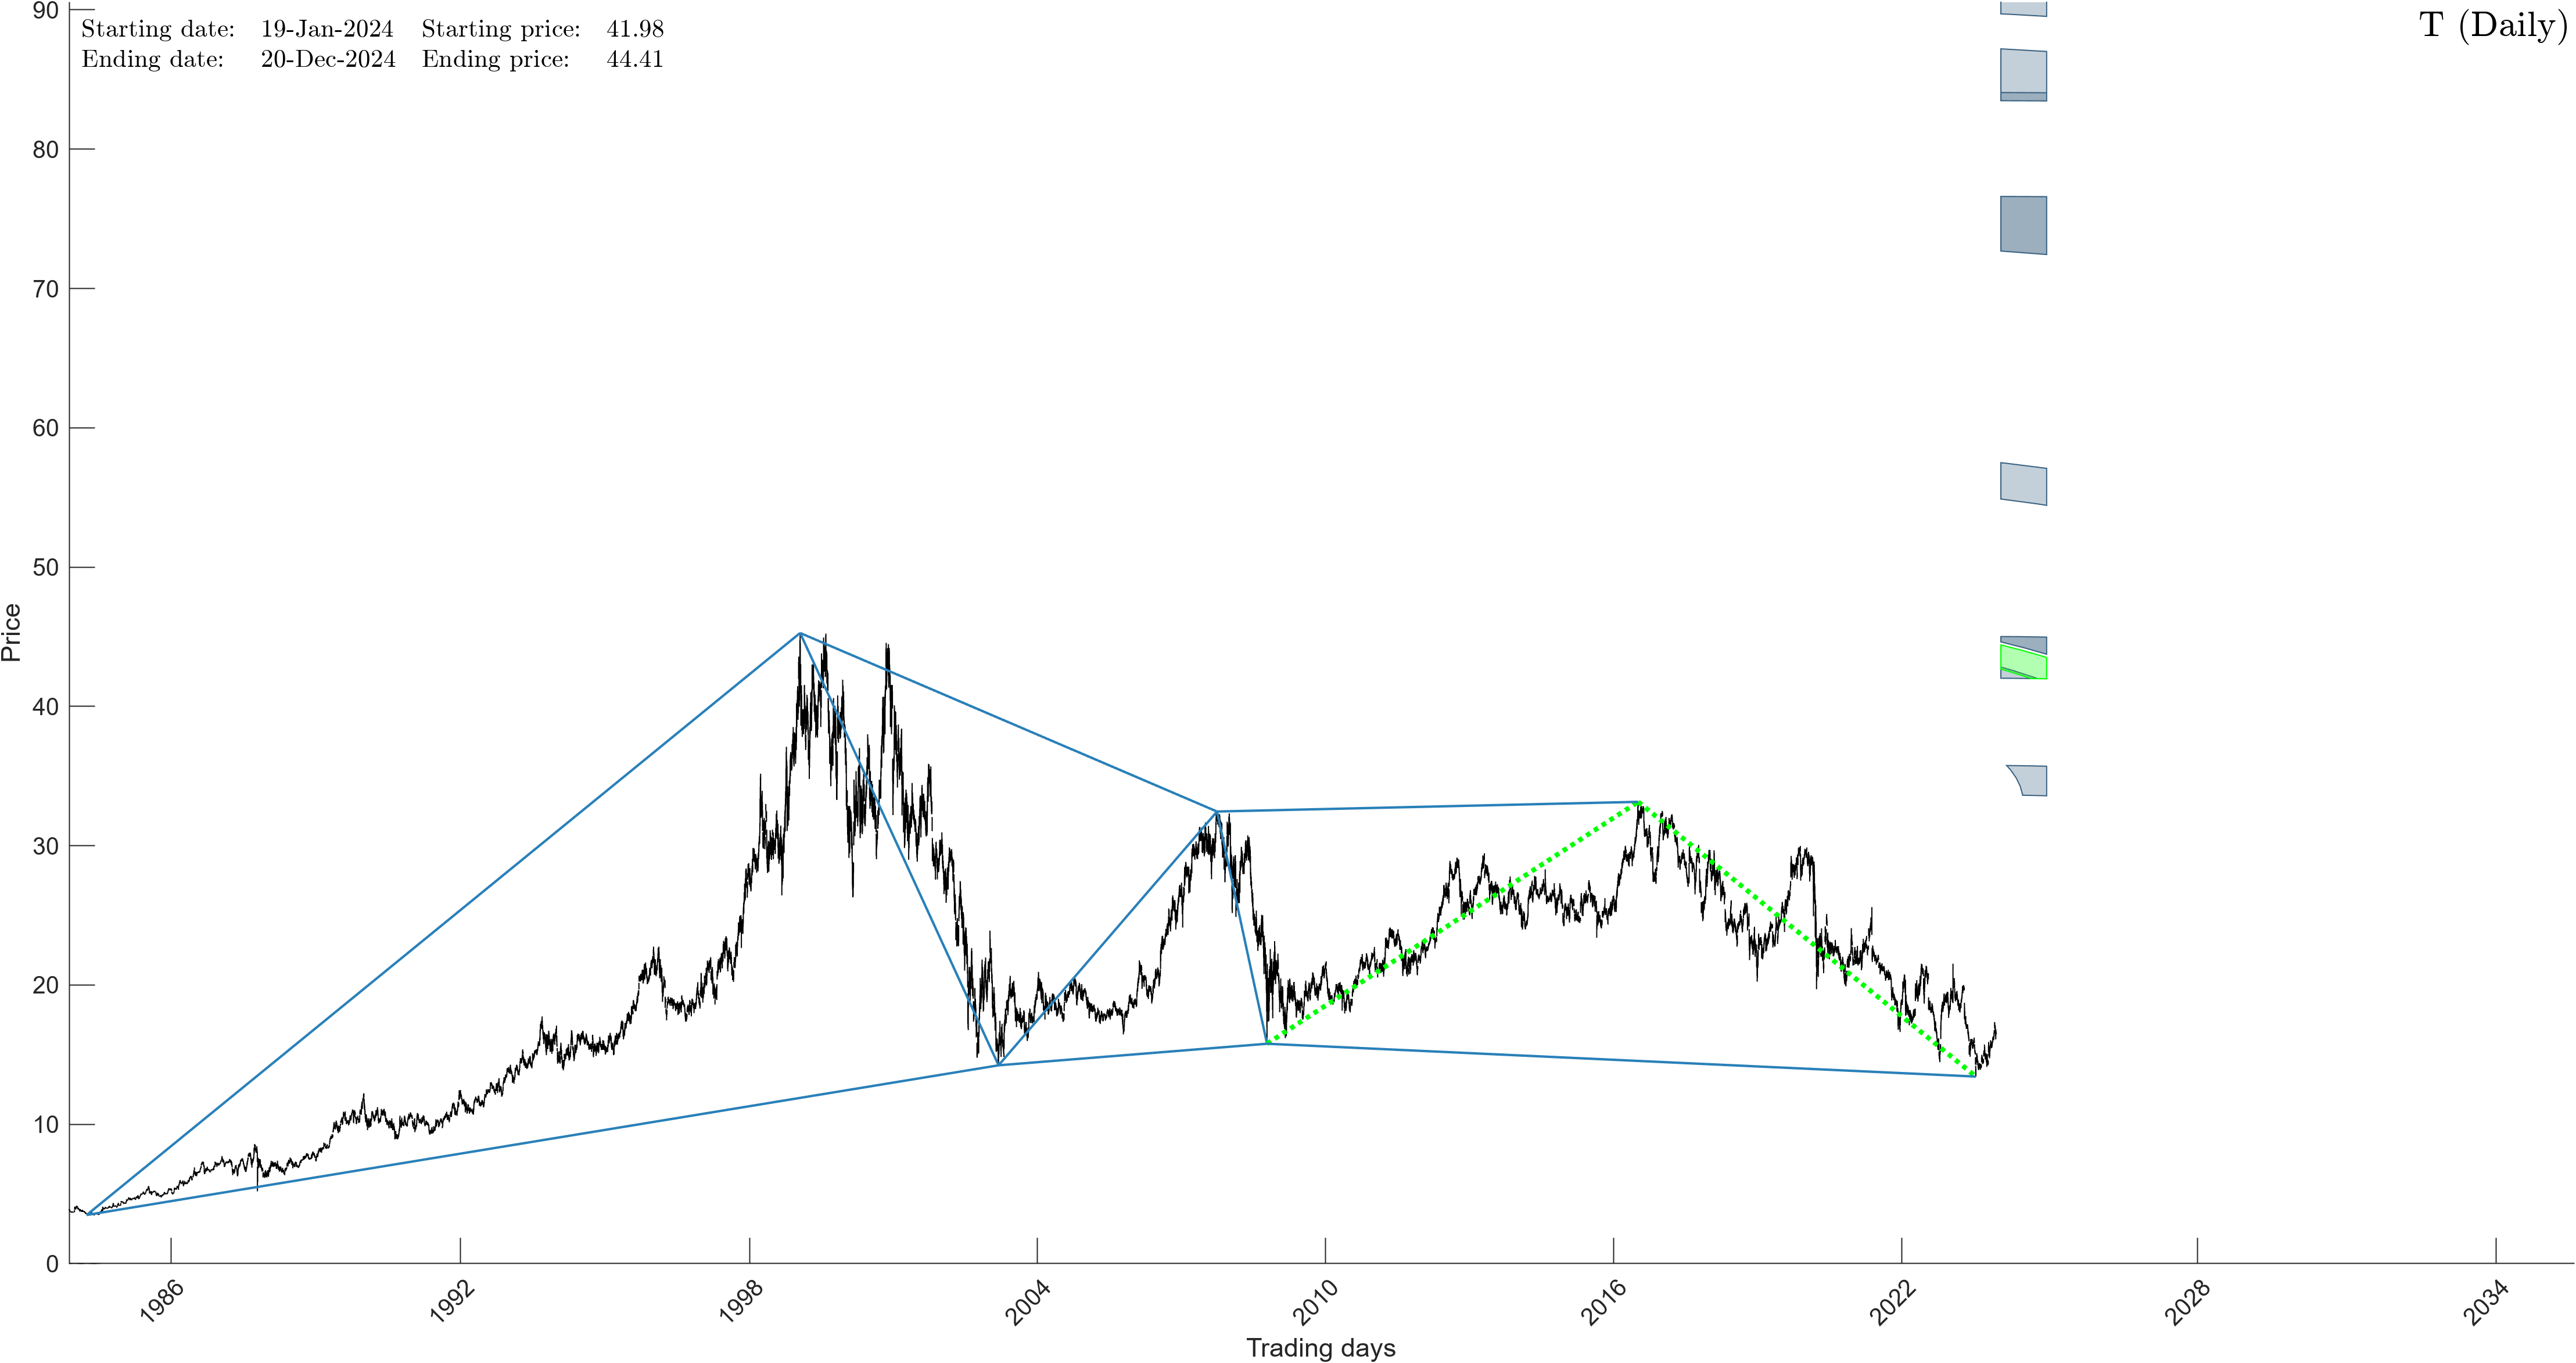
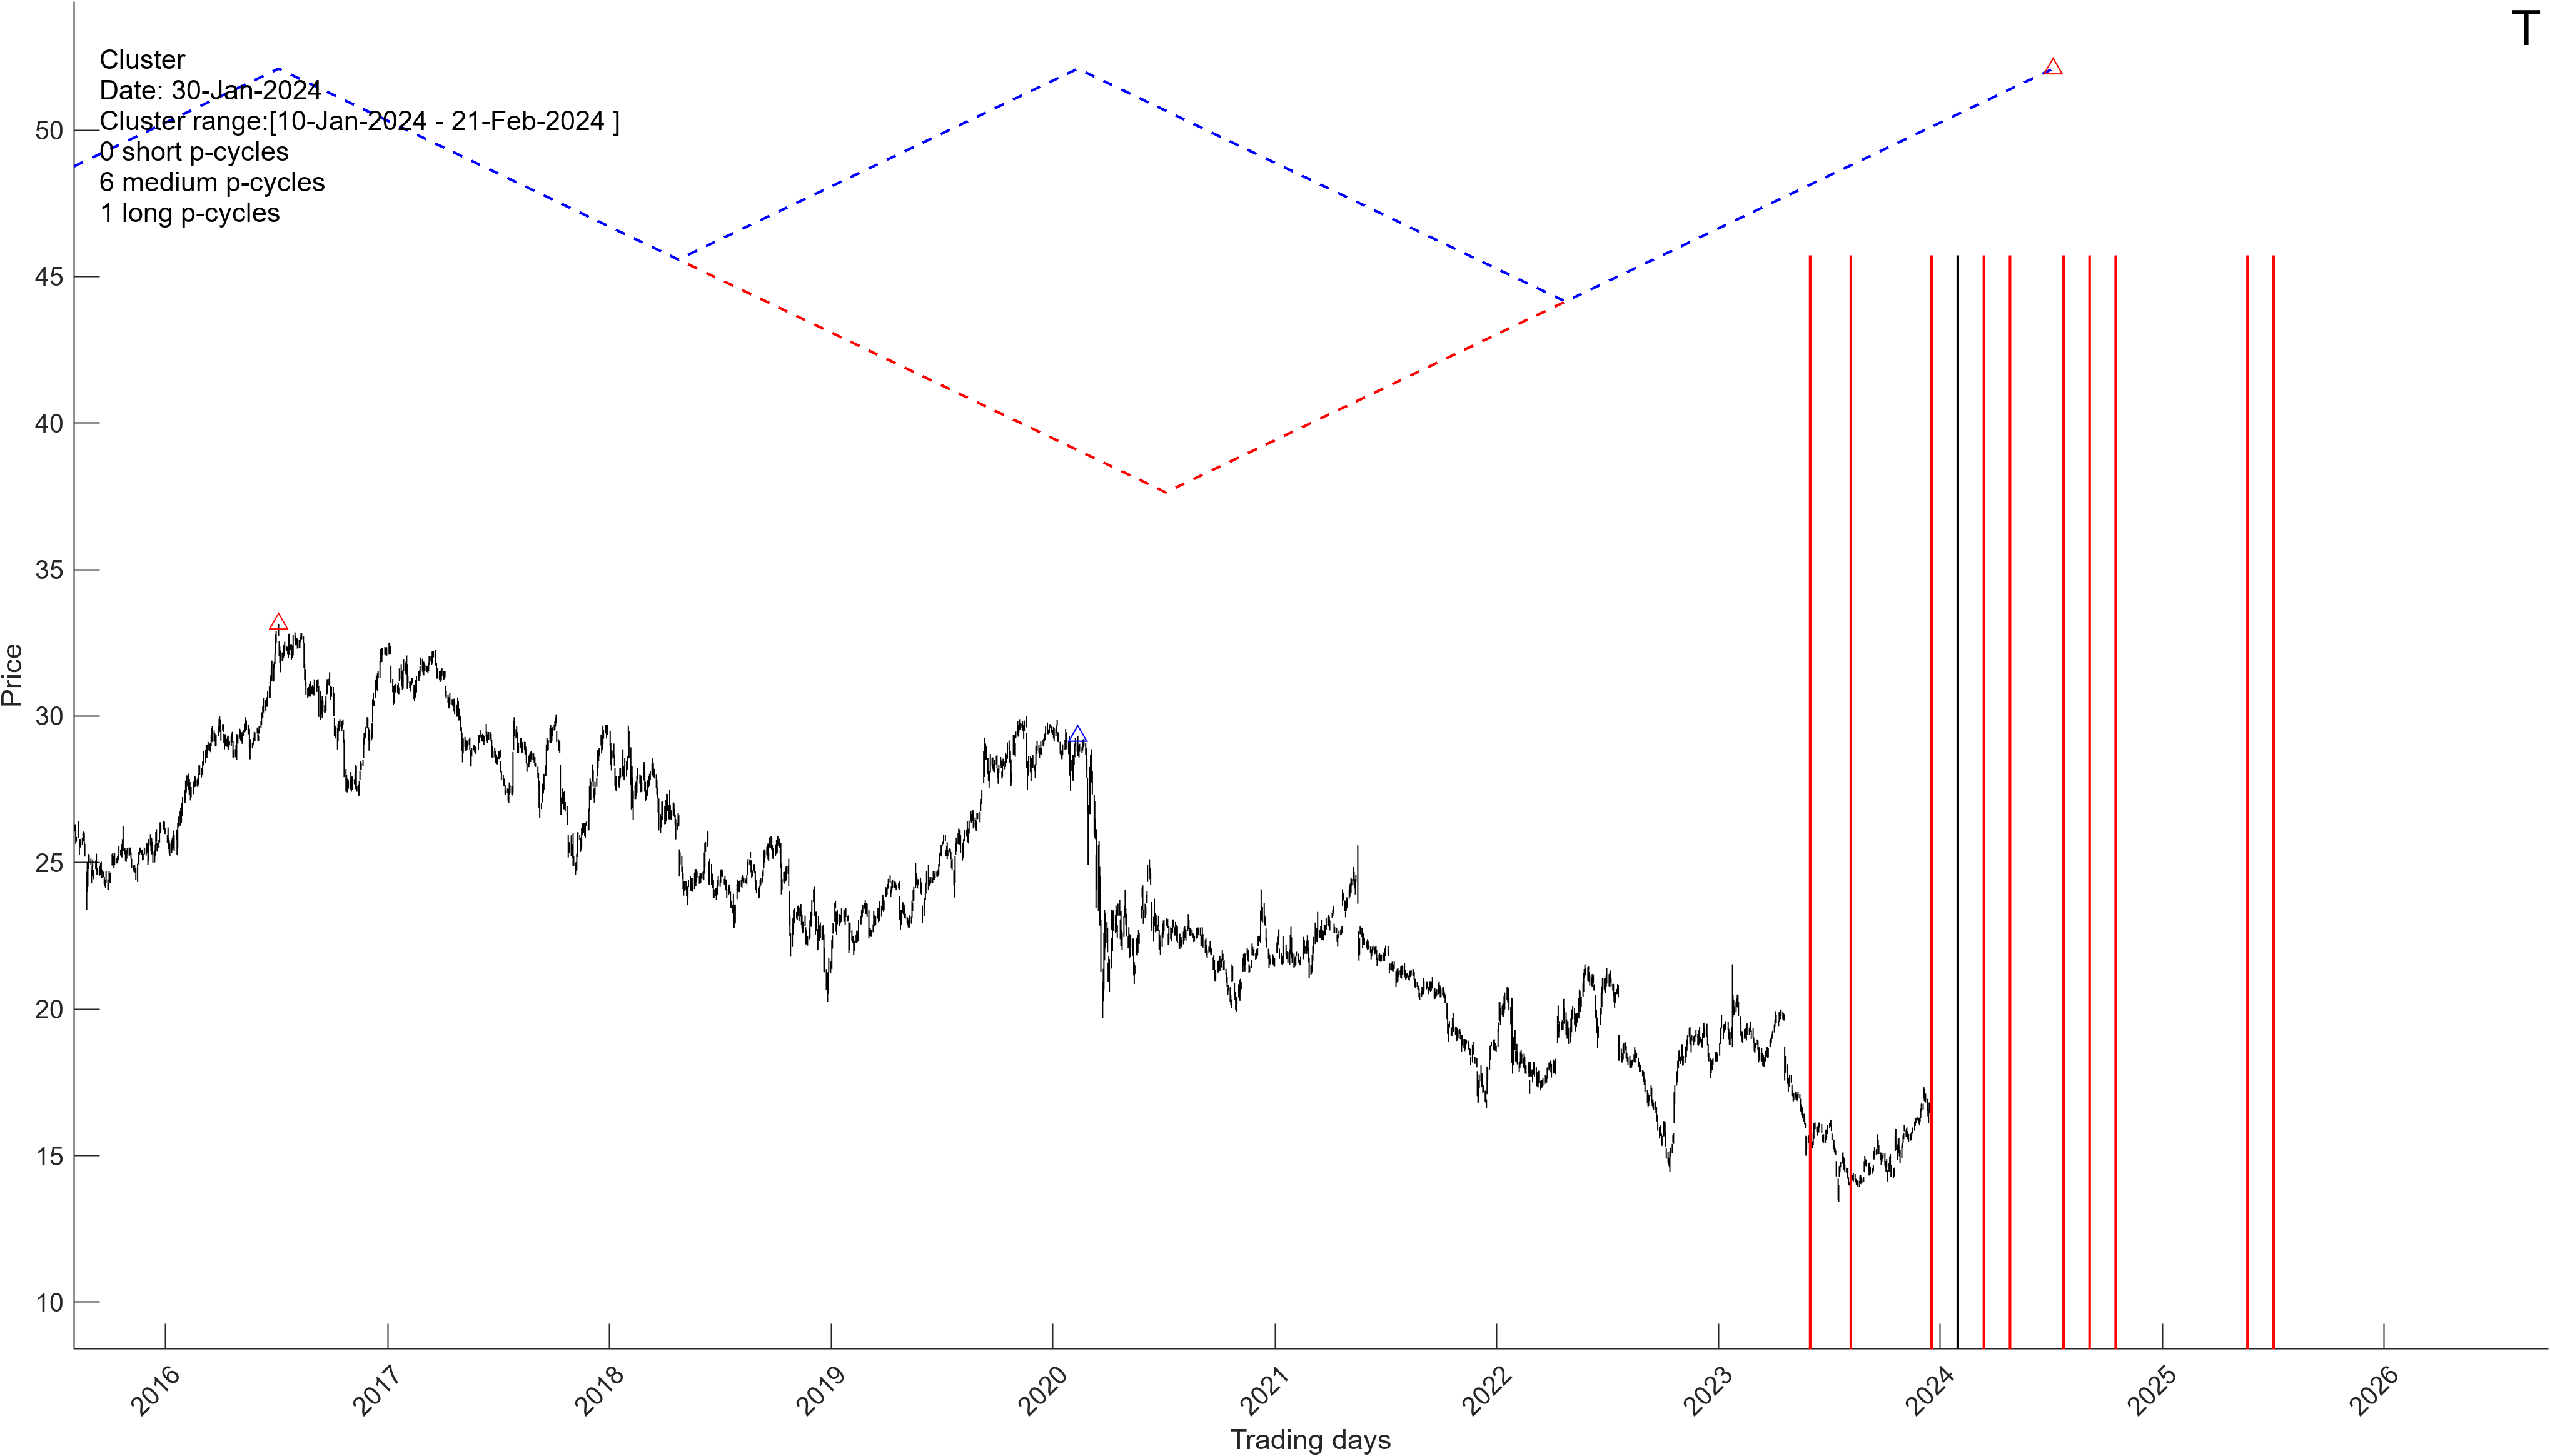
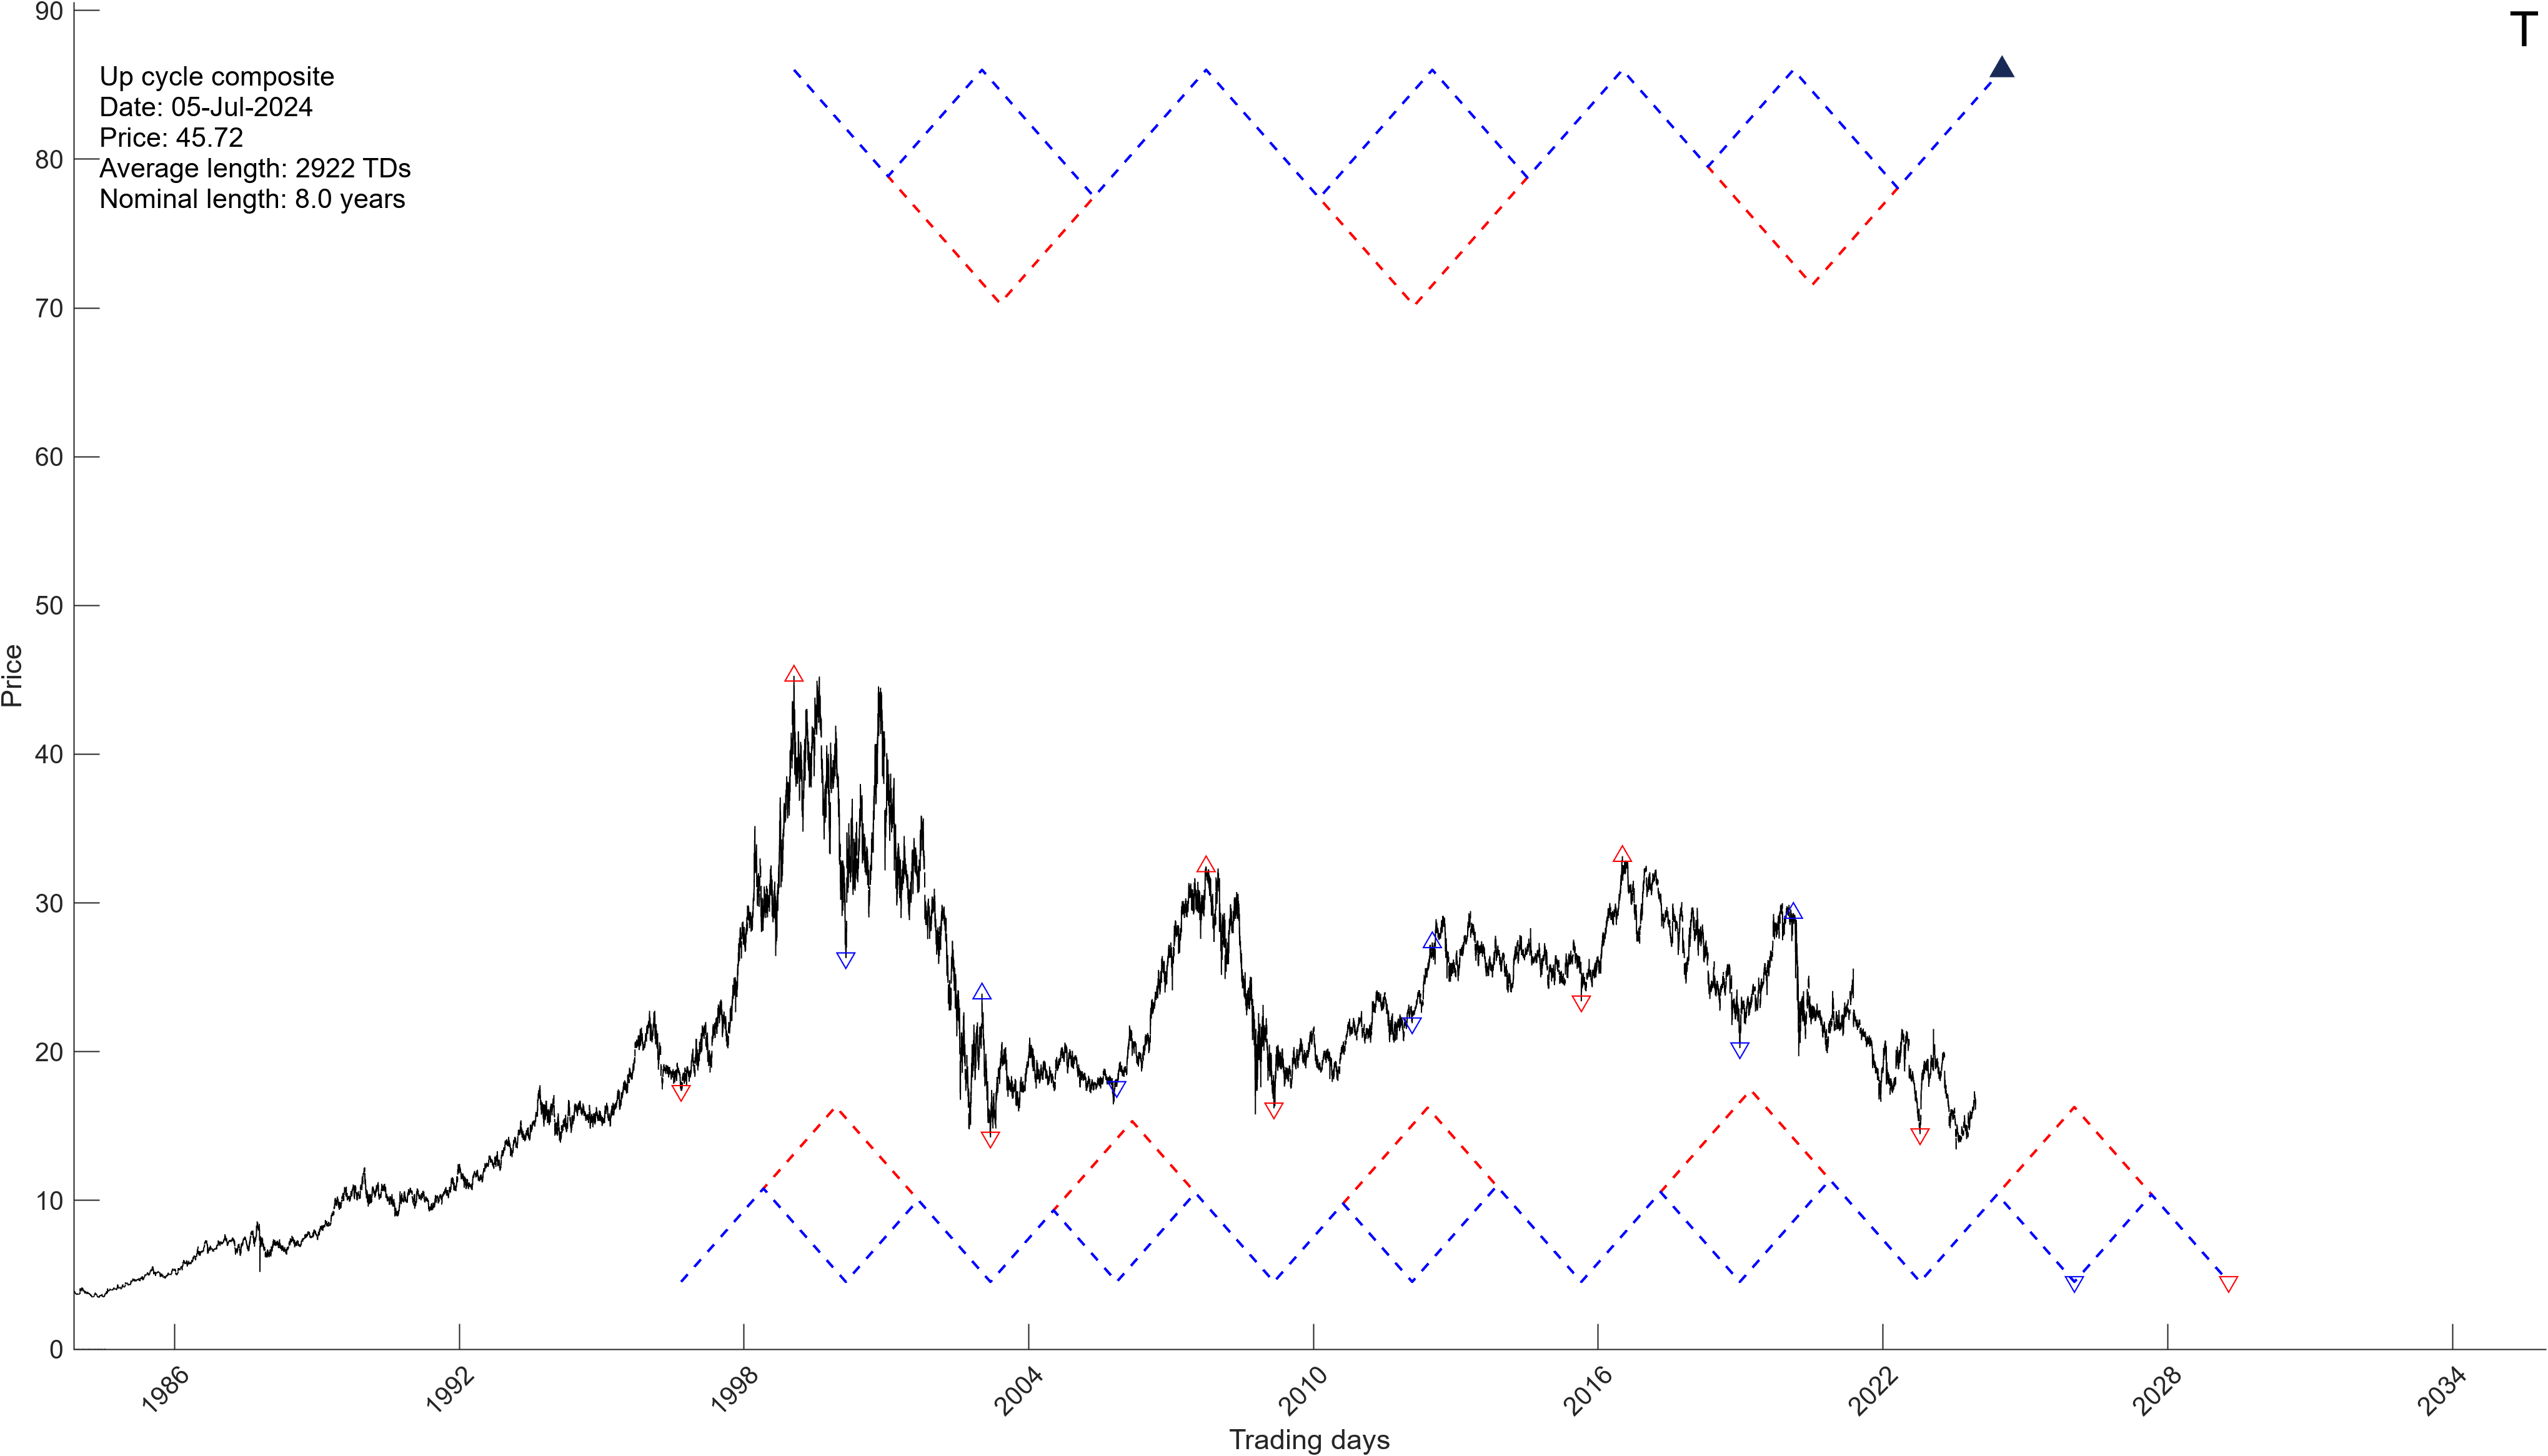
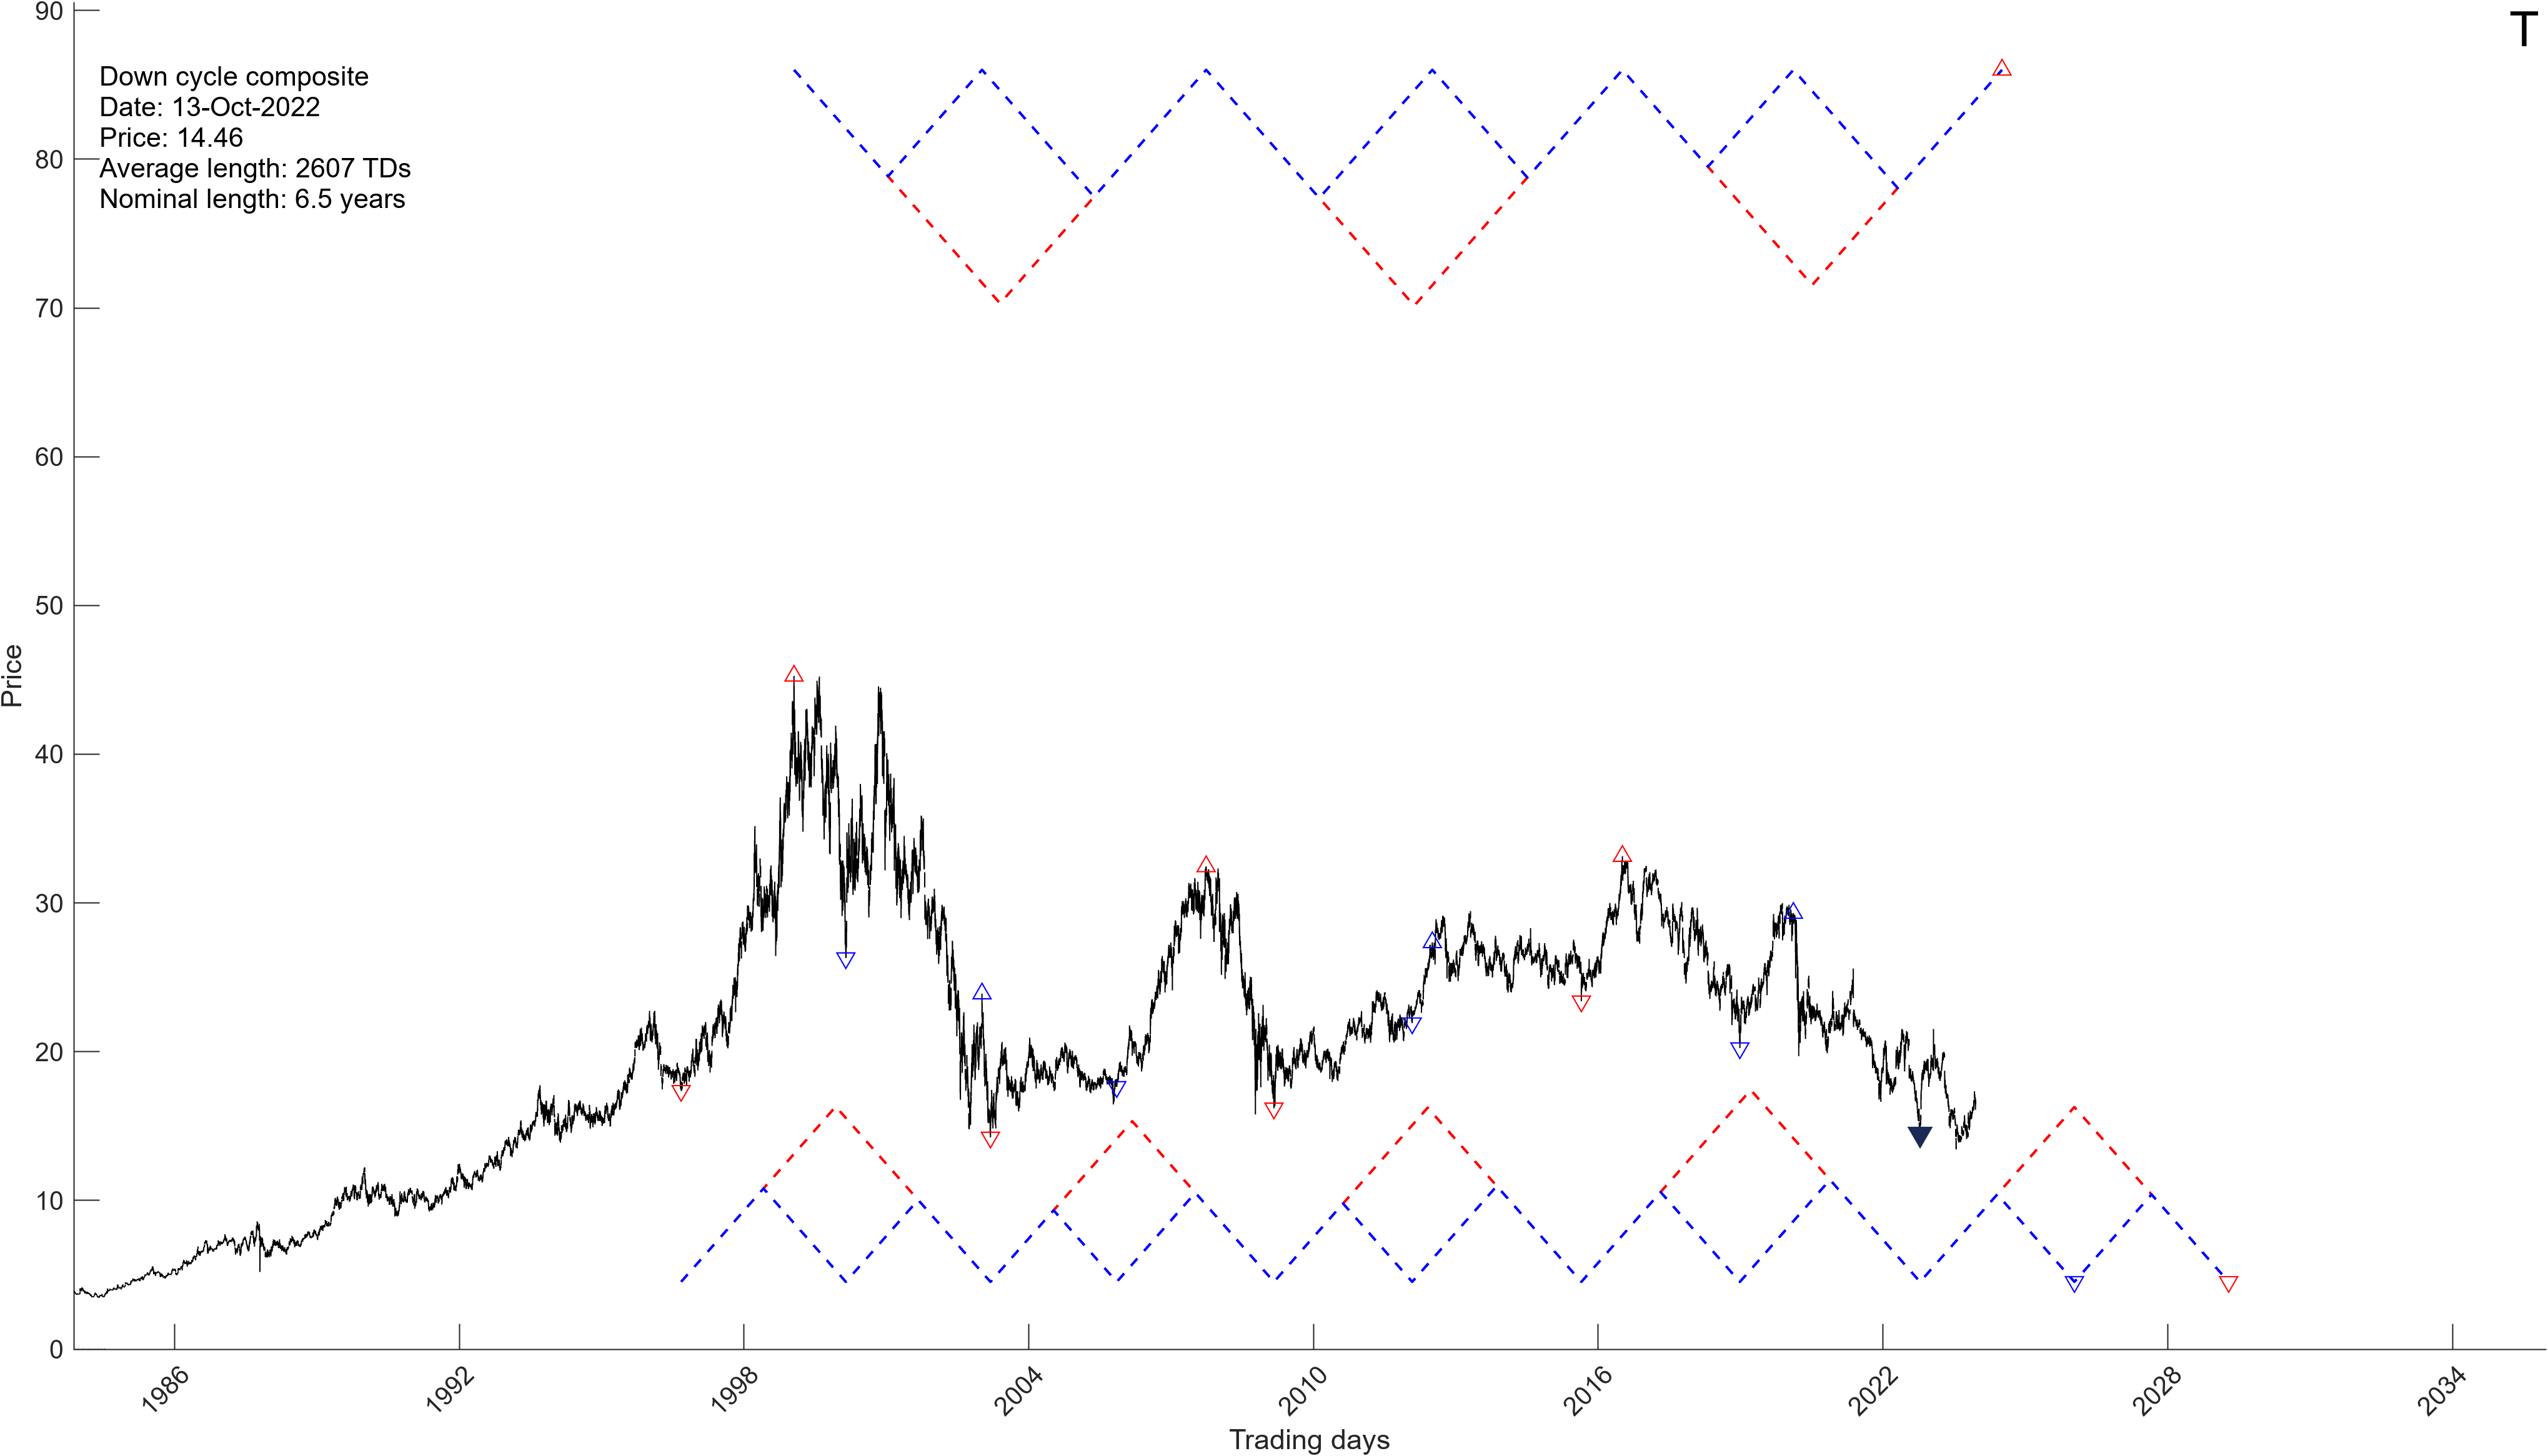
AT&T (T)
Date Of Analysis: December 19th, 2023
Our mathematical and timing analysis for AT&T (T) shows the following…..
In summary, AT&T offers very little in terms of a good trading opportunity at this time. Further, we found a number of interference patterns that render this stock a bit “unclear”. And while the stock is scheduled to rally, we would wait for the top to arrive before making any commitments.

12/18/2023 – A positive day with the Dow Jones up 1 point (+0.01%) and the Nasdaq up 90 points (+0.61%)
It is rather entertaining, but today’s top on the NDX has matched its January of 2022 counterpart to the point. No breakout yet. Having said that, it is a little beside the point. As we have mentioned before, we now have numerous confirmation that both the NDX/SPX will see their respective all time highs.
The Dow pushed slightly above its Intraday short-term point of force discussed in our Intraday analysis. Although, it remains within the margin of error and cannot yet be fully dismissed. Meaning, while it is possible we get a pullback here, that possibility has greatly diminished short-term since we have pushed slightly above this short-term point of force. If we push higher tomorrow, this will be confirmed and the rally will continue.
No other changes to our longer-term weekly and prior daily updates.
Now, I found the following article of great interest…….
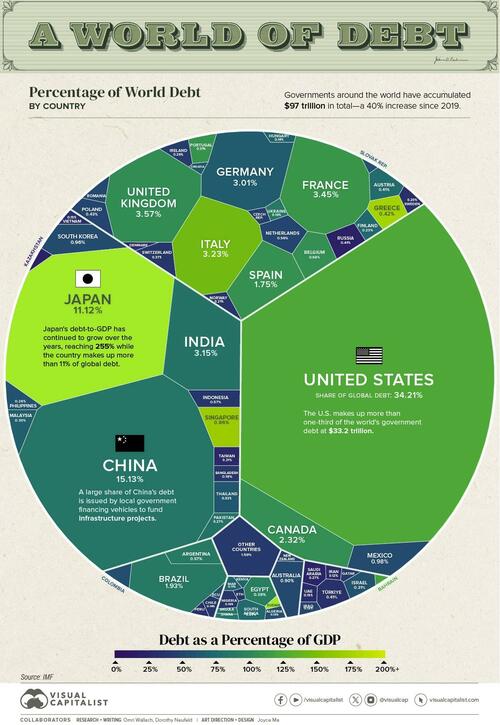
Visualizing $97 Trillion Of Global Debt In 2023
| Country | Gross Debt (B) | % of World Total | Debt to GDP |
|---|---|---|---|
| 🇺🇸 U.S. | $33,228.9 | 34.2% | 123.3% |
| 🇨🇳 China | $14,691.7 | 15.1% | 83.0% |
| 🇯🇵 Japan | $10,797.2 | 11.1% | 255.2% |
| 🇬🇧 UK | $3,468.7 | 3.6% | 104.1% |
| 🇫🇷 France | $3,353.9 | 3.5% | 110.0% |
| 🇮🇹 Italy | $3,141.4 | 3.2% | 143.7% |
| 🇮🇳 India | $3,056.7 | 3.1% | 81.9% |
| 🇩🇪 Germany | $2,919.3 | 3.0% | 65.9% |
| 🇨🇦 Canada | $2,253.3 | 2.3% | 106.4% |
| 🇧🇷 Brazil | $1,873.7 | 1.9% | 88.1% |
| 🇪🇸 Spain | $1,697.5 | 1.7% | 107.3% |
I found the above of interest in terms of the US Dollar. Quite a few market participants believe the US Dollar is not worth the paper it is printed on and will soon crash. As accurate as that opinion might be, it flies in the face of our DXY forecast – at least for now.
What the above data shows is that all major economies are stuck in the same boat and that other currencies are arguably “just as bad”. In other words, the US Dollar cannot crash against other currencies that are suffering from the same problem. And once again – YET.
Our DXY forecast is rather unique in that sense and shows USD movements going forward that no one is anticipating. If you would like to see that forecast, please Click Here and select our MegaCap Section.

Our daily report for the Dow Jones Intraday analysis has been posted. To see it, please Click Here and find out what the stock market will do next.

A positive day with the Dow Jones up 56 points (0.15%) and the Nasdaq up 52 points (+0.35%)
It appears most investors and professional money managers are quite confused about what’s going on with the overall stock market.
Wasn’t it supposed to crash in November?
With some going as far as coming up with some outlandish theories or cause and effect propositions in an attempt to explain or predict what the stock market will do next.
Case and point, this beauty from ZeroHedge….
Will The Fed’s Coming Rate Cuts Lead To Higher Stock Prices? It Depends On Just One Thing
Will the US economy be in a recession in 2025, and by extension will Trump be president.
So, blame the Orange Man. And while at it why not blame Putin for this “crazy” market environment.
In reality, the stock market is doing exactly what it should be doing. At least according to our timing and mathematical work. In mid 2022 our mathematical calculations yielded the following projection.
“The stock market will bottom on October 10th, 2022 (+/- 2 trading days) and then run up to an all-time high, breaking above January 2022 top in 2023.”
The actual bottom arrived in the first 30 minutes of trading in October 13th and the rest, as they say, is history.
In our opinion or based on our calculations what the stock market will do next is crystal clear and quite interesting. And it has nothing to do with interest rates. Well, it kind of does or at least there has been a historic correlation.
Was the FED cutting or raising rates in 2000-2002 and 2007-2009. Cutting – right!!! Point being, just because the stock market has apparently survived this interest rate rising cycle, doesn’t mean the stocks are ready to run higher. In fact, quite the opposite is true.
Our mathematical and timing work confirms this conclusion. If you would like to find out exactly where and where the stock market tops out, and what happens next, please Click Here
Chart below represents mid-term calculations for the Dow Jones. Red dots represent all possible mathematical points of force associates with this time frame. In other words, red dots represent all possible mid-term turning points over the next 5 trading days. Recall, the stock market must hit one of these points before any sort of a legitimate top can develop.
As a result, the overall setup is fairly easy. Click here to find out what the stock market will do next.

If you would like to find out what the stock market will do next, please Click Here
Over the years we have been able to figure out a way of identifying Fast Moving stocks. These are stocks that are about to stage powerful directional moves of 50%+ within a compressed time window of 12 months or less. To learn more about our fast movers and the math behind it, please Click Here
Charts below represent our latest find. If you recognize the charts, great. The stock in question is about to bottom and then proceed to surge 200% + over the next 10-12 months.
If you would like to obtain the exact time/price target for this upcoming bottom as well as our trading parameters, please Click Here.


If you would like to find out what the stock market will do next in both price and time, long-term and short-term, please Click Here. You can also find our MegaCap Stocks Time/Price Projections and our Fast Movers at the same link.


