
We have re-started our short-term Dow Jones service projecting short-term moves in the overall stock market. Here is a SAMPLE REPORT minus our analytical conclusion and trading recommendation. To gain full access, please Click Here
We have re-started our short-term Dow Jones service projecting short-term moves in the overall stock market. Here is a SAMPLE REPORT minus our analytical conclusion and trading recommendation. To gain full access, please Click Here
Summary: We have figured out a way to identify markets, individual equities, commodities, currencies, etc…. that are about to stage powerful directional moves of 50%+ within a compressed time window of 12 months or less. Here’s how…..
Over the years, as our work progressed, we have noticed something of significant importance. We have noticed that large directional moves in underlying equities or markets typically happen when there is a short period of TIME between a major cycle top or bottom and its subsequent upcoming bottom or top.
In other words, powerful directional moves typically happen between these two important points of force. Our work is able to identify these points and then project when any underlying security will make a powerful move up or down. Typically within a compressed period of time of 12 months or less.
Crude Light (CL) chart below is a perfect illustration of that in 2008, recent March of 2020 low and to a lesser extend in 2016. For instance, there was a major cyclical top in CL in July of 2008 and a major bottom arriving in March of 2009. It would have been reasonable to assume that a major move down would take place during this period of time. And it did.

Our software is able to scan all financial instruments and identify stocks or markets where such periods of volatility are coming up in the near future. We can then use the rest of our mathematical and timing calculations to confirm the move and its directional extent.
How does it work?
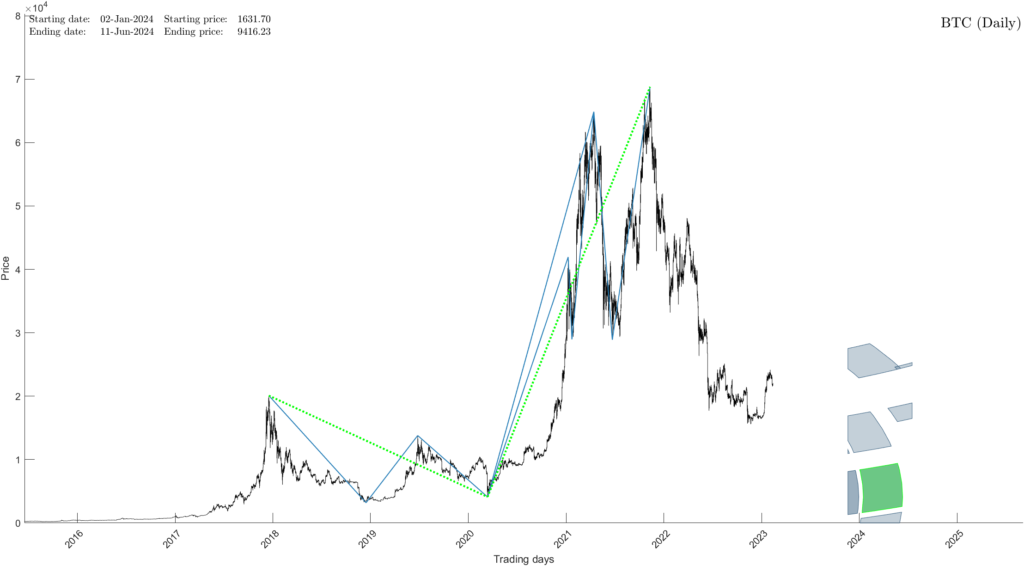
Please see our “fast mover” identifier below. We can load any number of stocks into it, identify parameters we are looking for and let it run. The RED stocks are identified as stocks of interest or possible fast movers. We can then open each one individually and determine if the identified stocks need further analysis or not.

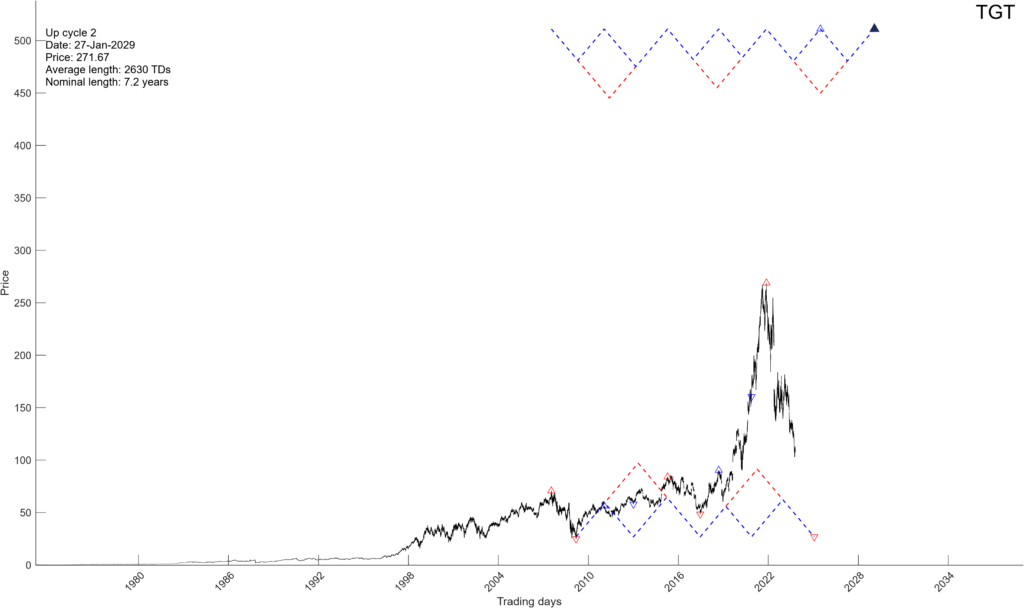
For example, the stock below has been identified as a potential upcoming “fast mover”. Not only does it have a prior occurrence of such a move (confirmation), it is clearly projecting that such a move is about to develop again.

We then use the rest of our analytical tools and mathematical calculations to confirm that a fast move in this underlying equity is indeed coming. In that regard we have been able to identify the exact location of the top, in both price and time, and the subsequent extent of the upcoming decline.
For example, the following trading parameter can be set in motion (hypothetical example).
Top projection $82 (+/- 1) to be hit on July 14th, 2023 (+/- 1 trading day). Projected bottom, March 2024 at $34 (+/- $2). Short entry at $81 if price lines up with time – stop loss at $83.50. The spread can be narrowed down with short-term work/calculations. Projected return over the next 12 months 50%+, risk is at about 3%.
As you very well understand, this is a game changer.
To very quickly summarize, our calculations give us an ability to identify equities that are about to stage powerful directional moves of 50%+ and do so within a compressed time window of 12 months or less. That in turn minimizes risk by allowing us to take risk averse positions with clear trading parameters (tight stop losses). Huge upside potential is self evident.
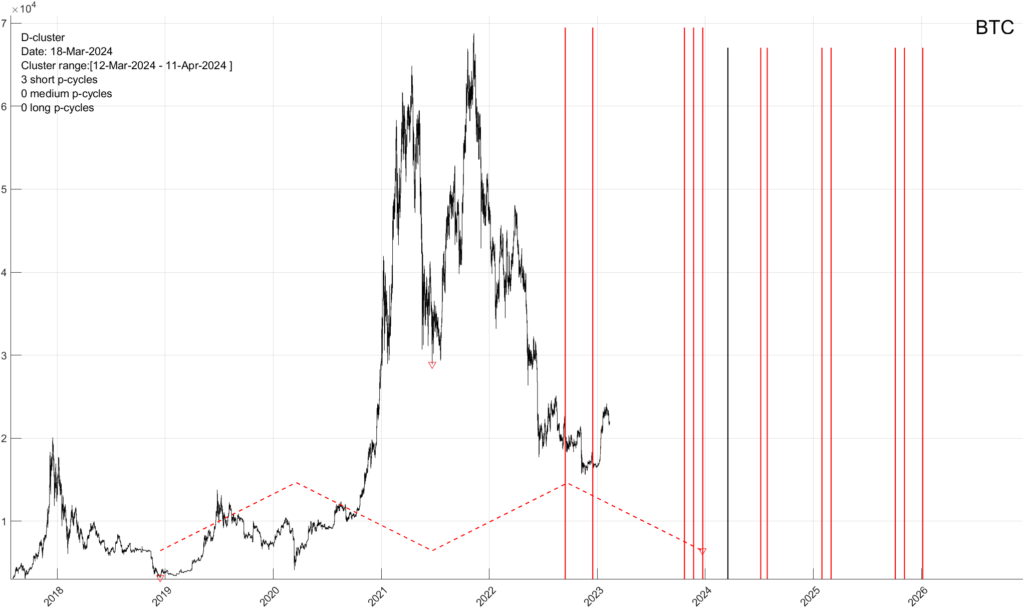
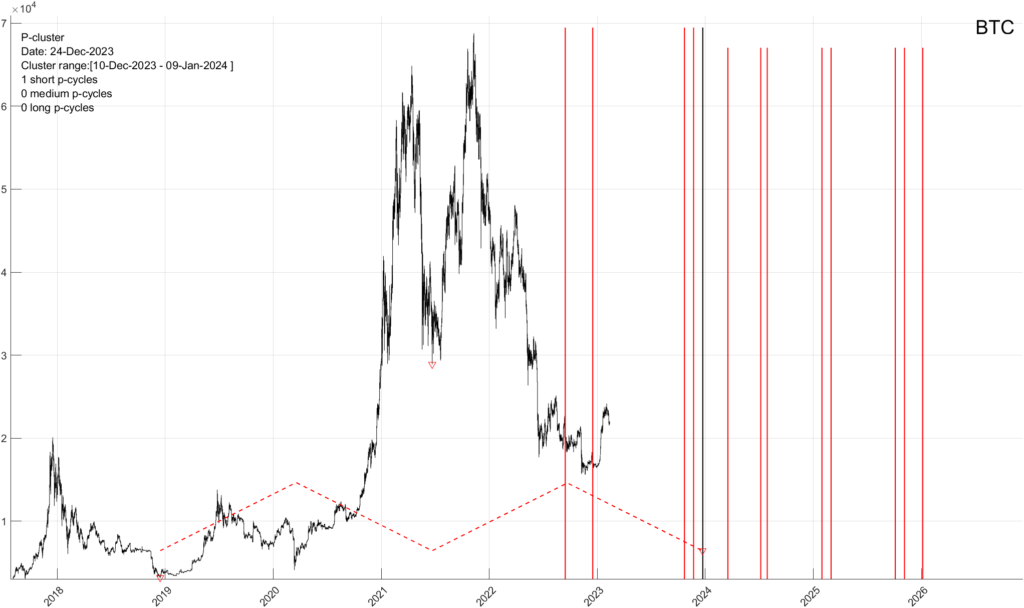
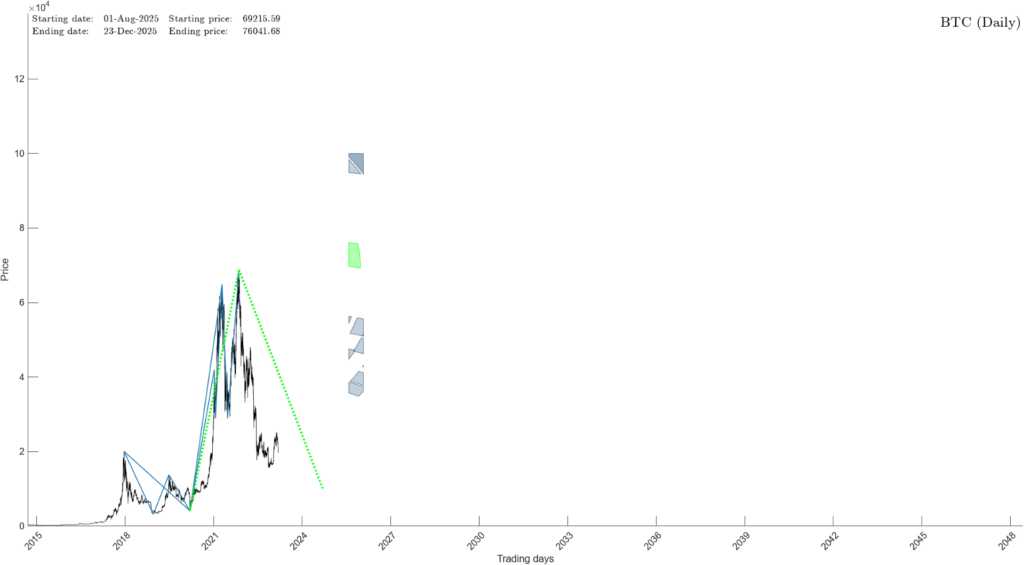
If you would like to see our exact TIME & PRICE targets for Bitcoin’s (BTC) bottom, as well as our precise turning point “targeting analysis” , please CLICK HERE
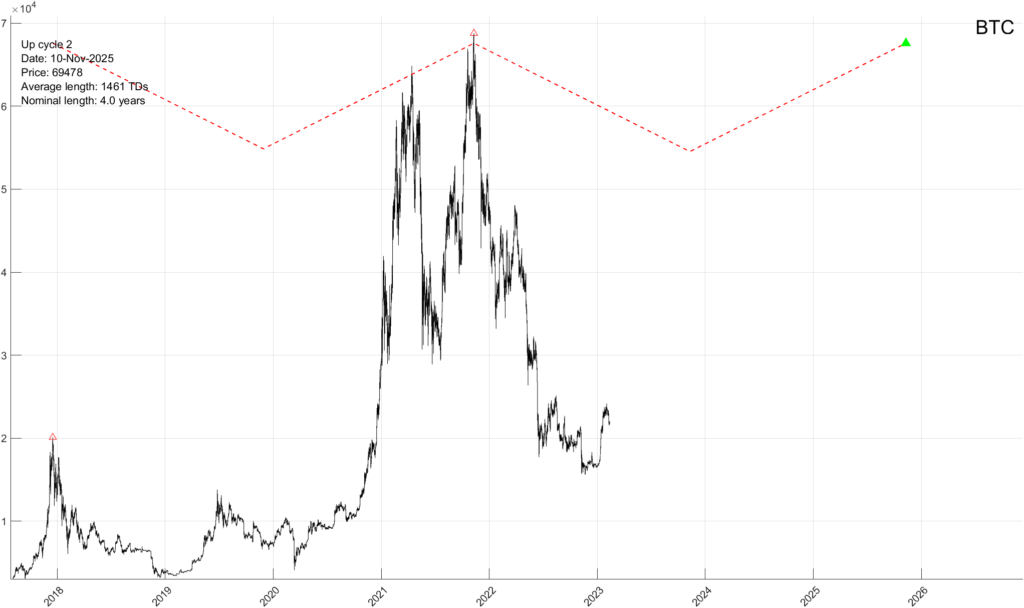
In early January of this year we confirmed Bitcoin’s November of 2022 bottom as a longer-term precise mathematical bottom and have suggested at the time that Bitcoin will run up to above $30K. No one believed us at the time – what else is new.
It appears now that the proverbial Bitcoin bulls are coming back from the dead, their outlandish predictions are once again gaining steam. Not so fast….here is our latest Bitcoin (BTC) update……
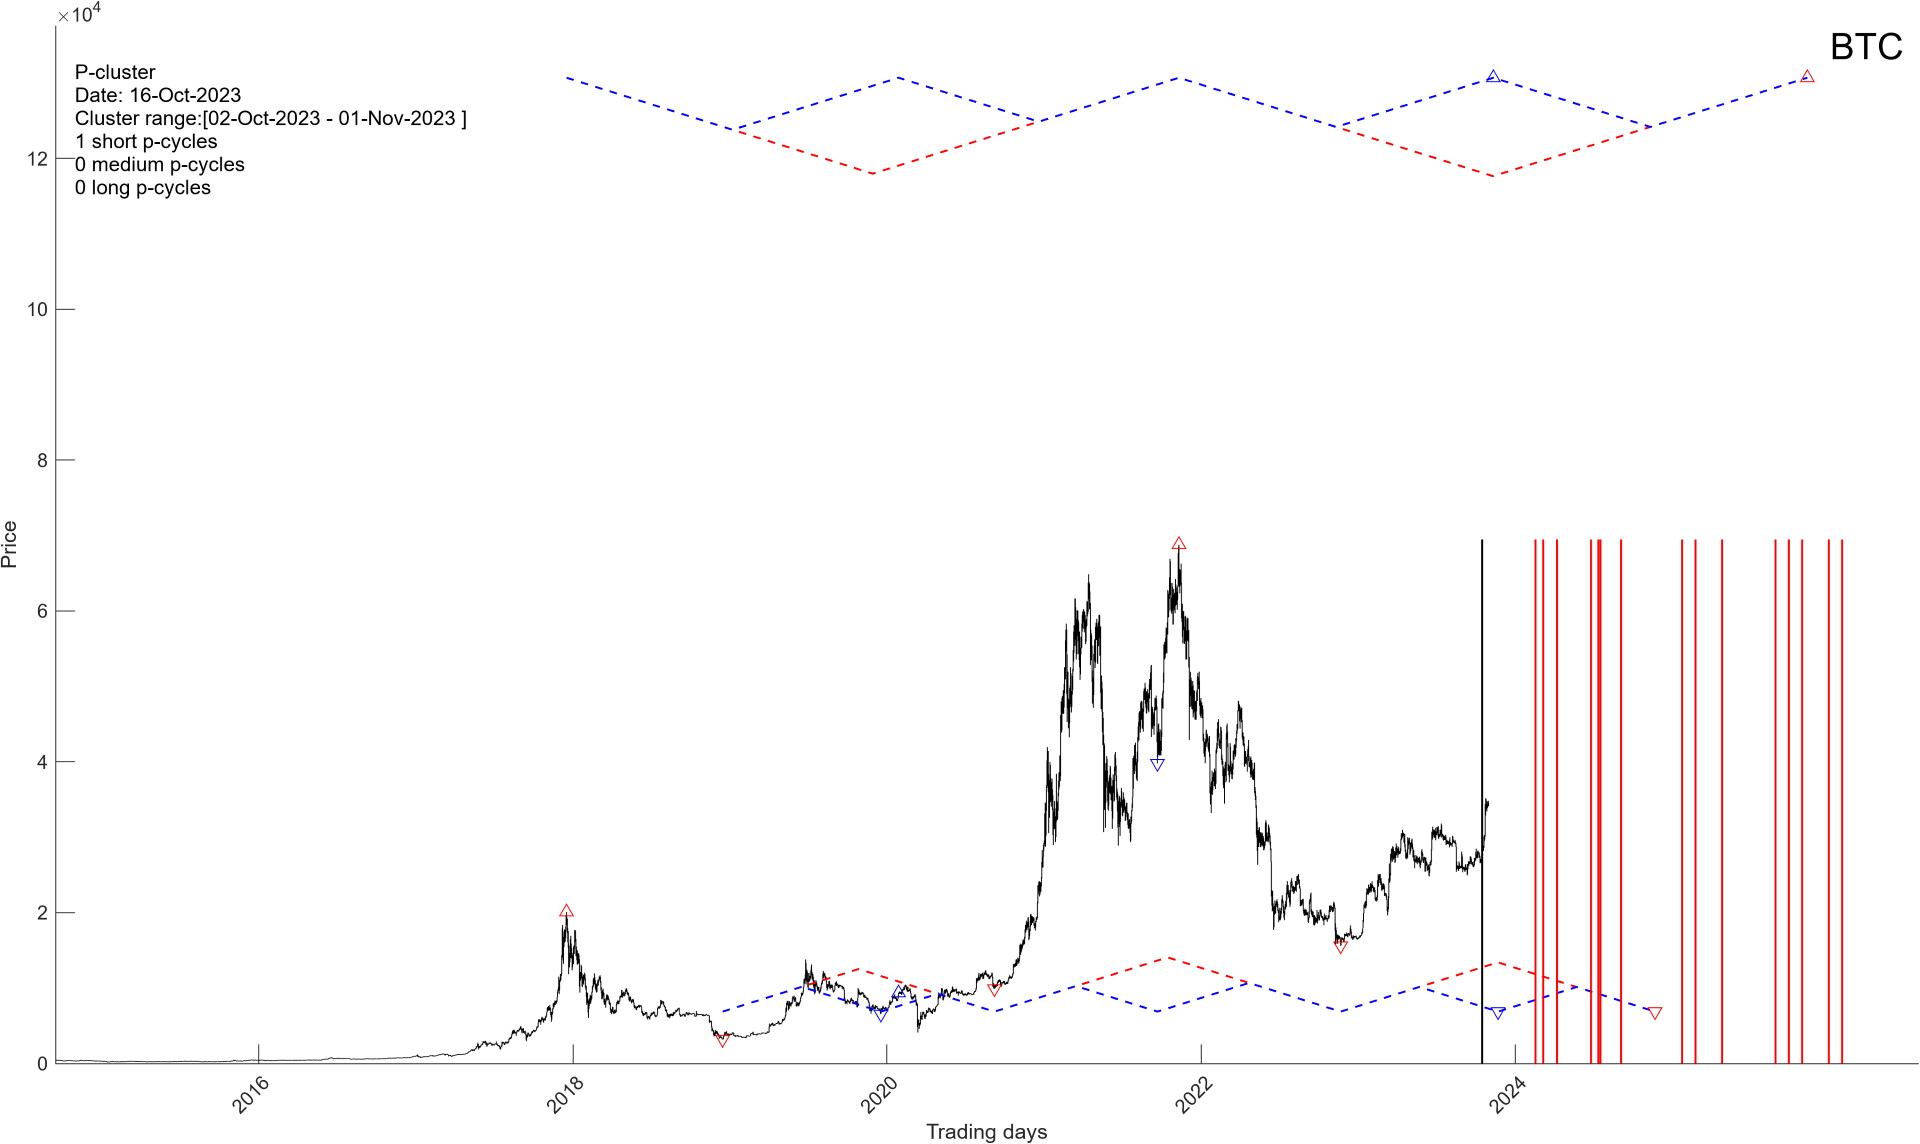
BITCOIN (BTC)
Date of Analysis: October 30th, 2023
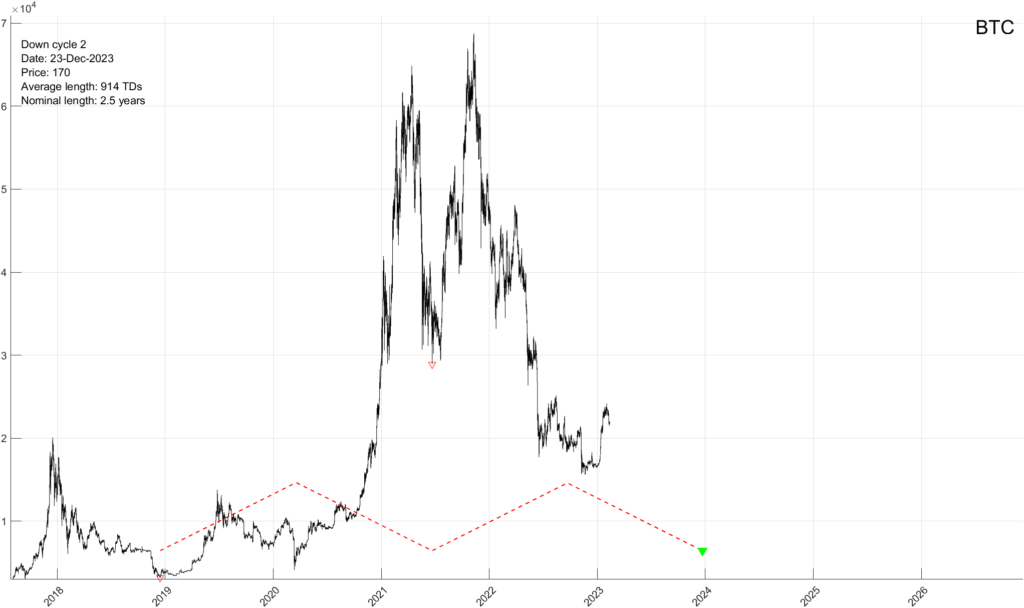
Our mathematical and timing analysis for Bitcoin shows the following…….
In summary, expect a range bound Bitcoin until a major bottom arrives around XXXX of 20XX. Then a powerful move higher to a new all time high. A more exact targeting analysis will be available as we approach the junctures above.
If you would like to see our exact TIME & PRICE targets for Bitcoin’s (BTC) major bottom, as well as our precise turning point “targeting analysis” , please CLICK HERE
If you would like to see our exact TIME & PRICE targets for Target’s (TGT) bottom, as well as our precise turning point “targeting analysis” , please CLICK HERE
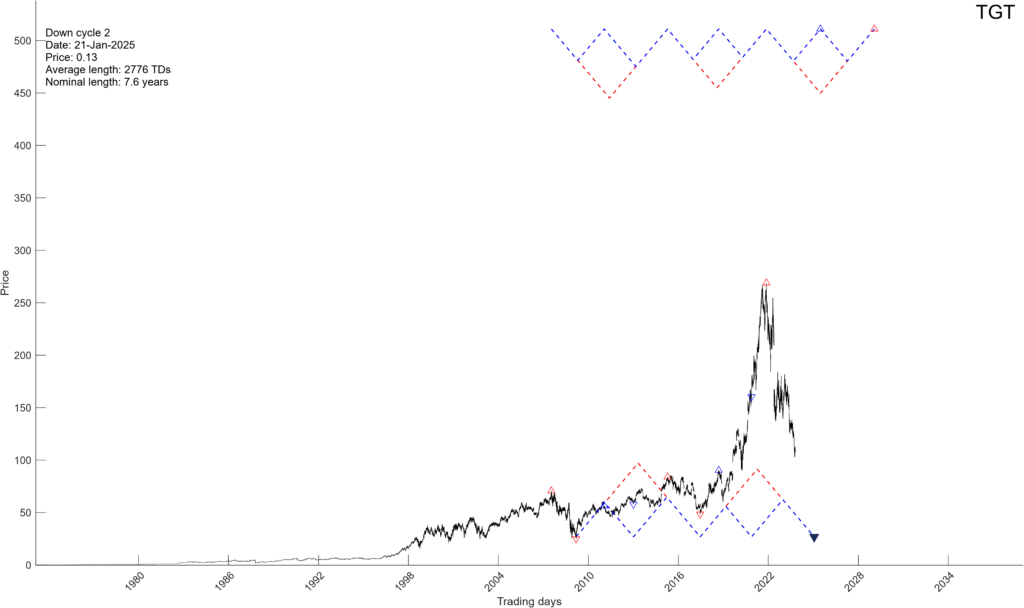
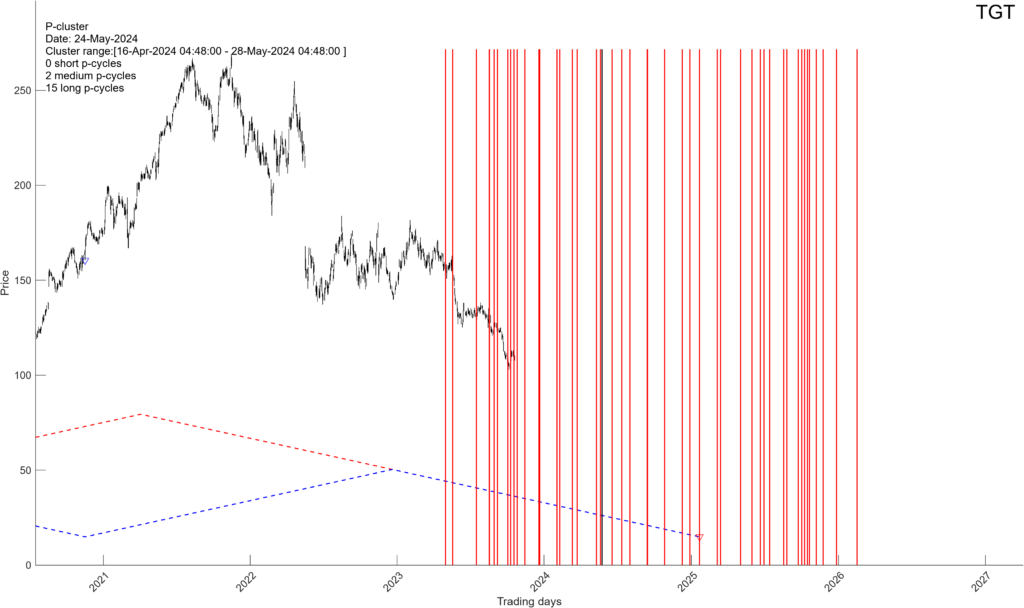
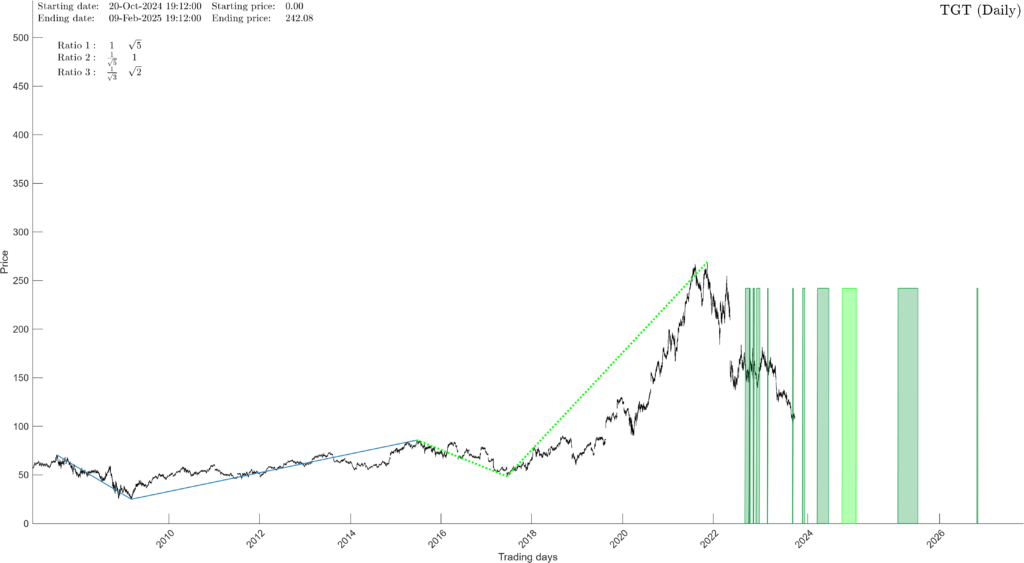
Target (TGT)
Date Of Analysis: October 25th, 2023
Our mathematical and timing analysis for TGT shows the following……
In summary, once the bottom is put in place in XXXX TGT will likely turn into a fast mover and advance significantly into June of XXXX.
If you would like to see our exact TIME & PRICE targets for Target’s (TGT) bottom, as well as our precise turning point “targeting analysis” , please CLICK HERE
I.0.1. There is a long-term Up-cluster arriving on Oct-28-2023.

Daily D-cluster arriving on Nov-12-2023

Daily P-cluster arriving on Nov-12-2023
I.0.2. There is a 30-day Composite Cycle up cycle arriving in on Oct-24-2023 and a 70-day Composite down cycle arriving on Oct-18-2023.

30-day Composite up arriving on Oct-24-2023

16-weeks Composite up arriving on Nov-24-2023
To see the rest of the report outlining our short-term parameters, our analytical conclusion and our upcoming short-term trade setups, please CLICK HERE