InvestWithAlex.com 

Massive Inflation About To Hit?

In your dreams…. As CNBC Report below indicates “Perfect Storm For Inflation Could Rock The Market”. It shocks me how incompetent our financial media is. This should not come as a surprise since a pretty face, fake boobs and a good quoting/teleprompter reading skills seem to be the only job requirements.

We are already having massive inflation you mindless monkeys of CNBC. However, instead showing up in wages, goods or commodities it is showing up in the stock market and the real estate market. The FEDs have been pumping a tremendous amount of credit into our financial system since 2008, hoping it would spur inflation in every sector of the economy. To their surprise, that didn’t work. Instead, the money flowed towards the stock market and other speculative endeavors. Blowing up massive speculative bubbles in the process.

When the stock market continues its bear market of 2014-2017 you should see the evidence of the underlying deflation instead of inflation. Yes, we will eventually have massive inflation, but that day is way off in the future. First, a deflationary collapse is a must.     

zimbabwe-money

Did you enjoy this article? If so, please share our blog with your friends as we try to get traction. Gratitude!!!


Click here to subscribe to my mailing list


Massive Inflation About To Hit?  Google

Perfect storm for inflation could rock the market

As investors cheer the good news for job growth that came with the February employment report, they may be overlooking a troublesome dynamic: A tightening jobs market, in combination with rising commodity costs, could stir inflation, cutting into corporate profits and forcing the Federal Reserve to become more hawkish.

On Friday, the nonfarm payrolls measure showed an increase of 175,000 jobs in February, well above the weather-dampened expectations. And though the unemployment rate ticked up to 6.7 percent from 6.6, the broadest measure of unemployment, the U-6, dropped slightly from 12.7 percent to 12.6 percent—the lowest reading since it was at that level in November 2008.

Since the U-6 counts all unemployed workers, plus marginally attached workers and workers employed part-time for economic reasons, it could be a better measure of the remaining supply in the labor market. The decrease in the U-6 could thus indicate that the “slack” in the labor force—which allows companies to hire more workers without paying more—is decreasing. Once the slack is gone, wage inflation tends to follow.

“Measuring slack is not an easy thing, but an unemployment rate of 6.7 tells you there’s a lot less slack than there used to be,” said Peter Boockvar, chief market analyst at the Lindsey Group. “The idea that all of the people who dropped out of the labor market will magically come back just doesn’t make sense—particularly for the low-end worker who is now enjoying a lot of government benefits. Therefore, the labor market is getting tighter than the Fed thinks.”

As a result, “the inflation trend is going to start moving higher. It’s not a single event that will happen—it’s a process. But it’s definitely worth watching,” he said.

(Read moreJobs report signals higher interest rates ahead)

The other factor that could contribute to this trend is the recent rise in commodity prices. The CRB commodity index, a broad measure of prices, has risen some 10 percent this year. It’s at its highest level in over a year, due to tough agriculture conditions and winter weather issues that have sharply increased the prices of many commodities. More recently, the crisis in Ukraine seems to have boosted prices of commodities such as wheat and corn.

“Increasing commodity prices will drive a rise in inflation,” predicted Kathy Lien, managing director of FX strategy at BK Asset Management. “It’s a natural reaction to the recent growth as well as the geopolitical uncertainly that is happening in the global economy.”

A broad measure of inflation for the month of February will come on Friday, when PPI-FD is released. This recently revamped version of the Producer Price Index tracks changes in the “final demand” prices paid to producers for goods and services. And because it looks at inflation being experienced by producers, rather than consumers, it is considered an early gauge of the extent to which inflation will be experienced by consumers.

The consensus estimate is for the PPI to show a 0.2 percent month-over-month percentage change for February, while the PPI with food and energy stripped out is expected to come in at just 0.1 percent, according to FactSet.

“Even with the change in methodology, you’re going to start to see the commodity prices moves in these numbers, potentially,” Boockvar said.

Higher commodity prices and faster-than-expected wage growth are actually the two risk factors that legendary bull Jeremy Siegel pointed out in an interview Tuesday in CNBC’s “Futures Now.” He warned that the labor market “could be tighter than we think,” which will create a serious dent in corporate earnings, given that companies will need to pay more to their workers. And the Wharton professor cautioned that if commodity prices continue to rise, then the Fed will need to rethink its dovish activities.

(Read moreSiegel: I’m a bull, but these two things worry me)

After all, the continuation of the Fed’s shrinking quantitative easing program and maintenance of its ultra-low federal funds target rate are premised on low inflation. One major concern about stimulative policies is always that they could spur inflation if used irresponsibly.

In fact, if inflation rises to 2 percent and the headline unemployment rate drops by just another 0.2 percent (to 6.5), then both parts of the Fed’s quantitative guidance regarding what will make the central bank raise the federal funds rate target will be satisfied. And a higher federal funds rate will likely mean higher bond yields across the board, potentially making equities less attractive by comparison.

“The broad consensus is that there’s no inflation. But if there’s one thing that mucks up Fed policy, it’s a faster-than-expected uptick in inflation,” Boockvar said. “If that happens, the Fed isn’t just behind the curve—they’re behind 10 curves.”

That’s why Brian Stutland of the Stutland Volatility Group will be watching PPI so closely, especially as it relates to gold, which is considered an inflation hedge.

“If you see the PPI number start to creep up, that’s maybe the only reason I start to become more bullish about gold,” Stutland said.

However, he adds that if the measure comes in low, as he expects, “that’s going to give me more confidence that the stock market is the place to invest right now.”

Goldman Sachs Needs To Distribute Their Chinese Shares To Fools. Issues A Buy Recommendation

I write about China and their economic situation extensively. Please type in “China” into the search bar on the right to see all of the data. With it’s massive credit bubble, real estate bubble, lagging stock market, falling currency and a slew of other problems, Goldman Sachs believes right now is the great time to buy China. Certainty, with all the bad news and Chinese stock market “under performance” it might seem as if right now is a good time to buy China. After all, the god of investment banking, Goldman Sachs thinks so.  

Don’t be a fool. 

Goldman Sachs will be selling China while you are buying there idiotic forecast. With the US Bear Market and a severe recession of 2014-2017 starting now, it would be very difficult for the Chinese stock market to exhibit any sort of a bull market. Not impossible, but highly unlikely. Remember, Chinese credit collapse, defaults, real estate collapse and Yuan decline are all in early stages of development. So, read between the lines here and sell China.  

goldman sachs investwithalex2

Did you enjoy this article? If so, please share our blog with your friends as we try to get traction. Gratitude!!!


Click here to subscribe to my mailing list


Goldman Sachs Needs To Distribute Their Chinese Shares To Fools. Issues A Buy Recommendation Google

Bloomberg Reports: China Stocks Seen Rallying 24% at Goldman on Valuations

Goldman Sachs Group Inc. is sticking with its recommendation to buy Chinese stocks, the biggest losers worldwide this year, after valuations fell to the lowest level in a decade versus global peers.

“Given how share prices have corrected and given where the valuations are, from a risk-reward standpoint we still think we can make a positive case on Chinese equities,” Kinger Lau, a strategist at Goldman Sachs, said in an interview inHong Kong on March 4. He predicts theHang Seng China Enterprises Index (HSCEI) will climb to 12,000 in the next 12 months, a 24 percent advance from last week’s close, versus the brokerage’s December forecast for the measure to reach 13,600 by the end of 2014.

The index of Chinese shares in Hong Kong lost 10 percent this year through last week, the most among 93 global benchmark indexes tracked by Bloomberg, as factory gauges pointed to a slowdown in the economy and concern grew that more companies will struggle to repay debt after the nation’s first onshore corporate bond default on March 7. The gauge trades at a 45 percent discount to the MSCI All-Country World Index, the most in a decade.

China’s leaders are trying to balance clampdowns on the shadow-banking industry and local-government debt with measures to support growth in the world’s second-largest economy.Shanghai Chaori Solar Energy Science & Technology Co. (002506) became the first company to default in China after failing to pay full interest due last week on onshore bonds.

Relative Value

The Hang Seng China index is valued at 1.1 times net assets, the biggest discount since September 2003 to MSCI’s global index, which has a multiple of 2. The H-share measure slid 1.7 percent to 9,540.10 as of 1:41 p.m. in Hong Kong.

BlackRock Inc. today named Helen Zhu as head of China equities, luring the New York bank’s chief China equity strategist away from Goldman Sachs. The appointment takes effect on April 7 and Zhu may start managing funds later this year, BlackRock said in a statement. The New York-based firm is the world’s largest money manager, overseeing about $4.3 trillion.

Industrial & Commercial Bank of China Ltd., China Construction Bank Corp. and Agricultural Bank of China Ltd. all trade at about the same level as their net assets, while Bank of China Ltd. has a price-to-book ratio of 0.8. The four lenders are the nation’s biggest by market value.

“Any clear and concrete policy measures in terms of dealing with shadow banking loans and local government debt would likely be positive catalysts for banks,” Lau said. “Valuations for Chinese banks have already priced in a very significant crisis scenario.”

Regulated Borrowing

Premier Li Keqiang told the National People’s Congress last week that China will develop a regulated regional borrowing mechanism, after local-government liabilities surged to 17.9 trillionyuan ($2.9 trillion) as of June 2013 from 10.7 trillion yuan at the end of 2010. Authorities have also started a cleanup of the $6 trillion shadow-banking industry and identified sectors of the economy in need of consolidation.

While Chinese banks’ non-performing loans rose by 28.5 billion yuan in the last quarter of 2013 to 592.1 billion yuan, the highest since September 2008, bad loans only accounted for 1 percent of total lending, the China Banking Regulatory Commission said Feb. 13.

Bank valuations currently imply a non-performing loan ratio of about 7 percent, Lau said.

Global Outlook

An improving global economic outlook may also be a catalyst for a rally in Chinese shares, Lau said, declining to name specific stocks.

The World Bank raised its 2014 growth forecasts for advanced nations in January to 2.2 percent from 2 percent, while cutting its estimates for developing nations to 5.3 percent from 5.6 percent. China is the world’s biggest exporter.

China last week retained a target for 7.5 percent growth in 2014 for the $9 trillion economy. Gross domestic product expanded 7.7 percent in 2013, the same pace as in 2012.

A purchasing managers’ index from HSBC Holdings Plc and Markit Economics dropped to a seven-month low of 48.5, the companies said March 3. A similar gauge from the government with a larger sample size fell to 50.2, the lowest since June, a report showed March 1. Numbers above 50 signal expansion.

Overseas shipments unexpectedly declined 18.1 percent in February from a year earlier, customs data showed March 8, compared with analysts’ median estimate for a 7.5 percent increase. Producer prices fell 2 percent, the most since July, according to a statistics bureau report yesterday, extending the longest decline since 1999.

Share Slump

The Hang Seng China gauge has tumbled 16 percent since Noah Weisberger, a New York-based analyst at Goldman Sachs, predicted on Dec. 2 that the H-share measure would rally 18 percent by the end of 2014.

Goldman Sachs’s forecast formed part of a trade recommendation in which the bank told investors to buy Chinese stocks while selling copper as a bet that commodities would lag the rally in equities. Goldman Sachs called the trade its fourth top recommendation for 2014.

The Impact Of 7 Million Foreclosures

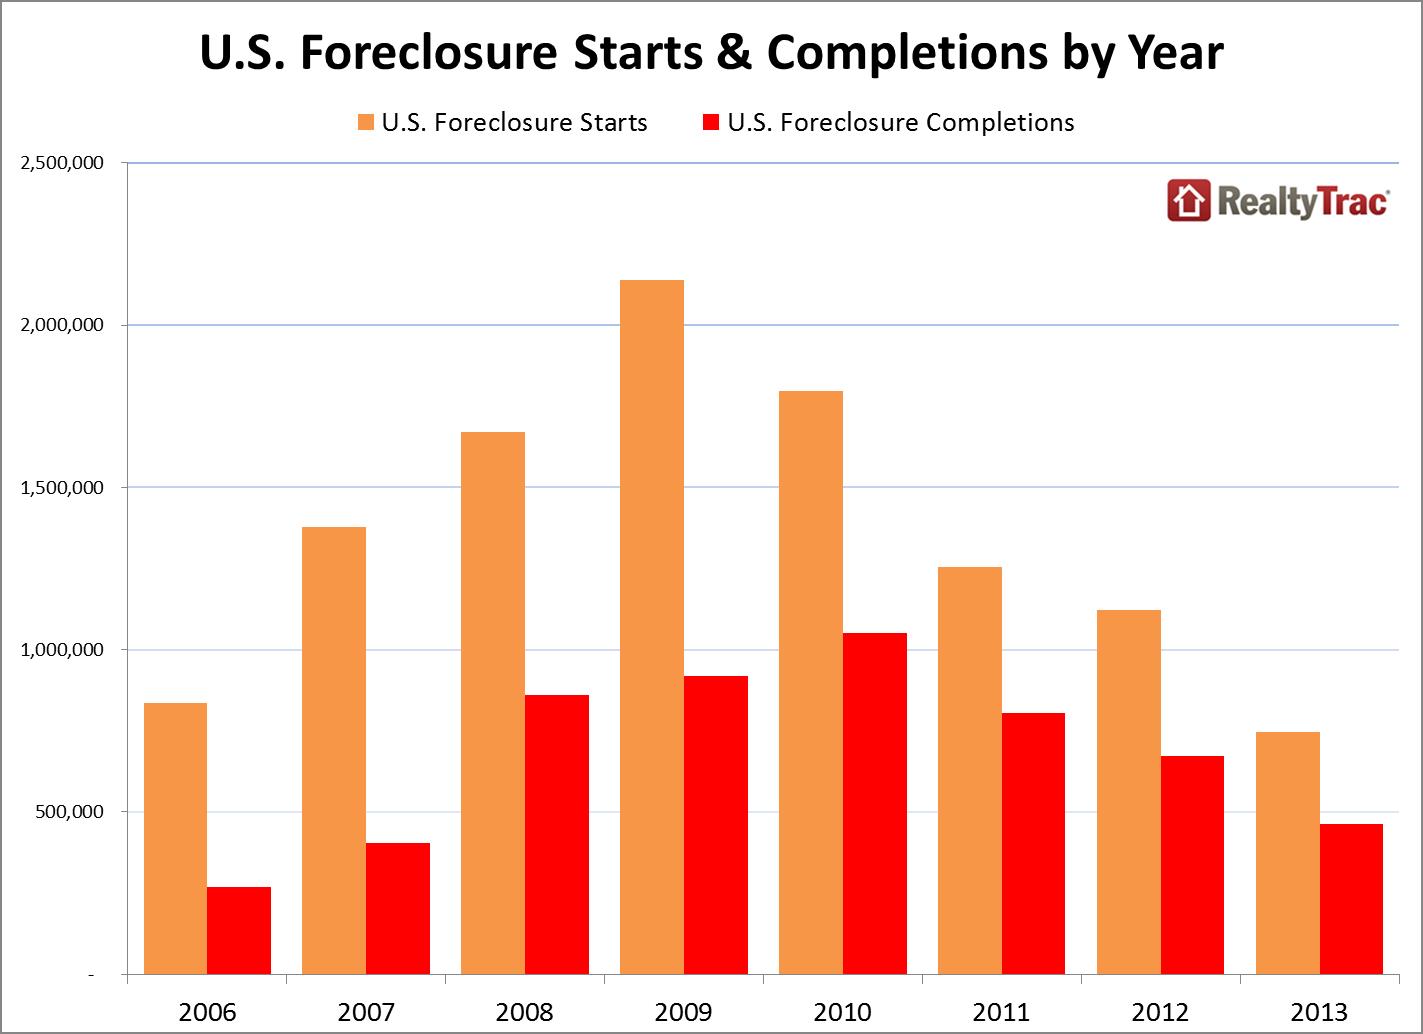
Believe it or not, but since 2006 top, the US Real Estate market plowed through 7 Million Foreclosures. So much for that real estate recovery…aka…dead cat bounce.  

Based on my calculations, that number represents 10-15% of American households who have a very bad taste in their mouth when it comes to real estate and “owning their own home”. The American real estate psyche is definitely changing.  That is one of the reasons behind why you are seeing the home ownership rate dropping like a rock. Given today’s rebound in prices, unaffordability levels and investor speculation frenzy, there is only one direction this real estate market can go. To see when our Real Estate Market will collapse again, please Click Here to check out our real estate report. 

7 million foreclosure-completions

Did you enjoy this article? If so, please share our blog with your friends as we try to get traction. Gratitude!!!


Click here to subscribe to my mailing list


The Impact Of 7 Million Foreclosures  Google

There is little bragging that goes on when a poor financial decision is made.  You rarely hear about the person that invested a sizeable portion of their retirement account into AOL at the peak or going all in on Enron.  The same applies to housing.  We are seeing chatter reflect that of 2005, 2006, and 2007.  Justifications are different but some people seem to feel they bought at the “perfect” time.  Just for the sake of curiosity I ran the numbers of total foreclosures since the crisis began with the housing peak in 2006.  In total, 7 million Americans have been served with the bitter taste of foreclosure.  On the flipside, since we know that roughly 30 percent of all purchases have gone to investors and Wall Street, we can say that probably over this same period 2,000,000 homes are now in the hands of some sort of investors (i.e., big money, small money, foreign money, and second homes).  You also have to wonder how many of these people that lost their homes in foreclosure are itching to get back on the horse and buy again.  Credit standards are fairly tough for getting a loan today even though rates are low.  And those with the credit and income are battling it out in flippervilles where “all cash” is dominating the scene.  There are likely some permanent structural changes that are a result of a stunning 7 million foreclosures.


The 7 million club

From reading the mainstream press all you hear are glorious signs of housing resurrection!  Come one come all into the house of real estate where the almighty Fed will allow no harm to occur.  Just sign and pray and the next thing you know you’ll be the next Donald Trump.  The flipping, rehabbing, and housing shows are once again filling the space on a cable station near you.  The perception of the Fed being this almighty protector of housing makes a bit of sense but where was the Fed in 2007?  Last time I checked the Fed came into existence in 1913, over 100 years ago.  Frankly, the Fed on their list of priorities has: to keep member banks afloat, keep financials steady, a deep attempt to protect the bond market, and more importantly keep interest rates low on our massive $17+ trillion national debt that will never be paid back.  Housing is low on the list of priorities especially with many of the foreclosures now shifting to “stronger” hands.

You wouldn’t know it but since the peak in 2006 we have witnessed 7 million foreclosures:

foreclosure completions

Even in 2013 we had 1.4 million properties with notice of defaults, scheduled auctions, and full on REOs taken on.  Early in the crisis these stories were common since they were a novelty to the press.  Now however, many of these properties are shifting over to large investors pushing inventory up.  A clear consequence of this is a large pool of potential buyers that are unable to buy.  7 million households now have a marred credit history.  In many hot metro areas given the 2013 jump in prices to get the best rates you will need good credit.  Contrary to nonsense being spouted you actually need a solid income to compete in any high priced metro area.  Plus, we are assuming this foreclosed club is even interested in buying again.  Many are opting to go the renting route.

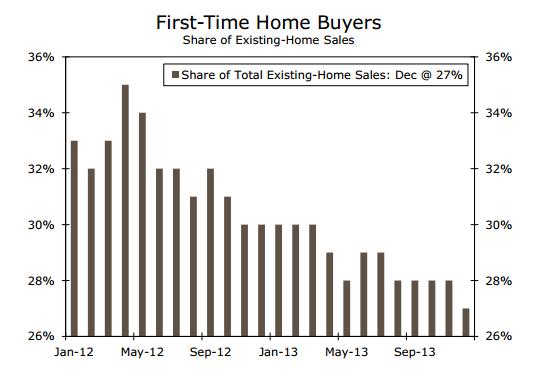
The assumption is that the market is being driven up organically by regular households and that is not the case:

first time home buyer

Source:  Wells Fargo

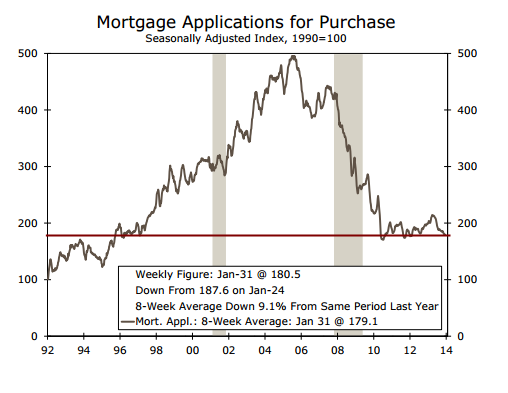
The number of first time buyers is pathetic because household formation is weak and many young Americans are living at home with mom and dad.  Forget about buying, they are having a tough timepaying higher rents to the new feudal landlords.  You would expect with the rapid rise in prices that existing home sales are off the charts but they are not.  For most people in the perpetual serf demographic, a mortgage is necessary to buy but look at requests for mortgages via applications:

mortgage apps for purchase

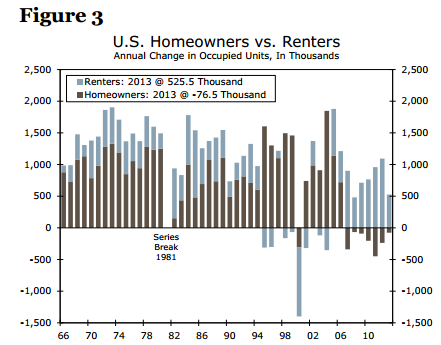
We are back to levels last seen nearly 20 years ago!  Only difference is that we have 50,000,000 more people today walking the streets of the U.S. of A. than we did back then.  Since access to middle class living is getting tougher thanks to weak income growth, more people are opting to rent:

rentals vs households

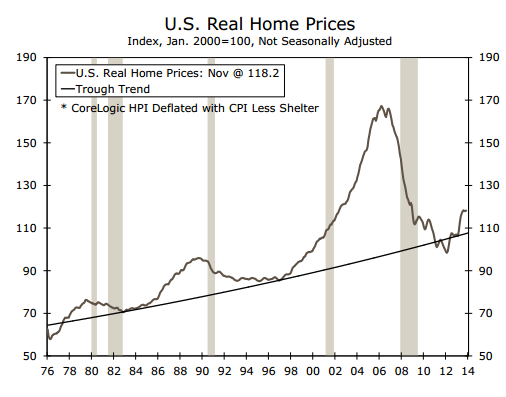
We continue to add a large number of renting households.  For the 7 million foreclosed souls, credit destruction might force their hand but many might have gotten a healthy vaccine from the “real estate only goes up” mantra.  We have new folks taking their chance at housing roulette with placing a massive bet on red and many diving in with ARMs to stretch their budgets to the fullest potential.  Some luck out but only if their timing aligns with bigger macro events.  They then back fill the narrative to justify their behavior.  Confirmation bias!  It might come as a shock that many things that happen to you, good or bad may have nothing personal to do with your decisions.  I’m sure we have some aspiring Trumps in Greece or Liberia but the environment isn’t setup for mad real estate speculation.  You also had many that escaped the last crash by tiniest of margins.  Say someone that made that last fabulous flip in Compton, Pacoima, Palmdale, Las Vegas, or any market that is eons away from the peak.  Where they masterful timers?  Unlikely.  They lucked out.  The massive bubble forgave their sins.  But it doesn’t forgive all.  The beauty of this QE juiced market is the Fed has turned us all into speculators whether we admit it or not.  By default you are playing this game whether you want to or not.  Cautious and have your money in a safe bank or CD?  Inflation is eroding your purchasing power.  Thinking of buying?  This might be a turning point:

us real prices

Gains are stalling out largely because investors are slowly stepping back and households are still trying to gain their footing in this new economy.  Those 7 million foreclosures are massive and those people walk amongst us.  It is unlikely that we will hear their horror stories in mass.  Even in the crash days of 2007 through 2012 (the trough) you were hard pressed to see people discuss this openly.  Yet the confirmation bias going on right now is frothy and does remind us of 2006 and 2007.

Want to see some of this insanity in action?  A commenter pointed this gem out:

la home

2125 VALLEJO St

Los Angeles, CA 90031

4 beds, 3 baths (listed at 3,500 square feet)

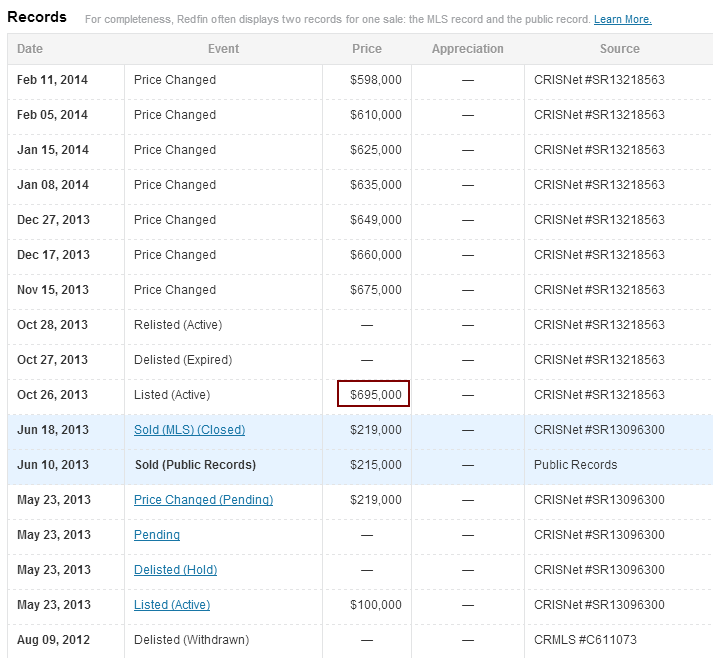
The house is currently listed at $598,000.  But let us look at the sales and listing history here:

sales history

They actually tried selling this place for $695,000!  The last sale price was $219,000 in 2013 which tells us some major rehab work went on here.  But $476,000 worth of work?  Come on now.  Even the sellers don’t believe this and that is why they have dropped the price nearly $100,000.  Thankfully Google gives us a bit of a glimmer of the home pre-makeup and Photoshop filters:

google streetview

People are pulling figures out of thin air here especially with that $695,000.  The schools in this area are sub-par so factor in tens of thousands of dollars to send the kid(s) to private school.  This home qualifies for a Real Home of Genius Award.  In the game of musical chairs, there can only be one winner.  It is about timing.  There are many signs showing a tipping point is occurring.  Unlike stocks, real estate turns around like a large cargo ship, slowly and surely.

While we may not hear much on those 7 million foreclosures, rest assured that many Americans are no longer in the camp that believes the Fed can do everything and anything to keep prices up.  For the big players, real estate is merely one tiny piece of their portfolio like owning a Rembrandt or fine jewelry.  Most of their wealth is in stocks and bonds.  Ironically Wall Street owning rental property is going to put them face to face with the proletariat and will soon come to realize that you can only raise rents based on local area incomes.  Try cash-flowing a property in Santa Monica or Pasadena at these rates.  Even flippers are starting to enter pricing purgatory one bad flip at a time.  At least someone will get a new granite countertop sarcophagus home built in the 1800s with hardwoods floors!

Who’s Got All The Stolen Bitcoins?

Last week, one of the most prominent Bitcoin exchanges,  Mt. Gox bitcoin exchange, shut its doors and filled for bankruptcy due to a Bitcoin theft. Exchange CEO Mr. Mark Karpeles had claimed that the exchange was hacked and all Bitcoins were stolen. Today, a group of hackers have accused Mark Karpeles of perpetrating the crime and stealing Bitcoins for himself. So, who is at fault. Is it Mr. Karpeles or hackers? 

Who cares!!!

The point here is NOT to invest in Bitcoins. It might be the best investments since the Tulip Mania of 1637 and it might very well go from today’s price of $600 to $1 Million, but that’s not the point here. It is too speculative, it is unregulated and it is prone to crime. Therefore, just as it might to go to $1 Milliion, it might simply go “POOF” into thin air. Just as it did above. Making it an unsound investment to say the least. As such, speculate at your own risk. 

bitcoin Did you enjoy this article? If so, please share our blog with your friends as we try to get traction. Gratitude!!!


Click here to subscribe to my mailing list


Who’s Got All The Stolen Bitcoins? Google

Report: Mt. Gox CEO Holding ‘Stolen’ Bitcoins

Hackers this weekend targeted the Reddit account and personal blog of Mark Karpeles, CEO of the bankrupt Mt. Gox bitcoin exchange, posting information online that they claim proves Karpeles is actually hoarding bitcoins he claims were stolen.

The hackers charge that some of the nearly half a billion dollars worth of the digital currency lost in recent cyberattacks is actually still in the French CEO’s possession.

“It’s time that MTGOX got the bitcoin communities wrath instead of Bitcoin Community getting Goxed,” the unnamed group wrote, according to Forbes, a reference to the downtime and other glitches that have plagued Mt. Gox.

The hackers initially posted to Karpeles’s website a 716MB file of stolen data from Mt. Gox’s servers; it included a spreadsheet of more than a million trades, the company’s balance in 18 currencies (including bitcoin), administrative access to Gox parent company Tibanne Limited, and a screenshot of the hackers’ access, as well as a list of Karpeles’s home addresses and personal resume.

An abridged version, which features Mt. Gox’s balances, was later posted online, with a link to the entire set of data.


“This release would have been sooner, but in the spirit of responsible disclosure and making sure all of ducks were in a row, it took a few days longer than would have liked to verify the data,” the hackers wrote on Pastebin, advising readers to “repost and share this info before it’s gone.”

Karpeles’s website is currently offline, and the original Reddit post has since been deleted.

Mt. Gox filed for bankruptcy in Japan late last month, saying it lost 750,000 bitcoins, or about $480 million—7 percent of the estimated global total of bitcoins. An attack on the company’s computer systems also cost Gox about 100,000 of its own units.

The filing came days after the exchange mysteriously went offline, halting trades of the cryptocurrency.

Last month, meanwhile, bitcoins valued at approximately $2.7 million went missing from Silk Road 2, allegedly due to a hack. Silk Road 2 is the reincarnation of the original Silk Road, an online black market for all things criminal that was shut down by the feds last year. The new site emerged in November and is only accessible to those who have an invite and sign in using the Tor anonymizing service.

Bitcoin has been a popular topic of late. Last week, Newsweek said it haduncovered the creator of bitcoin, a 64-year-old California man named Satoshi Nakamoto. But has denied any involvement.

For more, see How Thieves Steal Your Bitcoins, as well as the Bitcoin and Other Cryptocurrencies slideshow above.

Is China Beginning To Collapse?

I have been warning on China for at least a few years.  Today, China’s “Grow At Any Cost” policy is starting to unravel.  Earlier today Chinese stocks took a 2-3% hit, CSI 300 Index hit a five year low, the Yuan fell 0.2%  and overseas shipments plunged 18.1% (vs +7.5% estimate). 

Cracks in the foundation or beginning of a collapse? 

Both. Listen, China is unlikely to collapse or unravel within a short period of time. Whatever happens will take a considerable amount of time due to massive Government interference. To see how long, we must once again look towards the US Stock Market & Economy. The bear market and recession of 2014-2017 will take 3 years to complete. During that time Chinese exports are bound to slow down even more. In addition, with anticipated credit market blow ups it is unlikely China will be able to continue to expand it’s credit at break neck speeds of the last few years. Indicating a further slowdown and a subsequent collapse. 

Did you enjoy this article? If so, please share our blog with your friends as we try to get traction. Gratitude!!!


Click here to subscribe to my mailing list


Is China Beginning To Collapse? Google

ChinasHouseofCards

Bloomber Reports: China’s CSI 300 Plunges to Five-Year Low on Export Slump :

China’s CSI 300 Index (SHSZ300)plunged to the lowest level in five years and the yuan weakened as an unexpected drop in exports spurred concern that the world’s second-largest economy is slowing.

The index of the largest Chinese stocks slid 3.3 percent to 2,097.79 at the close, the lowest since February 2009, while the Shanghai Composite Index tumbled 2.9 percent, the most since June. The yuan fell 0.2 percent to 6.1385 per dollar. Money-market rates slumped to a 21-month low amid speculation demand for cash is diminishing as economic growth weakens.

Overseas shipments plunged 18.1 percent in February, compared with analysts’ median estimate for a 7.5 percent increase, as distortions from the Lunar New Year holiday made forecasting more difficult. Investors are looking for policy guidance from this month’s National People’s Congress in Beijing amid concerns over slowing growth, a flood of new share sales and geopolitical tension between Russia and Ukraine.

“There’s a slew of bad news today — lousy economic data, IPOs may be restarting, the policy meeting is ending soon with no surprises and the Ukraine situation isn’t helping,” said Xu Shengjun, an analyst at Jianghai Securities Co. in Shanghai. “The market is being dragged down by all these factors, I don’t see any positive stories today.”

Growth Target

Jiangxi Copper Co. led declines for material producers, slumping 5.8 percent as copper prices on the Shanghai exchange plunged by the 5 percent daily limit. China is the biggest consumer of commodities from copper to iron ore and rubber.

Poly Real Estate Group Co. tumbled 4.8 percent after the developer reported a 8.4 percent drop in sales for last month. A weaker yuan is boosting dollar borrowing costs for Chinese developers already grappling with a domestic property-market crackdown and slowing sales.

The drop in exports highlights the challenges for Premier Li Keqiang in achieving this year’s economic growth target of 7.5 percent. Li announced the goal last week at the opening of the annual meeting of the NPC, a pace unchanged from last year. Imports rose 10.1 percent from a year earlier, leaving a trade deficit of $23 billion, the biggest in two years.

China’s consumer price index rose 2 percent in February from a year earlier, the smallest gain in 13 months, data from the National Bureau of Statistics showed yesterday. Producer prices (CHEFTYOY) fell 2 percent, the most since July.

Cheapest Valuation

“The inflation and PPI numbers signal a lack of demand from consumers and industries, while the export number is way below expectations even after discounting the Chinese New Year effect, so investors are concerned,” said Du Liang, an analyst at Shanxi Securities Co. in Beijing. “I reckon the sell-off will get some support at the 2,000 level” on the Shanghai Composite index, which closed at 1,999.07 today.

The CSI 300 trades at 7.7 times projected 12-month earnings, the lowest level since at least 2007, according to data compiled by Bloomberg. Today’s tumble is the biggest since a cash crunch in China’s interbank market dragged down the index by 6.3 percent on June 24. The gauge slipped another 0.5 percent in the following three days, then rallied as much as 16 percent through mid-September.

The Hang Seng China Enterprises Index (HSCEI) fell 1.8 percent, dragged down by a 4 percent loss for Anhui Conch Cement Co. The Bloomberg China-US Equity Index slid 1.3 percent on March 7.

The yuan has weakened about 1.4 percent in 2014. The People’s Bank of China lowered the dailyreference rate by 0.18 percent, the most since July 2012, to 6.1312 per dollar today.

The cut in the yuan fixing “is significant, coming on the heels of poor trade data, and suggests a possible policy push to weaken the yuan to help exporters,” said Dariusz Kowalczyk, a Hong Kong-based strategist at Credit Agricole CIB. “This would mean rising risks to more downside.”

Repo Rate

The seven-day repurchase rate, a gauge of funding availability in the banking system, fell 12 basis points to 2.30 percent, according to a fixing published by the National Interbank Funding Center. A one-year rate swap that exchanges fixed payments for the floating seven-day repo dropped as much as 15 basis points to a four-month low of 4.26 percent, data compiled by Bloomberg show.

Slowing inflation may give leaders more space to support growth if needed as they gauge the effects of the nation’s first onshore corporate-bond default.

Shanghai Chaori Solar Energy Science & Technology Co., a solar-cell maker, said March 7 it wasn’t able to make an interest payment due that day in full, providing the first default in China’s onshore bond market. Chaori’s experience may be a sign the government is backing off from its practice of bailing out companies with bad debt.

More Defaults

China should allow companies to default on their bonds, an external supervisor at the Bank of China said March 8.

“We need to be more accepting and allow such defaults to happen,” Mei Xingbao told reporters during a meeting of the Chinese People’s Consultative Conference in Beijing. “The debtor must be responsible for his own debt. He must tell the investors that there is risk involved in the product.”

China Southern Airlines Co. slid more than 3 percent in Shanghai and Hong Kong trading after the carrier said it sold seven tickets for the Malaysian Airline System Bhd. flight that has gone missing.

Malaysia stepped up efforts to locate the jet that may have crashed in the Gulf of Thailand with 239 people on board, focusing on oil slicks. The prospect of terrorism arose after Austria andItaly said passports used by two male passengers were stolen from their citizens. The flight was a codeshare with China Southern.

BlackRock Hire

BlackRock Inc. named Helen Zhu as head of China equities, luring the strategist away from Goldman Sachs Group Inc. to increase coverage of this year’s worst-performing stock market.

Zhu covered Chinese companies traded in Hong Kong and yuan-denominated stocks in the mainland as Goldman Sachs’s chief China equity strategist. She forecast in December that the Hang Seng China index would climb about 20 percent by the end of this year. It has since tumbled 16 percent and is the biggest loser among global benchmark equity indexes tracked by Bloomberg.

“China has been a difficult market to trade and difficult for all strategists to get right,” Hao Hong, the chief China equity strategist at Bocom International Holdings Co., said by phone from Beijing. “That said, Zhu is a good hire as she has done this for a long time. It shows BlackRock’s commitment to the Chinese region.”

Warning: The Real Reason Behind This Minimum Wage Increase Push

With massive imbalances building up all over the place and with the asset inflation/speculation gaining speed, the US Government desperately needs one thing….. 

Wage Inflation. 

Even though the FED pumped a tremendous amount of money into our economy (over $1 Trillion in the last 3 years alone) they have been fairly unsuccessful in getting the unemployment number low enough were wage inflation kicks off. This is a big problem because their entire “flood the market with credit” premise relies on inflating everything away. If wages do not increase, their entire plan collapses. With most of the credit flowing to “asset inflation” as opposed to “economic/wage inflation” the FED is troubled.

Of course, a little too late. At this stage, wage inflation will do very little to stem the upcoming stock market collapse and a severe recession within the US Economy. What bear market? Please click here to read the bear market report.  

Did you enjoy this article? If so, please share our blog with your friends as we try to get traction. Gratitude!!!


Click here to subscribe to my mailing list


Warning: The Real Reason Behind Minimum Wage Increase Push  Google

RaiseTheMinimumWageA

Get ready for a bigger push in Washington to raise the minimum wage

Cities and states have taken the lead on raising the minimum wage in the absence of Congressional action but that could potentially change after the 2014 midterm elections.

“Democrats really see this as a winning issue” in the November midterm elections, says Steven Greenhouse, labor and workplace reporter at The New York Times. They “are trying to hit this hard…as a way to erase losses” associated with Obamacare,” Greenhouse tells The Daily Ticker.

Democrats also see raising the minimum wage “as an important way to lift the wages of millions of American workers,” says Greenhouse.

The current federal minimum wage is $7.25 an hour — which, after adjusting for inflation, is about 30% less than it was 46 years ago.

President Obama and many Democrats want to raise the minimum  to $10.10 an hour by 2016, which would boost the earnings of some 16 million Americans. The Congressional Budget Office says the wage hike would reduce poverty for 900,000 Americans but also eliminate 500,000 jobs — a conclusion that Republicans are using to argue against the hike.

Given that opposition, President Obama decided to institute the wage hike for federal contractors  by executive order, effective next January. Eighteen states have instituted a minimum wage that’s higher than the national minimum. Washington leads with $9.32 an hour and SeaTac, a city south of Seattle, has the highest minimum wage in the country at $15 an hour.

Greenhouse says he’s interviewed many minimum wage workers who say they can’t support themselves, no less their families, making just $8 or $9 an hour. And many of those workers are household breadwinners who are educated and not the teenager flipping hamburgers in a summer job, which has been the conventional image of minimum wage workers.

“More educated workers are making just $7, $8 or $9 dollars and hour,” says Greenhouse. Many have  finished high schhool and a growing percentage have some college credit.

But is raising the minmum wage the best way to support those workers?

Some economists argue that increasing the earned income tax credit would be more effective because it would shift the burden from employers to the government.

“Republicans really don’t want to do it because that would cost the govenrment billions of dollars,” says Greenhouse. “That is a heavier political lift than raising the minimum wage,” which is why Democrats are focusing on minimum wage,  says Greenhouse.

A recent Wall Street Journal/NBC News poll found that 63% of Americans support raising the minimum wage to $10.10 an hour. Seventy-seven percent of Democrats supported that level, while 47% of Republicans did. Support overall declined above $10.10 an hour.

Credit Bubble Of Mass Destruction Continues To Inflate

It seems as if humans are incapable of learning from their past mistakes. Particularly, the Ivy League Economists and Governments.  

“The amount of debt globally has soared more than 40 percent to $100 trillion since the first signs of the financial crisis as governments borrowed to pull their economies out of recession and companies took advantage of record low interest rates.”

Just think about how staggering of a number that is. $100 Trillion. That is what happens when governments do everything in their power to avoid financial collapse. The problem is, any such financial collapse is brought forward by this same credit. By increasing global debt levels by $30 Trillion since 2007 top, the fools running the show have raised the stakes to unimaginable levels. When the debt collapse finally comes (as it always does), there will be hell to pay. With the bear market of 2014-2017 just around the corner, this credit bomb is about to go off. 

Did you enjoy this article? If so, please share our blog with your friends as we try to get traction. Gratitude!!!


Click here to subscribe to my mailing list

Credit Bubble Of Mass Destruction Continues To Inflate  Google

credit bubble

The stock of public debt securities reached $43 trillion in June 2013, about 80 percent higher than in mid-2007. Debt issuance by non-financial corporates grew at a similar rate, albeit from a lower base,” analysts Andreas Schrimpf and Branimir Gruic said in the report released on Sunday.

The BIS noted that since the financial crash of 2008 there has been a shift in how money is borrowed — increasingly through debt markets rather than bank lending. With the financial sector curbing lending and opting for more deleveraging, governments have issued debt in their place to kickstart their economies and bail out the financial sector.

The sheer scale of global debt markets is going to remain a very significant factor in the future, according to Bill Blain, a senior fixed income broker at Mint Partners, who predicts that it will keep growing as long as there is demand. He said that new regulations ensure that the financial sector will remain in a “trough” but governments would keep the trend going despite reining back on spending.

This rise in debt issuance only poses a problem if inflation was to rise sharply while there was still slack in the economy, according to Peter Chatwell, an interest rate strategist at Credit Agricole Corporate. This would then force central banks to tighten policy forcefully and destabilize the recovery, he added.

Schrimpf and Gruic noted that sluggish lending from the financial sector – who traditionally lend to international markets – has left a dent in cross-border investment in global debt securities. The share of debt securities held by cross-border investors either as reserve assets or via portfolio investments fell from around 29 percent in early 2007 to 26 percent in late 2012, they said.

“This reversed the trend in the pre-crisis period, when it had risen by 8 percentage points from 2001 to a peak in 2007. It suggests that the process of international financial integration may have gone partly into reverse since the onset of the crisis,” they said in the report.

This is a “headache” for policy-makers, according to Kit Juckes, global head of foreign exchange strategy at Societe Generale. Banks are increasingly drawing their business in to their home countries – a move that is not helpful for growth, and reflects investor and bank caution as a result of the great recession and the European peripheral crisis, he said.

“It isn’t healthy to see money flow less freely around the global economy, but on a positive note, this is likely to be ever so slowly reversed and normalized in the years ahead,” he said, adding that as deleveraging enters its final stages “re-globalization” instead of deeper “balkanization” would occur.

Yes, Keep Buying This Market, If You Like Losing Money

Bullish articles on the market at this stage of the game, really get me going.  “It’s full steam ahead….We are just getting started.”

What a bunch of BS.

Of course, you are free to listen to this nonsense, but keep one thing in mind. Our mathematical and timing work shows that the bull market is nearly over and the bear market is just starting. Over the next three years, the bear market of 2014-2017 will take the market much, much lower. When its all said and done investors who are buying today will lose a substantial portion of their capital.  You have been warned. 

Did you enjoy this article? If so, please share our blog with your friends as we try to get traction. Gratitude!!!


Click here to subscribe to my mailing list

Yes, Keep Buying This Market, If You Like Losing Money  Google

crazybull

American household net worth is at an all-time high, surpassing $80.66 trillion dollars, according to the Federal Reserve Bank’s latest “Z.1” release.

Of the $9.8 trillion added in 2013 alone, $2.19 trillion came from real estate while $3.85 trillion were added thanks in large part to a rising stock market; the benchmark S&P 500 index was up 29.6% in 2013, going up to 31.9% if dividends are added.

With equities being an important factor in household net worth accounting for one-sixth of total assets, will it continue to do so in the weeks and months ahead?

Andrew Busch, editor and publisher of The Busch Update, believes the market is headed higher and says the technicals for the S&P 500 prove it.

“I think what’s interesting about this move in the stock market is just how powerful it is,” says Busch. “With technical analysis, we’re always trying to figure out what patterns are out there so that we can trade off of them and make money.”

For Busch, one such pattern is that three of the S&P 500’s moving averages have been moving together well over a year now. Those moving averages are the 50-day, 100-day, and 200-day moving averages and they continued to stay more or less parallel despite the market drop in January.

“These three stack on top of each other,” says Busch, “with the top line 50, the middle one 100, and the bottom 200, meaning everything’s pointing up. Even the selloff in January couldn’t get the 50-day moving average to move below the 100.”

Busch also notes that whenever the S&P 500 would hit new highs over the past year, it would drop a little but always to a point higher than its previous drop.

“That also underscores how powerful this move up has been for stocks overall,” says Busch, who notes the January drop was to 1,773. “If we see a low below that level, then we change the pattern and then you want to start unloading some stocks. Until that happens, it’s full steam ahead.”

Chad Morganlander, portfolio manager at Sifel’s Washington Crossing Advisors, agrees with Busch’s bullish outlook on the S&P 500.

“We believe that the US equity markets for 2014 will be up perhaps 7% or 8%,” says Morganlander, who thinks the economy will show better-than-expected growth this year. “Our GDP forecast is for over 3% for 2014. And, what really drives the stock market – and, it’s about 90% correlated – is earnings. We believe S&P earnings for 2014 will be up roughly 7% to 8% and that ties into our price target.”

According to Morganlander, the economy’s growth is based on more credit, capital investment, and job creation. “We hit a pothole over the last several months,” says Morganlander, “but over the next several months, as we start to warm up and the great ‘Ice Age’ starts to melt, we’re going to start to better employment numbers and better employment data coming out.”

Time To Buy Emerging Markets?

Cheap is a relative measure. Yet, when compared to out of this world US valuations, emerging markets outlined below are indeed cheap.  

Is it time to load up? 

Not so fast. There are a few things we have to consider here. First, as the US market enters its bear market of 2014-2017, it is highly probable that emerging markets will follow the US market and get even cheaper. While the divergence is possible, based on the past, it is unlikely. Second, just because the market is cheap doesn’t mean it can’t go down further for a prolonged period of time. We  have to wait for a technical market reversal pattern before committing capital.

In conclusion, this would be a great time to start following emerging markets, waiting for a trend reversal. Once the US Market sells off and once the bear trend in emerging markets shifts, such markets will present patient investors with an amazing buying opportunity.  

Did you enjoy this article? If so, please share our blog with your friends as we try to get traction. Gratitude!!!


Click here to subscribe to my mailing list


Time To Buy Emerging Markets? Google

emerging markets

These markets are ‘mind-boggling’ cheap

Given events in Argentina, Venezuela, Turkey, and Ukraine, emerging markets are looking more like an emerging threat rather than an emerging opportunity.

However, Larry McDonald, Senior Director at Newedge, says emerging markets are a great place to find bargain investments. The usually bearish author of “Colossal Failure of Judgment” has two reasons why he thinks emerging markets are an attractive buy.

1. Seventeen weeks of outflows from emerging markets

During the first two months of 2014, $11.3 billion have left emerging market equity and bond exchange traded funds, reflecting the overall sentiment of worldwide investors. McDonald sees this as mirroring similar outflows in developed markets that subsequently rebounded significantly.

“What we’ve seen at the great market bottoms – in the United States, 2009; Europe, 2012 – [is] a surge in outflows,” says McDonald. “What’s happening now in emerging markets is historic and it’s right on proportion with the 2012 bottom in Europe and 2009 bottom in the United States.”

2. Lowest valuations for emerging markets since 9/11

Though emerging markets are considered relatively risky, particularly in this environment, McDonald believes they are being over-discounted. He believes investors worried about buying emerging market stocks should heed the words of Seth Karman, founder of hedge fund Blaupost Group, who once said, “Buying right never feels good.”

“If you look at the emerging markets now, they are trading at a great valuation with a lot of with a lot of risks in the world,” says McDonald. “On a price-to-book [basis], they’re at 1.3 times book [value]. Developed markets like Europe and the United States are well above 2.2 to 2.3 times book. But, within the emerging markets, countries like Russia are trading at half [the value] of book and that’s too cheap to pass up.”

Emerging Markets Price-to-Book
Indonesia 3.2x
India 2.6x
South Africa 2.6x
China 1.5x
Turkey 1.5x
Brazil 1.2x
Greece 1.0x
Russia 0.5

While McDonald acknowledges that fear of instability in places like Russia given the current political climate may be a reason for the deep discount to its stocks, he believes that’s overdone. As example, he points to the Market Vector Russia ETF (the RSX).

“The RSX fund has 32 million shares outstanding,” says McDonald. “On Monday, 25 million traded. That’s the type of thing you see when a biotech company misses earnings or has a failed trial. This isn’t a biotech – this is a country’s stocks – which is mind-boggling. So, I don’t think there’s anybody left to sell these names.”

5-Year Market Cycles & Weekly Update. A Must Read. Trust Me.

z15

Weekly Update & Summary: March 8th, 2014

The market continued its bull move with the Dow Jones being up +108 points (0.67%) and the Nasdaq being up +28 points (0.65%) for the week. Structurally, the market left another gap at 16360 (in addition to the one last week at 16,100). Plus, there are a number of gaps going all the way down to 15,500. All of them are to be closed during the upcoming bear market leg.   

Fundamental & Market Analysis:

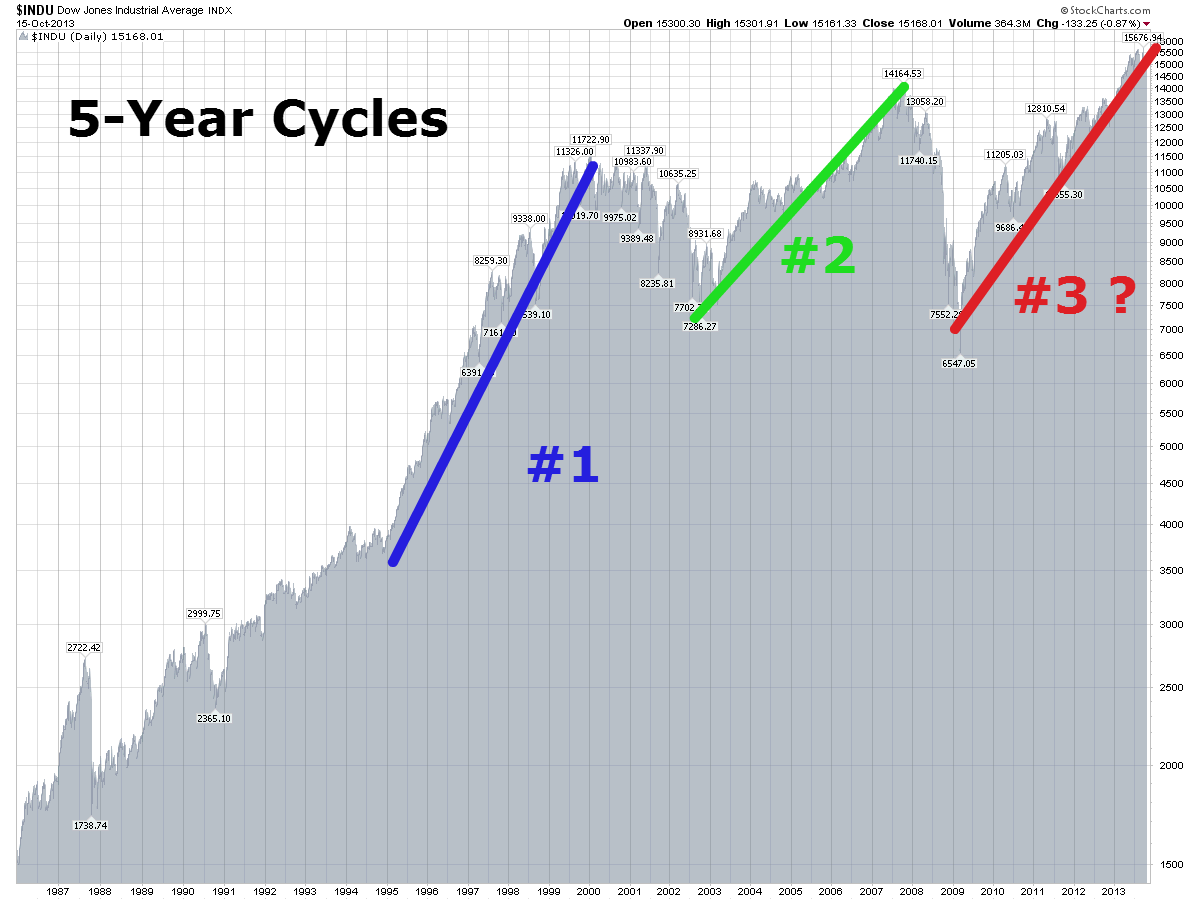
Last week we looked at the 17 year alternating Bull and Bear market cycles and why this Bear market that started in 2000 will complete itself only in 2017. Today, I would like to take a quick look at the 5-Year Cycle and the reason for today’s bull market.

Particularly, let’s take a look at the two most recent 5-Year Cycles and how they apply to today’s stock market.

Long Term Dow Cycles 5

#1: 5-YEAR CYCLE 1994 Bottom To 2000 Top.

This cycle started on December 9th, 1994 and completed on January 14th, 2000. During this time the stock market moved 8269 points in 1287 trading days. In calendar terms, the cycle took 5 Years and 36 Days to complete. We all know what happened afterwards.

#2: 5-YEAR CYCLES 2002 Bottom to 2007 Top

This cycle started on October 10th, 2002 and completed on October 11th, 2007. During this time the stock market moved 7098 points in 1259 trading days. In calendar terms, the cycle took 5 Years and 1 Day to complete. We all know what happened afterwards. 

TODAY’S-5 YEAR CYCLE  2009 Bottom to 2014 Top ?

This cycle started on October 6th, 2009 and is scheduled to complete itself on XXXX. As of today, the stock market moved 10036 points in 1260 trading days. In calendar terms, we are exactly at 5 years.  The questions here is as follows….

Are we currently developing the 5 cycle or are we in the cyclical bull market? If yes, when will this cycle top out and what’s next?

While I have the exact answer, unfortunately, that answer is available to my premium subscribers only. Please Click Here.

Now, the sample above is just two cycles. There are many more. Here are just a few from off the top of my head. 1924-1929, 1932-1937, 1961-1966, 1982-1987.  

In summary, 5-Year cycle is an incredibly important cycle and represents one completed growth cycle within the stock market. When it completes, the market tends to shift gears and change trends. In some of my earlier forecasts I have suggested that the Dow topped out on December 31st, 2013 ushering in the bear market of 2014-2017. That should make it very clear what happens next. If you would be interested in an exact breakdown, please visit our Subscriber section. 

Macroeconomic Analysis: 

The situation in Ukraine continues to escalate.

With the US, the EU and Russia throwing out insults and threatening sanctions against each other, this situation might very well become the “fundamental” tipping point for the market as early as next week. Today, I would describe the situation as a tightrope balancing act. It might die down over the next couple of weeks, but it might also escalate to unimaginable level. Fast. Whatever happens, this is not a good sign for Russia/US relationship going forward.

It would be interesting to see if the point of force described in the Mathematical & Timing section below would be the same point where things between the US and Russia escalate further.

Technical Analysis: 

The overall technical picture is clearing up.

Long-Term: The trend is still up. Market action in January-February could be viewed as a simple correction in an ongoing bull market. 

Intermediary-Term: Since February 5th, intermediary term picture shifted from negative to positive. Giving us a technical indication that both the intermediary term and the long term trends are up. Yet, that in itself can be misleading as per our timing analysis discussion below.

Short-Term: Short-term trend has turned bullish as well.

While all 3 trends are bullish, this might be misleading. Please read our Mathematical and Timing Analysis to see what will transpire over the next few weeks.    

Mathematical & Timing Analysis: 

(*** Please Note: This time around about 90% of the information contained within this section has been deliberately removed as it contain too much technical information. Particularly, exact dates and prices of the upcoming turning points. As well as trading forecasts associated with them. I deem such information to be too valuable to be released onto the general public.  As such, this information is only available to my premium subscribers. If you are a premium subscriber please Click Here to log in. If  you would be interested in becoming a subscriber and gaining access to the most accurate forecasting service available anywhere, a forecasting service that gives you exact turning points in both price and time, please Click Here to learn more.Don’t forget, we have a risk free 14-day trial). 

XXXX

Date Target: XXXX
Price Target:  XXXX

XXXX

Hence, I suggest the following positioning over the next few days/weeks to minimize the risk while positioning yourself for a forecasted market action.

If You Are A Trader: XXXX

If No Position: XXXX

If Long: XXXX

If Short:  XXXX

CONCLUSION: 

An incredibly important week is coming up. Above, I have described the point of force, various possibilities and exactly what you should do in each case. With increased volatility, multiple interference patterns and an incredibly important long-term turning point we must be very careful and risk averse here.  Those anticipating the moves and those who can time them properly will be rewarded appropriately.

Please Note: XXXX is available to our premium subscribers in our + Subscriber Section. It’s FREE to start. 

Did you enjoy this article? If so, please share our blog with your friends as we try to get traction. Gratitude!!!


Click here to subscribe to my mailing list


5-Year Market Cycles & Weekly Update. A Must Read. Trust Me. Google