InvestWithAlex.com 

Russian Markets Plunge, Central Bank Moves To Increase Rates

Russian stock market crashed today, declining 13.5% today in a near panic selling. Russian central bank moved swiftly, increasing interest rates by 150bps, the highest hike since 1998 default. The Rubble didn’t fare any better with USDRUB rising to an all time high of 37.

Will this swift market action, gut punch to the Russian economy, threat of sanctions and capital flight be enough to stop Russia or Putin in his tracks in terms of Ukraine?

That wouldn’t be our bet. As a matter of fact, if anything it will make Russia even more determined to go ahead and resolve Ukraine’s situation as they see fit. At the end of the day, Putin doesn’t place as much of an importance on capital markets and the state of the overall economy as the US does.  The more important question is, how will this action/reaction impact the US Market.

It’s very clear. Please check our timing section to find out exact what the market is going to do over the next few weeks.  

RUSSIAN MARKET

Russian markets plunged Monday morning as investors reacted to the prospect of Western-led economic sanctions aimed at punishing president Vladimir Putin for Russian actions in Crimea.

The selloff prompted the Russian central bank to take aggressive action to try to stabilize the markets. As the ruble sank to new lows against the euro and the dollar, the bank raised interest rate by 150 basis points (1.5 percentage points), lifting it to 7 per cent.

Russia’s benchmark stock market index, the Micex, got battered by 13.5 per cent at one point by near panic selling. All of the big names on the index including Gazprom, the state-controlled natural gas company whose pipelines to Western Europe run through Ukraine, fell sharply. Gazprom was down in line with the market.

Yields on Russia’s 10-year sovereign bonds rose as high as 9 per cent, up sharply from Friday’s close of 8.1 per cent, as debt investors apparently took the view that that the Ukraine crisis could escalate even if there have been no clashes between Ukrainian and Russian troops in Crimea, the largely Russian speaking region in Ukraine’s far south which is the home to Russia’s Black Sea naval fleet.

The Russian selloff came as the leaders of the Group of Seven industrialized countries, Canada among them, released a joint statement “condemning the Russian Federations clear violation of sovereignty and territorial integrity in Ukraine.” On Sunday, the G7 countries halted preparatory meetings for the G8 summit scheduled for Sochi, Russia, the host city of the Winter Olympics, in June. Russia is the eighth member of that group.

The strongly worded G7 statement indicates that the Western countries may be on the verge of launching sanctions of some sort against Russia, though no formal plan had been announced by Monday morning. On Sunday, U.S. secretary state John Kerry, who is to travel to the Ukrainian capital Kiev on Tuesday, said the Western countries are “prepared to put sanctions in place, they’re prepared to isolate Russia economically.”

In a note, Kit Juckes of the French bank Société Générale said: “This weekend’s events will be followed by a lot of uncertainty and further risk aversion as a diplomatic solution is sought….wider scale capital flight from Russia must be a risk. Russia is unlikely to back down on its support of the regional government in Crimea. The important of Ukraine as a line in Europe’s energy supply line and as the point were Russia and the European Union meet, makes the idea that either side just backs down hard to imagine, but equally, provides plenty of incentives to work towards a diplomatic solution.”

The Russian sell-off triggered a smaller selloff of equities in Europe, where the FTSE-100 and the Eurofirst 300 indexes fell by more than 1 per cent. Investors sought safety in commodities rose. Brent crude was up 1.6 per cent and gold rallied strongly, gaining 1.8 per cent, taking its value to almost $1.346 (U.S.).

Economists doubted that the Ukraine crisis would trigger a full-blown emerging market crisis because of the small size of the Ukrainian economy. It is worth 0.2 per cent of global gross domestic product. Still, some countries, notably Russia and Poland, have significant trade ties to Ukraine and Russia has the power to make or break Ukraine’s energy supplies. Ukraine depends on Russia for half of its natural gas supplies and about 20 per cent of the gas consumed in the European Union is delivered through pipelines that cross the Ukraine.

The fear among Ukrainians is that Russia will use gas supplies as a geopolitical threat. Russia has reduced out outright eliminated supplies to Russia several times in the last decade over gas pricing and contract disputes.

The Financial Times reported that, over the weekend, Russia signalled that it might use gas exports to apply pressure on the interim government on Kiev. Gazprom, the world’s biggest gas supplier, hinted that it may raise gas prices to Ukraine. In December, Mr. Putin gave Ukraine a big discount on gas supplies as part of a $20-billion bailout package (of which only a few billion dollars has been delivered). The price, however, must be renegotiated every three months.

Russian Markets Plunge, Central Bank Moves To Increase Rates  Google

The United States of Hypocrisy

Over the weekend the US Administration and the US Media, went into overdrive condemning Russia with the Secretary Of State John Kerry calling it an “incredible act of aggression” and stating “you just don’t in the 21st century behave in 19th century fashion by invading another”. Yet, let’s do a quick comparison.

RUSSIA:

  • Entered into Ukraine to stabilize the country and protect ethnic Russian’s from fascist illegitimate government now in Kiev.Not a single shot fired. Zero casualties.
  • Russian soldiers are met with excitement and flowers. Entire Army divisions and the Ukrainian navy defects to the Russian side.
  • Millions of Ukrainians are thankful for Russia trying to stabilize the region.

USA:

  • Enters Iraq under false pretenses. The US Government falsifies intelligence reports and the US media sells is to the American people like gospel.
  • Causes approximately 500,000 deaths in Iraq as direct or indirect result of the war (2003-2011)
  • Kills 4,486 U.S. soldiers in Iraq between 2003 and 2012. Tens of thousands are sent home wounded. 

So, let me ask you. Who is acting like a proverbial “Caveman” here. Oh yeah, I forgot, the US killed all of those Iraqis to bring piece, happiness, freedom and rainbows to the region.

PutinObama

LONDON (Reuters) – The rising threat of war between Ukraine and Russia sent investors scurrying for relative safety on Monday, pushing stocks down sharply – the Moscow market fell 11.5 percent – and lifting gold to a four-month high.

U.S. investors were set to add their weight to the move at the open, with stock index futures all down around 1 percent and benchmark U.S. Treasury yields down 5.5 basis points.

With Russian troops already on Ukrainian soil after an incursion into Crimea, comments over the weekend from President Vladimir Putin that he had the right to invade the rest of the country were treated as a declaration of war by Kiev.

Geopolitical ripples from those statements, which included condemnation from the Group of Seven major industrialized nations and the threat of sanctions, spread through markets, hitting Russian assets the hardest and forcing the Russian central bank to aggressively raise interest rates.

Russia’s stock market nosedived at the open and the ruble fell 2 percent to record lows against the dollar and the euro before recovering to trade up 1.4 percent after the central bank dramatically lifted its key lending rate by 1.5 percentage points to 7 percent at an unscheduled meeting.

The country’s sovereign dollar bonds were also hit, down more than 2 points, while the cost of buying 5-year swaps to insure against a Russian debt default jumped 33 basis points.

“Investors had underestimated the risks of an escalation in Ukraine, so the events over the weekend are a wake-up call for the market,” said David Thebault, head of quantitative sales trading at Global Equities in Paris.

The escalating tensions sent Ukraine’s hryvnia to a record low against the dollar and pushed the country’s dollar bonds down 6 points on Monday, in contrast to a jump in safe-haven German Bund futures, which rose 87 ticks.

No major regional stock bourse escaped the aggressive selling, with all down more than 2 percent and Germany’s DAX particularly hard hit, tumbling 3.1 percent and heading for its biggest daily fall in eight months.

That had followed overnight weakness in Asia, with MSCI’s broadest index of Asia-Pacific shares outside Japan down 0.9 percent and Japan’s Nikkei 225 skidding 1.3 percent.

“We can expect some very sharp moves in the ensuing couple of days as markets and world leaders look to establish just how much of a threat there is to not only to stability in the area but stability across Europe,” said James Hughes, chief market analyst at Alpari UK.

Among those leading regional stock fallers were the many companies, from banks to retailers, with heavy sales exposure to Russia and Ukraine.

Chief beneficiaries of the market-wide flight from risk were gold, German debt, the Japanese yen and other currencies perceived as safe havens in times of heightened volatility, while oil was supported by the demand outlook.

Concern about China’s economy also weighed on markets after a purchasing managers’ index showed China’s vast factory sector contracted again in February.

Spot gold hit a four-month intraday high of $1,350 an ounce and the dollar hit a near one-month low against the yen and approached Friday’s two-year low against the Swiss franc before recovering to trade slightly higher.

The euro, meanwhile, shed 0.3 percent against the dollar to $1.3763, slipping from Friday’s two-month high as the euro zone economy is seen as vulnerable because of its dependence on gas supplies from Russia, part of which go through Ukraine.

Worries that Putin could act to restrict those gas supplies if the situation escalates further, and the prospect of a typical run-up in demand should war break out, boosted crude prices across the board.

Brent crude, the European oil benchmark, rose as much as 3 percent to a two-month high of $112.07 per barrel, while U.S. crude futures hit a five-month high of $104.75.

“But… if it actually comes to war. U.S. crude could easily surpass $110 and a $120 target is not out of the question,” said Ben Le Brun, market analyst at OptionsXpress.

Ukraine said, however, that it was pumping Russian gas as normal.

On top of concerns about a military confrontation, it was not clear if Ukraine’s new interim government, formed about a week ago after pro-Russian former President Viktor Yanukovich was ousted, can secure funds to avoid default.

Kiev has said it needs $35 billion over two years to avoid default, and may need $4 billion immediately. But Ukrainian Finance Minister Oleksander Shlapak said on Saturday the country was unlikely to receive financial assistance from the International Monetary Fund before April.

Elsewhere, with the yield on 10-year U.S. debt off its one-month low of 2.592 percent, focus will be on the release of important economic data this week including payrolls numbers on Friday and manufacturing data later on Monday after mixed data from Asia and Europe.

A private survey of the latter in China found factory activity shrank again in February as output and new orders fell, reinforcing concerns about a slowdown in the world’s No. 2 economy.

That offset a more upbeat survey from the Chinese services sector and pushed copper down to a three-month low. China is the world’s top metals consumer and the market is already concerned about growing copper stockpiles in China.

In Europe, meanwhile, data from the euro zone showed output rose in all of the bloc’s four biggest economies for the first time in almost three years.

The United States of Hypocrisy Google

What You Ought To Know About This Secular Bear Market. Plus, Weekly Market Update.

daily chart Feb 28, 2014

Weekly Update & Summary: February 28th, 2014

The market continued its bull move with the Dow Jones being up +218 points (1.36%) and the Nasdaq being up +44 points (1.05%) for the week. Structurally, the market did very well, leaving only one gap behind….at 16,100. There are still a number of gaps going all the way down to 15,500 on the Dow, but all of them will be closed during the upcoming bear market leg.   

FUNDAMENTAL & MARKET ANALYSIS: 

During the week Charles Schwab Chief Investment Strategist, Liz Ann Sonders, claimed that the bull run stocks have enjoyed for the last five years is not over yet. According to her, “I think what started five years ago was the beginning of a secular bull market, not just a cyclical bull within an ongoing bear.”   

This is an important claim that we must discuss. This will help me explain, once again, where we are in the cycle. If you are not familiar with the terminology….

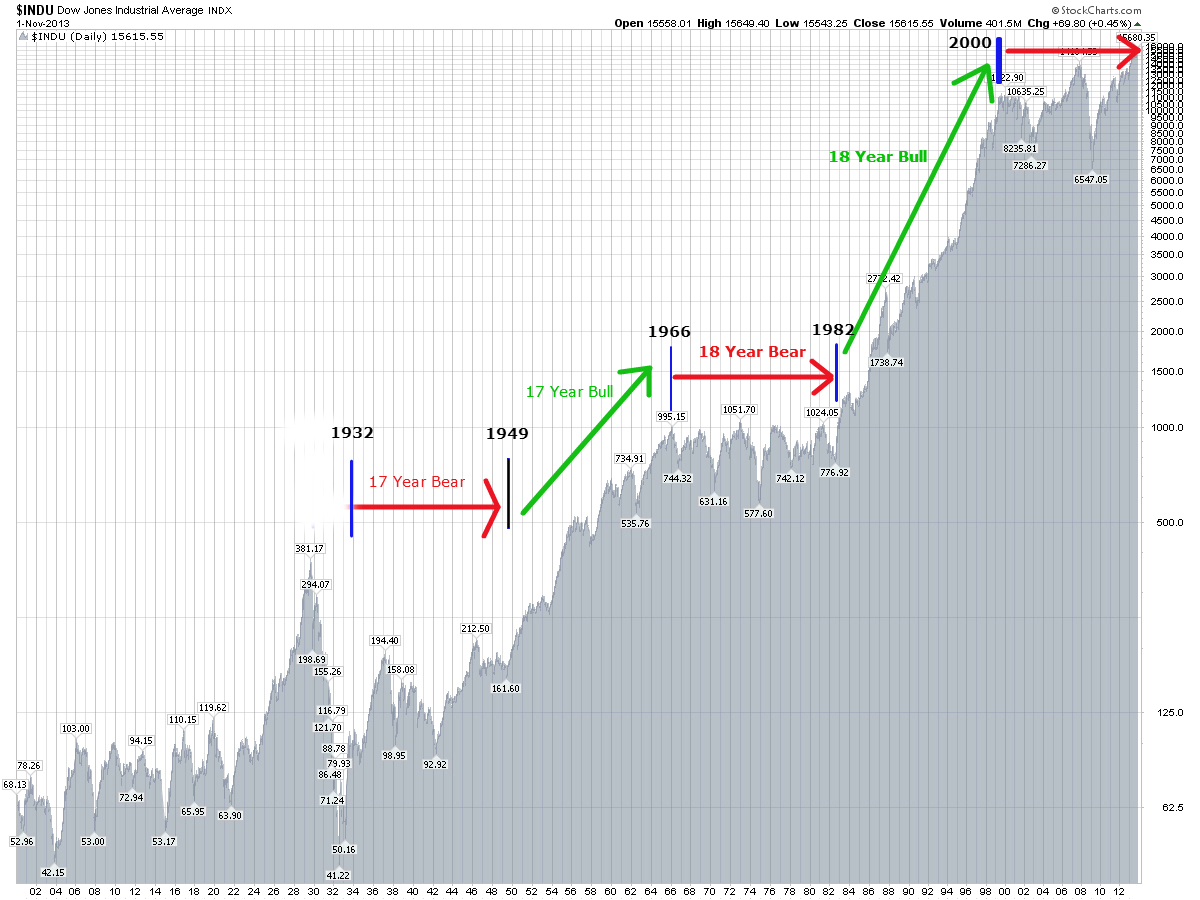
Secular Bull Market ……. is a long term bull market. For example, what we saw between 1982-2000.

Cyclical Bull Market Within Ongoing Bear…..is a bear market rally. For instance, the move between 2002/03 bottom to 2007 top.

So, what she is saying is that the bear market that started in January of 2000 is now over and that the new long term bull market started at 2009 bottom. There is just one problem with her statement.

Liz Ann Sonders didn’t do her market homework. Since the stock market officially “opened” in May of 1790 there hasn’t been a single bear market that lasted 9 years. Not a single one if you understand the cyclical composition and market structure. Why would it be different this time? It is not.

In fact,  the market oscillates in bull and bear market cycles that on average last 17-18 years. There is a reason for that, but let me illustrate instead of telling you. Let’s take a closer look

Long Term Dow Structure3

  • 1897-1914 Bear Market. (17 Years).
  • 1914-1932 Bull Market. (18 Years). * Please note, the last 3 years of this cycle 1929-32 we had a cycle inversion. I will talk about it in my future writings, for now, its outside the scope of our discussion.
  • 1932-1949 Bear Market (17 Years).
  • 1949-1966 Bull Market ( 17 Years).
  • 1966-1982 Bear Market (17 Years).
  • 1982-2000 Bull Market (18 Years).
  • 2000-2009 Bear Market ? ….I don’t think so….

As you can clearly see, bull and bear markets alternate in 17-18 year cycles. Any notion that, somehow, this bear market was only 9 years long and we are now in a cyclical bull market is ludicrous.  

This is further confirmed by my mathematical work. What we have seen between March 2009 bottom and today was a simple bear market rally, even if it did set a new high. It was a 5 year cycle (exactly the same as in 2002-2007) and it is now done. Cyclical bear markets tend to finish off with a 2-3 year down moves and that is, once again, being confirmed by my calculations.

I have stated on numerous occasions that the stock market has topped out on December 31st, 2013, ushering in the final leg of the bear market. When this bear market completes the Dow Jones will be well below it’s 2000 top of 11,800……essentially tracing out a flat move over an 17 year period of time. Exactly what a bear market should look like.

I hope this brings further awareness and understanding of where we are in this economic and market cycle. If you want more precise timing capability, please take a look at our Timing Analysis section below.

MACROECONOMIC ANALYSIS:  

One word. Ukraine.

As I have mentioned in one of my posts during the week, there is absolutely no way in hell that Russia will let Ukraine go.  What we are seeing today is indicative of that stand.  If you are not following the story, here is what had transpired.  The EU Bureaucrats and the US Government have decided that it would be a good idea to destabilize Ukraine after Ukrainian government decided to go forward with Russia instead of joining the EU or NATO.  Thus far, the western governments were successful it toppling Ukrainian President and “claiming victory”.

However, here is what even a retarded CIA/NSA analyst should understand. Russia will never let Ukraine go.  It will go to war over that territory if need be and that is exactly what we are seeing today. Obama coming out and “WARNING” Russia does nothing but infuriate Russia even more. Again, the US Government has no business in Ukraine.  Ukraine is a split nation and when Obama talks about the “Ukrainian People who want freedom and closer ties to the EU” he talks about 25% of Ukrainian population at best.  The bottom line is this, Russia will take it and no one will stop it.

Is this important? Will this impact our financial markets?  While it will not have any impact on the US financial markets  (outside the spectrum of our forecasts) it is an incredibly important geopolitical event. It is quite possible that when we look back, this event will be indentified as the beginning of the Cold War II between Russia and the West. With one big difference. Russia will have an incredibly strong partner on its side that it didn’t have last time…..China.  This is a fascinating development that will impact us all over the next few decades.

TECHNICAL ANALYSIS: 

While the overall technical picture is clearing up.

Long-Term: The trend is still up. Market action in January-February could be viewed as a simple correction in an ongoing bull market. 

Intermediary-Term: Since February 5th, intermediary term picture shifted from negative to positive. Giving us a technical indication that both the intermediary term and the long term trends are up. Yet, that in itself can be misleading as per our timing analysis discussion below.

Short-Term: Short-term trend has turned bullish as well.

While all 3 trends are bullish, this might be misleading. Please read our Mathematical and Timing Analysis to see what will transpire over the next few weeks.    

MATHEMATICAL & TIMING ANALYSIS:  

(*** Please Note: About 75% of the information contained within this section has been deliberately removed. Particularly, exact dates and prices of the upcoming turning points. As well as trading forecasts associated with them. I deem such information to be too valuable to be released onto the general public.  As such, this information is only available to my premium subscribers. If you are a premium subscriber please Click Here to log in. If  you would be interested in becoming a subscriber and gaining access to the most accurate forecasting service available anywhere, a forecasting service that gives you exact turning points in both price and time, please Click Here to learn more.Subscription is through lottery only. Don’t forget, we have a risk free 14-day trial). 

I continue to believe that March will be a very volatile month. We have a number of interference patterns in play, indicating a number of strong and powerful bull/bear moves. With that said, I believe Friday’s market action has cleared a lot of question marks. Primarily, XXXX. 

In addition, the market closed two important gaps all the way up to 16,400 that were left there in January. I have talked about these gaps on numerous occasions, suggesting that the market must close said gaps before any meaningful bear market can start. That was done today, clearing the way for the market to XXXX

While there are a number of important turning points in March (indicating interference), there is one particular price point that works very well. As such, I propose the following turning points.

Date: XXXX
Price Target: XXXX

Explanation: XXXX

Hence, I suggest the following positioning over the next few days/weeks to minimize the risk while positioning yourself for a forecasted market action.

If You Are A Trader: XXXX

If No Position: XXXX

If Long: XXXX

If Short:  XXXX

CONCLUSION: 

We have a couple of existing and challenging weeks coming up. March of 2014 presents us with numerous high probability turning points. Indicating volatility, multiple interference patterns and an incredibly important long-term XXXX. Those anticipating the moves and those who can time them properly will be rewarded appropriately. Once the moves described above play out in full, the market will be set free to continue its next cyclical bear market leg. 

Please Note: XXXX is available to our premium subscribers in our + Subscriber Section. It’s FREE to start. 

Did you enjoy this article? If so, please share our blog with your friends as we try to get traction. Gratitude!!!

What You Ought To Know About This Secular Bear Market. Plus, Weekly Market Update.  Google

Will This Stock Go Up 500% Over The Next 3 Years?

Rite Aid Corporation (RAD)

Investment Thesis Summary: Rite Aid is a “turnaround” undervalued stock with a significant upside potential.  Due to improved company fundamentals and performance the stock price is up 550% over the last 1.5 years. Yet, I believe the company’s stock continues to be undervalued. It is still far from where it could be if the company continues to execute its turnaround plans.  In fact, based on today’s valuation metrics, if Rite Aid is to approach  the valuation metrics and margins of its competitors over the next 3-5 years, Rite Aid’s stock should appreciate 2-5X from today’s price.

THE STORY:

Please click on this presentation to learn about the company, future plans and their turnaround story.

The company has a number of things going for it.

1. Aging Population

This is straight forward and self explanatory.  According to US Census Bureau the population of those 65 & Older in the US will be at 56 Million by 2020. That is about a 40% increase from today’s levels. It doesn’t take a genius to figure out that these older Americans will be visiting Rite Aid more often to buy larger quantities of drugs as they continue to age. Driving sales and profitability higher.

2. Drug Deal/Distribution

In mid February 2014 The company announced an expanded distribution agreement with McKesson (MCK), a massive drug retailer.  While this renewal is technically an expansion of their existing deal into 2019 it gives us an important clue to future growth and profitability.

The drug industry is changing. Today, most drugs are bought in massive quantities by the likes of distributors like McKesson. This gives both McKesson and Rite Aid higher pricing power and flexibility. In addition, the so called “Patent Cliff is in play. It is estimated that between 2011 and 2017 close to $130 billion worth of brand drugs will lose patent protection and become generic. When that happens, the margins for both pharmacies and drug distributors should increase further.

That is already becoming evident at McKesson where operating margins have risen from 1.63% to 2.03%  since 2011 and at Rite Aid where operating margins went from (-2.16%) to +3.76% over the same period of time. As you can see a massive jump.  As more generic drugs come on the market over the next few years, it is likely the operating margin will continue to expand.

3. Turn Around/Improved performance

rad1


rad2

Please see the presentation for other data points on turnaround and improved performance. Click Here

4. Undervaluation:

I believe that standard Intrinsic Value  Calculation/Valuation will not yield very good results in this case because the company is in the process of a turn around. To determine future valuation and  potential undervaluation  at this time, we must look at properly run competitors. Walgreen Co (WAG) and CVS Corp (CVS) in particular. We have to look at their existing valuation and assume that Rite Aid will move closer to such industry valuation metrics as it continues its turnaround plans.

The easiest way to do so is to look at  Price/Sale Ratio.  Again, the assumption here is that Rite Aid will continue to execute on its turnaround plan to reach industry metrics. Walgreen has a P/S ratio of 0.87 and CVS has a P/S ratio of 0.67

What does  it all mean?

It means that if Rite Aid continues to execute its turnaround plan and reaches industry metrics over the next 3-5 years, its stock price should be between $17.10 and $22.10. Giving us a respective yield of 158% and 233% over the next 3-5 years. With any other operating or margin improvements the return should be much higher.  

FUNDAMENTALS:

The stock is undervalued relative to today’s market.

Valuation Measures


Market Cap (intraday)5:

6.48B

Enterprise Value (Feb 25, 2014)3:

12.61B

Trailing P/E (ttm, intraday):

22.87

Forward P/E (fye Mar 2, 2015)1:

19.71

PEG Ratio (5 yr expected)1:

0.54

Price/Sales (ttm):

0.25

Price/Book (mrq):

N/A

Enterprise Value/Revenue (ttm)3:

0.50

Enterprise Value/EBITDA (ttm)6:

9.28


Financial Highlights


Fiscal Year

Fiscal Year Ends:

Mar 2

Most Recent Quarter (mrq):

Nov 30, 2013


Profitability

Profit Margin (ttm):

1.25%

Operating Margin (ttm):

3.76%


Management Effectiveness

Return on Assets (ttm):

8.32%

Return on Equity (ttm):

N/A


Income Statement

Revenue (ttm):

25.38B

Revenue Per Share (ttm):

28.01

Qtrly Revenue Growth (yoy):

1.90%

Gross Profit (ttm):

7.32B

EBITDA (ttm)6:

1.36B

Net Income Avl to Common (ttm):

280.41M

Diluted EPS (ttm):

0.29

Qtrly Earnings Growth (yoy):

15.60%


Balance Sheet

Total Cash (mrq):

183.21M

Total Cash Per Share (mrq):

0.19

Total Debt (mrq):

5.95B

Total Debt/Equity (mrq):

N/A

Current Ratio (mrq):

1.73

Book Value Per Share (mrq):

-2.31


Cash Flow Statement

Operating Cash Flow (ttm):

728.27M

Levered Free Cash Flow (ttm):

161.00M

The company financials are ugly, but getting better. If we are to look at the balance sheet, income statement and the cash flow statement the desire to invest is likely to disappear. However, we must be aware that by the point the financial statements will reflect improvement and return to stability, the stock price is likely to complete most of its climb.

What is the Intrinsic Value?  Too many variables and unknowns to calculate here. I believe the values provided in the “Undervaluation” section above make a lot more sense in this particular situation.

TECHNICAL:  

riteaid

As you can see, the technical picture is incredibly strong here. Since its bottom 1.5 years ago, the stock has appreciated over 550% with no signs of a technical slow down and/or a reversal.  Giving us an indication that most investors believe the turnaround story is developing (at this time) as this report suggests.

CONCLUSION, TIMING & POSITIONING:

XXXX

Please Note: XXXX is available to our premium subscribers in our + Subscriber Section. It’s FREE to start. 

Did you enjoy this article? If so, please share our blog with your friends as we try to get traction. Gratitude!!!

Will This Stock Go Up 500% Over The Next 3 Years?  Google

Real Estate Collapse 2.0 Why, How & When

 infographic 2 - real estate - main picture

If you ever want to ascertain the primary psyche of the American culture, just watch 1 hour of TV, paying particularly close attention to the commercial breaks.  Here is what “The Man Behind The Curtain” wants you to do. The worst part is… most people seem to comply.  

First, you must go to college, get a massive student loan and get a bunch of credit cards. After you graduate, buy your girlfriend a giant diamond ring, get married and she will love you forever.  Then buy a house, a new car, start a family, get a dog and drink a lot of beer.  Of course, the overwhelming pressures associated with all of the above will grind you into the ground. But not to worry, our top notch pharmaceutical and medical industry got you covered.  Bonner pills, ADD pills, depression pills,  high blood pressure pills, surgery and who can forget ….adult diapers.  And that’s your future, in a nutshell.  

In all of the above, one thing stands out. There is nothing more prevailing in the American culture than the notion that any self respecting, reasonable American with half a brain should own his/her own house. If you don’t, you are viewed as a failure. Now, before I destroy that notion with a few simple calculations and tell you why the housing market is going down the drain again (yes, it’s happening right now), please allow me to destroy the notion of home ownership with some simple common sense.

Reason #1: You Will Never See Your $50-100K Cash Down Payment Again:

Let’s say you are a responsible member of society and instead of getting Interest-Only-No-Down-Payment-I-Am-Never-Going-To-Pay-It-Back Loan, you get a typical 30-Year fixed with 20% down payment. In fact, you have worked incredibly hard and saved up $50,000 – $100,000 to do just that. Congratulations. However,  the stupidest think you can do next is to buy a house and get a mortgage. If you do, kiss that money goodbye. Under today’s monetary conditions you are never going to see it again.

“But Alex, my realtor is telling me that buying a house right now is an opportunity of a lifetime….if I don’t do it now, I will never be able to afford it again, recovery is here, the prices are about to go through the roof, blah, blah, blah…”  – Everyone.

Well, unless your realtors name is George Soros or Warren Buffett, tell your realtor to go pound sand.  What we have experienced between 1994-2007 in the real estate sector is not only atypical, but is truly once in a lifetime. More on that later, but if you are lucky enough to sell the house you buy today at a breakeven, you will still not see the down payment again. It will simply roll over into your next house.  From my point of view it is a lot better to invest that money into your future as opposed to park it in an illiquid asset that is likely to lose at least 50% of its value over the next 2 decades.  

Reason #2: Closing Costs, Maintenance & Property Taxes:

Finally got that house of your dreams?  Great, now bend over and take it like a man. Everything in this house will break down over the next 20 years and it will cost you a boatload of money to maintain.  Throw in closing costs and property taxes and you talking about real money.  Realtors themselves estimate you should budget about $8,000-$12,000 annually on a $500,000 house. Sure, there is an interest deduction on your taxes, but typically (based on your family’s tax structure) the costs above are never fully recovered.

housing bubble

Reason #3: It’s Not An Investment:

Stop saying that your house is an investment. Just stop. It’s a debt burden, not an investment.  Investments produce income and pay dividends. Your house doesn’t do either unless and until you rent it out.  Yes, your house can exhibit capital appreciation, but that is not an investment either. That is more accurately defined as a speculation.  What we saw during the housing boom was just that. Speculation.  Household incomes didn’t go up 500% between 1994-2007, but house prices did.  People who were in the real estate sector simply got lucky. Now, it’s time to ride this Cho Cho Train down.  

Reason #4: Your House Is A Trap:

Got that house of your dreams in The City of Compton, California? Congratulations, you are now trapped.  Even if you get a $100K job offer to wax dolphins in Fiji, you won’t be able to take it. You will be tied down and unable to sell your house at break even. Particularly over the next 2 decades and that is exactly where “Corporate/Government Interests” want you to be. They don’t want you to have the ability to move and get a better job elsewhere. They want you to be tied down, “to have roots”, to be paid less. That wouldn’t be the case if you could increase your salary 25-100% by simply picking up your things and moving across the country. 

And that’s just a few of the points. I can keep going, but I think you get the point. The housing myth is just that….a carefully crafted marketing message.  

Now, let’s get to the best part.

Here are the reasons why you should be mentally committed if you are even thinking about buying a house. Plus, why you should sell your house NOW if you are misfortunate enough to OWN one.

First, you must understand where we are and the cause/effect behind today’s market.

UNDERSTANDING THE HOUSING MARKET, ECONOMY, SPECULATION AND DRIVERS BEHIND BOTH.

Yes, I called for the real estate crash and credit collapse as early as 2005. While my call was a little bit early and premature, eventually it was right on the money. Now, I am saying that the housing crash is not over. 

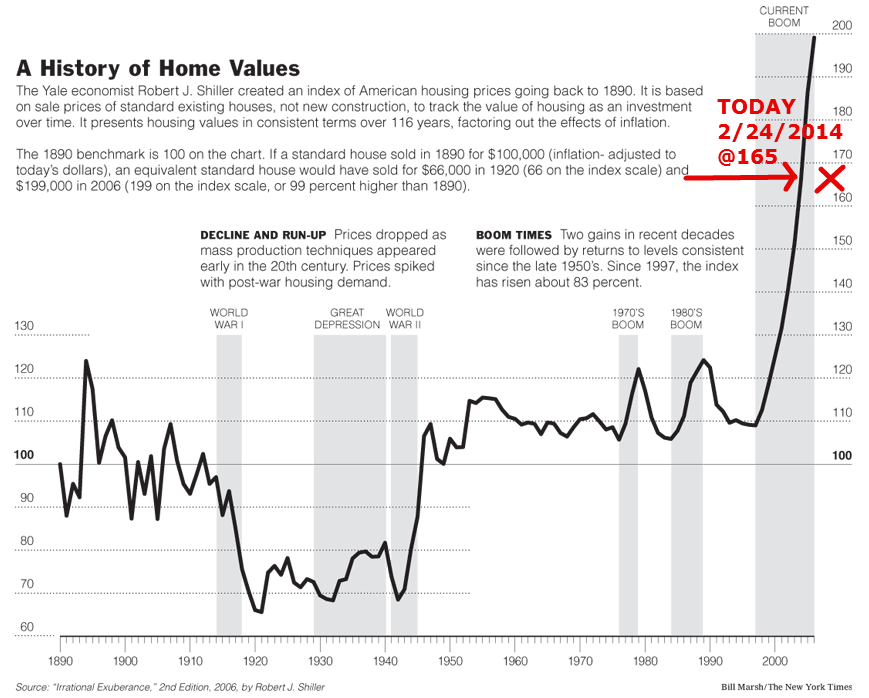
Before we can understand where we are now and where we are going in the future we must understand where we came from. The Real Estate run up that we have experienced between 1997-2007 has no historical  precedent.  Real estate data going all the way back to 1890 clearly shows that the US housing market basically appreciated at the rate of inflation.  Yes, there were some bubbles and substantial declines, but overall, appreciation at the rate of inflation is an appropriate way to look at the US real estate sector.
us-history-home-values

A QUICK HISTORY LESSON:

All of that changed in 1997 when Bill Clinton signed The Taxpayer Relief Act into law, basically allowing $250,000 in tax free capital gains in real estate.  While real estate was already appreciating at a good clip at that time, that law added fire to the trend. 

Later,  fearing significant economic slowdown in 2002-2003 the Bush administration added a huge amount of jet fuel to the Real Estate Bubble by cutting interest rates and making mortgage finance available to everyone (yes, even to the dead people).  As people used to say, if you can fog a mirror you can get a mortgage. Of course, all of that led to the largest finance bubble in the history of mankind that “kind of” melted down in 2007-2009. I say “kind of” because most of those excesses are still within our financial system and will have to be worked through in the future.  

WHERE ARE WE NOW?

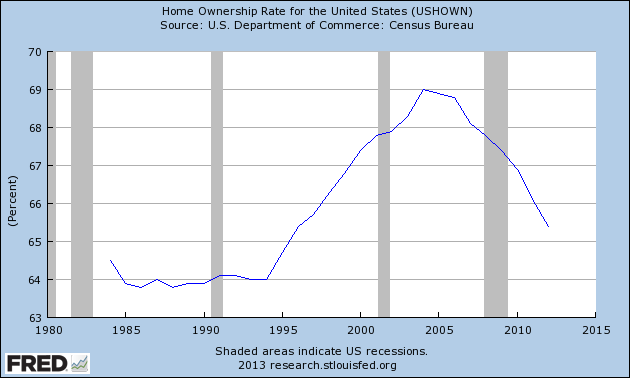
Issue #1: US Home Ownership Rate Is Plunging

On historical basis, home ownership rate in the US is in free fall. Take a look at the chart. I think it speaks for itself.  
USHOWN_Max_630_378

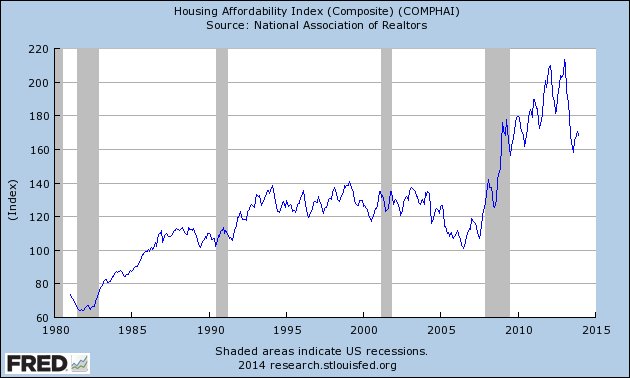
Issue #2: Real Estate Affordability Is Plunging

Take a look at the chart as it speaks for itself. The affordability index is in free fall as well. Most certainly, due to higher interest rates and rising prices. fredgraph111
Issue #3: Interest Rates Are Going Up             

The trend has shifted up and the 10-year rate is up 100% over the last 12 months. I gave detailed interest rate analysis here. Please take a look here.

Issue #4: US Economy & The Stock Market Is About To Turn Down (Big Time)

This has been the primary trend in our blog since inception. Based on our mathematical and timing work the stock market will go through a bear market between 2014-2017. Pushing the US Economy back into a severe recession.  To learn more about the upcoming bear market please Click Here and read the report.  With further job losses , lower incomes and an economic contraction it would be impossible for the real estate sector  to sustain any sort of a rebound. On the contrary, as the economy tanks real estate prices are bound to collapse further.

Issue #5: Who Is Buying All Of These Properties For Cash Today?

Chinese buyers, hedge funds, banks themselves, investors, speculators, etc…..  Who cares!!!  Remember all those Japanese investors buying everything they could in California and Hawaii in the late 1980′s. I wonder how that turned out for them.

In one of my previous reports I have outlined how large hedge funds, including Blackstone Group, are buying tens of thousands of real estate properties across the nation. With some hedge funds and financial institutions going to the extreme and investing in the likes of plumbers and dentist to help them find and manage properties(Click Here To Read). In Las Vegas alone 70% of real estate purchases over the last year have been done by investors. If all of this doesn’t not scream out “Market Top” at you, I really don’t know what will.
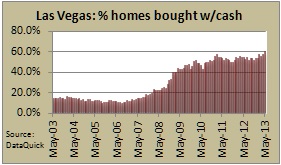
las-vegas-home-buyers-with-cash1

On a more serious note, notice that I didn’t say Average American Family. That is the only category that we should track if we want to accurately predict the future trend in the US Real Estate market. Every other category is irrelevant over the long run.  And guess what? They are not buying. See the charts above. 

Issue #6: Bear Market In Real Estate (sucks people back in)

As I have said in one of my previous posts (US Real Estate At A Turning Point), this is how the bear market works. This is the stage #2 bounce, before the big decline (stage #3).  The bear market tends to suck people back in, offer them perceived safety and a high return before slamming the door, ripping their head off, drinking their blood and taking all of their money. The US Real Estate market is topping in Stage #2 run up here. That is why you are seeing so many divergences. The market should turn down soon. Beware.  

Dead-cat-bounce-graph-yahoo-finance

FUTURE OF REAL ESTATE:

Real estate is not made of Gold.  There is a tremendous amount of land available in California, Florida, Nevada and all over the US.  There is no housing shortage. As such, expect real estate to decline significantly in order to revert back to its natural inflation adjusted mean. It might take a few years, it might be different for various cities, but one way or another the market will get there.

BubbleBurst investwithalex

HOW FAR DOWN?

Let’s do very simple math for the San Diego market.  It doesn’t have to be exact for our purposes.

Setup:

  • San Diego Median Family Income: $61,500
  • As Per Various Financial Guidelines Families Shouldn’t Spend More Than 30% Of Their Income On Housing.  That means a $1,500/monthly payment.
  • Median Home Price in San Diego: $425,000
  • Interest Rates: 30 Year Mortgage 4.35% (Rates as of 2/21/2014) 

With such fundamental input variables median house value should be $300,000 -OR – A 30% DECLINE     ($1,500x360month@4.72%)

What if interest rates go to 7% over the next 5 years, which can easily happen? 

The fundamental value of the median house drops further to $225,000 -OR- A 47% DECLINE

Also, don’t forget that markets oftentimes overshoot to the bottom, just as they set blow off tops. In such a case I wouldn’t be surprised to see a median price of $150,000- 200K -OR- A 65%-50% DECLINE

You say impossible….. I say study financial markets. Nothing is impossible. Here is another way to look at this. Have household incomes increased 500% over the last 20 years? Nope. They have barely moved. Therefore, real estate decline in excess of 50% would simply return the prices to their inflation adjusted base.

TIMING:

In one of my earlier reports I Am Calling For A Real Estate Top Here I clearly outlined the fundamental reasons of why the real estate market has peaked and is now in the process of rolling over. I continue to believe that the nationwide real estate prices are in the process of setting in a top. Since real estate is local, it is much more difficult to identify exact tops. As such, we must go back to the stock market in order gage a better understanding of WHEN the real estate market will tank.

Typically, the stock market foreruns the actual economic recession by 6-12 months. In other words, the stock market prices break down 6-12 months before Economic Data confirms a recession. While real estate prices, in theory, should start breaking down in conjunction with the stock market, that is not always the case. As such, it would be prudent for us to say that the housing prices will start breaking down 6-9 months after the start of the bear market in stocks.

As you know, it has been my claim (based on my mathematical and timing work) that the stock market topped out on December 31st, 2013 ushering in the final leg of a cyclical bear market. If such is the case, we can safely assume that we will start seeing drops in real estate prices sometime in the summer of 2014. Once the market rolls over and confirms, we should see a significant acceleration to the downside in real estate price over the next 3 years (at least).

With that said, we already starting to see evidence that the housing has topped. Please see volume data from RedFin.com below. As always, the volume of sales is first to go. Prices tend to follow. 
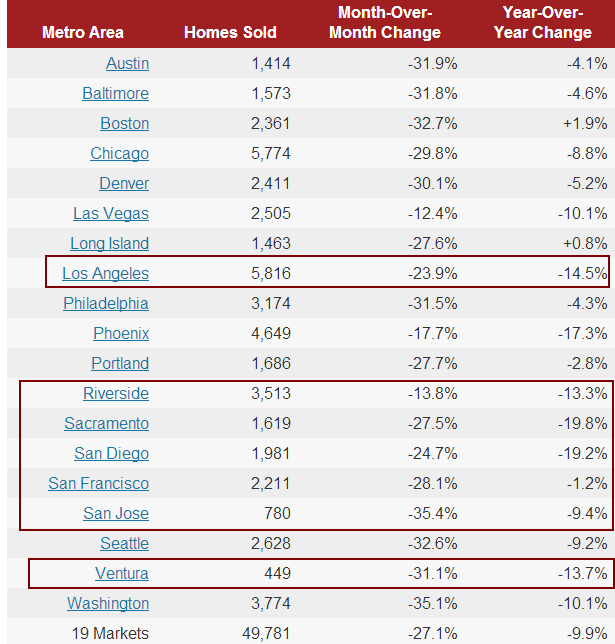
california-sales

WHAT SHOULD YOU DO?

That part is somewhat simple. If you do not own a home and thinking about buying one…..just DON’T do it.  You will save a lot of cash (and your down payment) by renting and waiting for the market to come down over the next few years.

If you already own a home the situation is a little bit tricky. Listen, I am no fool and understand that your house is a home and is important for family formation/structure. If you are happy with you home and could care less what is going on in the real estate market……stay put. However, if you are thinking about selling your home, right now would be a great time to do so.

If you own rental properties that generate positive cash flow and they are not in any way tied into the upcoming real estate decline, keep them. If you are buying investment and/or rental properties as a “speculation” in hopes of capital appreciation or a “flip” you are better off liquidating all of your positions (right now) and getting out. 

CONCLUSION:

Now, I understand and agree that there are various market forces at play that make the picture a lot more complicated. Interest rates, timing, mortgage finance, cash buyers, the FED, foreign buyers, speculation, location, supply/demand, etc….    However, fundamentals will always prevail over time. Everything else is just temporary BS. 

Did you enjoy this article? If so, please share our blog with your friends as we try to get traction. Gratitude!!!

Real Estate Collapse 2.0  Why, How & When Google

Make No Mistake, Russia WILL Go To War Over Ukraine. Plus, Market Update

Update: Russian troops and tanks enter Ukraine @ Sevastopol. So it begins. 

Well, the American Government and the EU Bureaucrats have done it again. They have “liberated” the people of Ukraine from oppression and injustice. I wonder if there were high fives flying in the Oval Office over the weekend.  

Yet, as the Chinese story goes “Maybe it’s good and maybe it’s bad, we shall see”.

I have said it before, but I need to say it again so people have a clear understanding.  The US and the EU destabilizing and interfering in the business of Ukraine is equivalent to Russia destabilizing and trying to take over the government of Kentucky.  Technically speaking, Russia and Ukraine is a unified state going back thousands of years.  I would argue that it is idiotic at best and extremely dangerous at its worst for the western world to interfere in Russia’s and Ukraine’s business.

Luckily, I am not alone in thinking this way. Here is an open letter from Ron Paul: “Leave Ukraine Alone”

What most people don’t understand is this…… Russia and Putin in particular will never allow Ukraine to become a part of EU or worst NATO. They will go to whatever extent necessary to make sure that doesn’t happen. Even if it means going to war.  Also, it is only half of the Ukraine (western half, the poorer half) wanting closer ties with the EU. The other half (wealthier industrial eastern part) wants nothing to do with it. They want to have closer ties with Russia.  So, when American politicians scream out “Ukrainian People Want Freedom From The Tyranny of Russia”  they are talking about 25% of Ukraine’s population. Either way you twist it, this is a ticking time bomb.  

With Olympics now over, Russia has a lot more room to maneuver.  It will be interesting to see what develops over the next few weeks. I see 2 outcomes.

1.  In the past, Russia and Putin have proved to be good strategists. They might give an indication that they are stepping aside by allowing the EU and World Bank to try and bail Ukraine out by pumping billions of dollars into Ukraine’s economy.  Over the next few years, through various political actions and economic positioning Russia will, once again, replace Ukraine’s leader with their own “puppet” as they have done so many times before.  Of course, Western powers will never see their money again.  This is the most likely outcome and exactly what I would do.  

2.  However, if Russia is pushed too hard and too far, they WILL sanction and execute some sort of a military action in Ukraine.  With the EU and the US interfering in its business, Russia might literally have no other choice.

Which option will play out? Only time will tell, but I wouldn’t be surprised to see some sort of military intervention over the next few weeks.  Will Obama draw his “Red Line” again and send in the Marines to protect newly liberated Ukrainian people?  Yeah right. I truly feel sorry for the Ukrainian people who believe that the West will come to their rescue. 

One thing is for sure.  Neither the US nor the EU have any business interfering in this part of the world. Doing so might lead to an all out conflict with Russia and a new Cold War.  Unfortunately, it looks as if it is exactly what some of our leaders want.

russian022412

MARKET UPDATE:

The market surged higher right at the open with the Dow Jones appreciating +103 point (0.64%) and with the Nasdaq gaining +29 points (0.69%) for the day. 

With most speculative issues appreciating the most, the question I see from a lot of the bears anticipating a collapse….. Is this is the “blow off” top? As I have mentioned so many times before, the bear market of 2014-2017 will not be directional. While it will have a general down trend, it will not present us with a directional move as it did between 2007-09. That means a lot of volatility and a lot of powerful ups/downs that will surely confuse and frustrate both bulls and bears. With that said, what does it say of today’s market?  

Our last inflection point was located at……. XXXX.

Not quite yet. This market is certainty not making things easy for our trading position as it continues to push upper ranges of what is possible if February XXXX was indeed a turning point.

There is couple of reasons for my hesitation. 

1. All indices have opened up a gap in the morning. Typically, the market comes back to close this gap over the next few trading days. While the market can do so during the next leg down, it closes it within the next 3 trading days 70% of the time. Indicating a high % possibility of a short-term decline. 

2. My calculations show an alternative top at today’s top of XXXX. It is hard to explain, but at times the market produces gaps within its own mathematical structure. It might be the case here.

In summary, it’s too early to call the market either way. While it is pushing upper boundaries, it is possible….. XXXX.

What are we to do?

Maintain our positions as described below while watching the market on an hourly chart. If the Dow breaks above XXXX we must nullify our XXXX top. If that is the case, the market is likely to continue higher. Not much higher, but high enough to close the gap that was left at 16,400 on the Dow.

If No Position: XXXX

If Long: XXXX

If Short/Trader:  XXXX

Please Note: XXXX is available to our premium subscribers in our + Subscriber Section. It’s FREE to start. 

Did you enjoy this article? If so, please share our blog with your friends as we try to get traction. Gratitude!!!

Make No Mistake, Russia WILL Go To War Over Ukraine. Plus, Market Update Google

Warning: The US Economy Is Flying Blind…About To Crash

janet yellen investwithalex

Over the last couple of years I have argued, sometimes passionately, that the Federal Reserve doesn’t really know what is going on within our own economy and our financial markets. Not only that, but I have also argued that they are a bunch of idiots and fools who believe that they can somehow control our financial markets.

If recently released transcripts, generated during the 2008 meltdown don’t prove my point of view without a shadow of a doubt, I don’t know what will. Here are just a few quick points from the said transcripts.

  • They didn’t even realize recession was happening until the 4th quarter of 2008. By that point the stock market has completed 80% of its down move.  In fact, for most of 2008 they thought the recession “could be avoided”.

—-Hello???? Was anyone home??? Recession started in Q4 of 2007.

  • Bernanke talked about pent-up demand for housing as late as January 2008.
  • Bernanke was worried about inflation as late as January 2008.
  • Throughout Q1 of 2008 they have held a generally rosy view of the world and the US Economy

Here are the links to two great articles about the transcripts if you would like to learn more. Click Here and/or Click Here

bernanke meme

The lesson here is twofold.

First, anyone who believes that the FED can either control, anticipate or predict financial markets and/or the economy is even a bigger fool.  Neither Bernanke nor Yellen can predict the economy even if it hit them in the face with a brick. All they can do is look at past data and say “Oh, look, according to this data recession started in Q4 of 2007”. What a waste of time and money.  

Second, they will always be behind the ball. They will always be a reactionary force as opposed to market makers. Take today’s environment for example. They are cutting QE and talking about raising the interest rates at exactly the wrong time. The damage from their crazy liquidity party has already been done. The worst thing they can do now is cut it. The faster they do it the faster the markets will collapse.  

Why is any of this important?

Well, if you rely on FED to make money in the stock market and/or run your own business it becomes incredibly important. As such, no one should rely on any action by the FED as an investment indicator. It is as simple as that.

This brings us to financial markets and my premise that financial markets behave exactly as they should. Many people would argue that it was the FED’s actions that put the bottom in at the March of 2009 juncture, ensuring a subsequent and massive stock market rally.

WRONG.

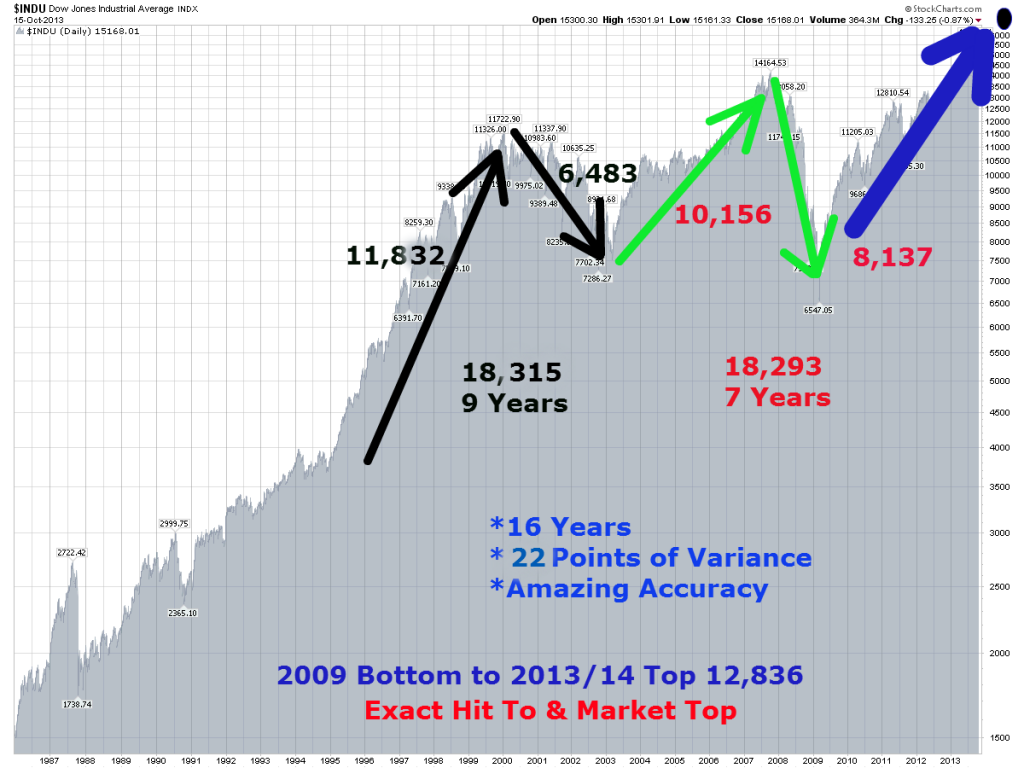
Don’t confuse cause and effect. It was the market that made the FED’s look good and not the other way around. The market was structured to bottom on March 6th, 2009 at 6,469 and then have a subsequent 5-year market rally. It was the mid-cycle bottom (half point of bear market) and I predicted it as early as January of that year. I was 1 day and 100 points away. Close enough. I know I have shown this chart before, but let’s take another look.

Long Term Dow Structure35

If you perform the type of 3-dimensional analysis that I do you would know that the move between 2003 bottom and 2009 bottom would be IDENTICAL to the move between 1994 bottom and 2002 bottom. And so it was, exhibiting a variance of 22 3-dimensional units (equivalent to a few trading days or 100 points).

Any analyst working with this information would know that as soon as 2007 top was confirmed that the next move down would be exactly 8,130 3-dimensional units. Once the market developed further, the same analyst would be able to pin point the exact bottom with amazing precision and that is what I want you to understand without a shadow of a doubt. The stock market is not volatile or random, it is exact and precise.

Same thing applies to today’s market. In last week’s forecast I identified a turning point in February. While I am not yet at liberty to discuss this turning point (available to premium subscribers only), it clearly explains the market action we have witnessed over the last couple of days. By concentrating on mathematics and 3-dimensional analysis one can pick out turning points with a precision of a surgeon.

It is just my hope that the points above will force you to re-examine your reliance on the FED while eliminating your sense of false security. 

Did you enjoy this article? If so, please share our blog with your friends as we try to get traction. Gratitude!!!

Warning: The US Economy Is Flying Blind…About To Crash Google

Idiots At The Gate. Plus, Weekly Stock Market Update & Forecast

daily chart Feb 22, 2014

Weekly Update & Summary: February 22nd, 2014

The market remained relatively flat for the week with the Dow Jones losing -51 points (-0.32%) while the Nasdaq gained 19 points (+0.46) Structurally, the market did very well, closing all the gaps during the span of the week.  There is still a gap left around 15,500 on the Dow, but it will be closed during the subsequent bear market leg.   

Fundamental & Market Analysis:

Over the last couple of years I have argued, sometimes passionately, that the Federal Reserve doesn’t really know what is going on within our own economy and our financial markets. Not only that, but I have also argued that they are a bunch of idiots and fools who believe that they can somehow control our financial markets.

If recently released transcripts, generated during the 2008 meltdown don’t prove my point of view without a shadow of a doubt, I don’t know what will. Here are just a few quick points from the said transcripts.

  • They didn’t even realize recession was happening until the 4th quarter of 2008. By that point the stock market has completed 80% of its down move.  In fact, for most of 2008 they thought the recession “could be avoided”.

—-Hello???? Was anyone home??? Recession started in Q4 of 2007.

  • Bernanke talked about pent-up demand for housing as late as January 2008.
  • Bernanke was worried about inflation as late as January 2008.
  • Throughout Q1 of 2008 they have held a generally rosy view of the world and the US Economy

Here are the links to two great articles about the transcripts if you would like to learn more. Click Here and/or Click Here

bernanke meme

The lesson here is twofold.

First, anyone who believes that the FED can either control, anticipate or predict financial markets and/or the economy is even a bigger fool.  Neither Bernanke nor Yellen can predict the economy even if it hit them in the face with a brick. All they can do is look at past data and say “Oh, look, according to this data recession started in Q4 of 2007”. What a waste of time and money.  

Second, they will always be behind the ball. They will always be a reactionary force as opposed to market makers. Take today’s environment for example. They are cutting QE and talking about raising the interest rates at exactly the wrong time. The damage from their crazy liquidity party has already been done. The worst thing they can do now is cut it. The faster they do it the faster the markets will collapse.  

Why is any of this important?

Well, if you rely on FED to make money in the stock market and/or run your own business it becomes incredibly important. As such, no one should rely on any action by the FED as an investment indicator. It is as simple as that.

This brings us to financial markets and my premise that financial markets behave exactly as they should. Many people would argue that it was the FED’s actions that put the bottom in at the March of 2009 juncture, ensuring a subsequent and massive stock market rally.

WRONG.

Don’t confuse cause and effect. It was the market that made the FED’s look good and not the other way around. The market was structured to bottom on March 6th, 2009 at 6,469 and then have a subsequent 5-year market rally. It was the mid-cycle bottom (half point of bear market) and I predicted it as early as January of that year. I was 1 day and 100 points away. Close enough. I know I have shown this chart before, but let’s take another look.

Long Term Dow Structure35

If you perform the type of 3-dimensional analysis that I do you would know that the move between 2003 bottom and 2009 bottom would be IDENTICAL to the move between 1994 bottom and 2002 bottom. And so it was, exhibiting a variance of 22 3-dimensional units (equivalent to a few trading days or 100 points).

Any analyst working with this information would know that as soon as 2007 top was confirmed that the next move down would be exactly 8,130 3-dimensional units. Once the market developed further, the same analyst would be able to pin point the exact bottom with amazing precision and that is what I want you to understand without a shadow of a doubt. The stock market is not volatile or random, it is exact and precise.

Same thing applies to today’s market. In last week’s forecast I identified a turning point in February. While I am not yet at liberty to discuss this turning point (available to premium subscribers only), it clearly explains the market action we have witnessed over the last couple of days. By concentrating on mathematics and 3-dimensional analysis one can pick out turning points with a precision of a surgeon.    

Macroeconomic Analysis: 

In a nutshell, Ukraine, Venezuela, Argentina and China. Argentina is on a verge of another default and I wrote about it before. Ukraine and Venezuela are both in the midst of violent revolutionary uprisings. While Venezuela will not have that much impact either way, Ukraine’s situation will have vast repercussions across the globe. Maybe not in economic terms, but certainly in geopolitical risk. All because of Russia. Having been born in Russia, let me tell you something. Russia is pissed off….big time.

They are pissed at a blatant American and EU interference into Russia’s business. Yes, Ukraine is Russia’s business. Always was and always will be. Just to give you a reference point, there would be a similar type of a reaction from the US if Russia was interfering in governance of Kentucky. Now, let’s take the “Ukranian people deserve freedom too and the US will go to any length necessary to see it happen” bullshit off the table. If you believe this crap, I have a $20 million bridge to sell you (give me a call).

What you see happening is the beginning of the next Cold War where both the US and Russia keep tearing into each other. With the only winners being the politicians and the military industrial complex. This is a negative development that should be watched carefully going forward. 

China’s shadow lending system continues to expand at breakneck speeds. No-one really knows for sure how big a problem China’s economy will eventually face due to the massive credit and money supply growth over the last few years. Since 2008 financial meltdown in particular. While no one has the real numbers, some of the estimates coming out of China are truly mindboggling. For instance, that China’s banking sector is now roughly the size of the US banking sector. With one primary difference. It took the US over 100 years of trial and error to get to that size, it took China roughly 5 years. Thus far China has been able to keep trouble at bay, but this is unlikely to continue much longer. Some sort of a blow up in China is imminent.

Technical Analysis: 

While the overall technical picture continues to remain murky, the resolution should be just around the corner.

Long-Term: The trend is still up. Market action in January-February could be viewed as a simple correction in an ongoing bull market. 

Intermediary-Term: Since February 5th, intermediary term picture shifted from negative to positive. Giving us a technical indication that both the intermediary term and the long term trends are up. Yet, that in itself can be misleading as per our timing analysis discussion below.

Short-Term: Is somewhat bearish. Please view our mathematical and timing analysis below for further understanding and explanation.

Mathematical & Timing Analysis: 

(*** Please Note: About 75% of the information contained within this section has been deliberately removed. Particularly, exact dates and prices of the upcoming turning points. As well as trading forecasts associated with them. I deem such information to be too valuable to be released onto the general public.  As such, this information is only available to my premium subscribers. If you are a premium subscriber please Click Here to log in. If  you would be interested in becoming a subscriber and gaining access to the most accurate forecasting service available anywhere, a forecasting service that gives you exact turning points in both price and time, please Click Here to learn more.Don’t forget, we have a risk free 14-day trial). 

Last week we concentrated on February XXXX, as a turning point. Here is the forecast that was provided.

Date: XXXX
Price: XXXX

Thus far, the vertical rally that started on February 5th ran into a brick wall. To be exact, the Dow topped out 1 hour into trading on February 19th at 16,225 and then proceeded to collapse 200 points.  Recovering thereafter and subsequently oscillating without going anywhere.  

So, what is going on? Have we hit our turning point?

XXXX

Hence, I suggest the following positioning over the next few days/weeks to minimize the risk while positioning yourself for a forecasted market action.

If You Are A Trader: XXXX  

If No Position: XXXX 

If Long: XXXX

If Short:  XXXX. 

CONCLUSION: 

We have an existing couple of weeks coming up. The week of February 24-28th should finally confirm February XXXX as a turning point. In March, we should see a number of big and very important turning points. I will start talking about them once the current stock market action resolves itself. Those anticipating the moves and those who can time them properly will be rewarded appropriately. Once the moves described above play out in full, the market will be set free to continue its next cyclical bear market leg. 

Please Note: XXXX is available to our premium subscribers in our + Subscriber Section. It’s FREE to start. 

Did you enjoy this article? If so, please share our blog with your friends as we try to get traction. Gratitude!!!

Idiots At The Gate. Plus, Weekly Stock Market Update & Forecast Google

Who Is Killing The JP Morgan Bankers? Plus, Market Update

As they say, real life is sometimes stranger than fiction. If you haven’t been paying attention, a number of high profile bankers have committed “suicide” over the last 30 days. Mostly, by “jumping” from the rooftops of their office towers. Seven of them to be exact (please see the list below) With three of them being from the JP Morgan Chase.

So, is there something in the air that is forcing these otherwise wealthy bankers at the prime of their career to commit suicide? Did we have a 1929 style market crash or is that a new termination policy at the major banks? Am I missing something here? 

Any notion that all of the said bankers have committed suicide is laughable. Take Richard Talley for instance, who ended up shooting himself 8 times with a nail gun in both torso and head. How is that even possible?  Plus, with multiple connections between the dead bankers, particularly those working at JP Morgan Chase, something doesn’t add up.  

Recently Madoff acknowledge that top brass at JP Morgan knew about his Ponzi scheme for over 10 years. Letting it go on and collecting massive fees in the process. This was part of a $2 Billion settlement JPM reached a few months back. So, is JPM terminating its own employees or is this a hit ordered by someone? 

Here are my two cents. I don’t think JPM has anything to do with this, but I do believe the people in question have found themselves on the wrong side of a trade or they have screwed someone. Big time. Perhaps an organized crime group, maybe a government. Basically, they took someone’s money (whether legitimately or not) and that someone put a hit on them. Simple as that. Just another point of reference that Wall Street is turning into a war zone. 

The lesson for Wall Street bankers is as follows. Next time you screw most of the world out of billions of dollars (mortgage backed meltdown), there might be people, organizations or governments out there crazy enough to put a hit out on you.

One thing is for sure, dead bankers don’t talk. 

jpmorgan_man on ledge

List of dead bankers

-Li Jie – 33 year old investment banker at JP Morgan jumped to his death from the roof of the bank’s headquarters in Central Hong Kong yesterday. Witnesses said the man went to the roof of the 30-storey Chater House in the heart of Hong Kong’s central business district and, despite attempts to talk him down, jumped to his death.


– On January 26, former Deutsche Bank executive Broeksmit was found dead at his South Kensington home after police responded to reports of a man found hanging at a house. According to reports, Broeksmit had “close ties to co-chief executive Anshu Jain.”


– Gabriel Magee, a 39-year-old senior manager at JP Morgan’s European headquarters, jumped 500ft from the top of the bank’s headquarters in central London on January 27, landing on an adjacent 9 story roof.


– Mike Dueker, the chief economist at Russell Investments, fell down a 50 foot embankment in what police are describing as a suicide. He was reported missing on January 29 by friends, who said he had been “having problems at work.”


– Richard Talley, 57, founder of American Title Services in Centennial, Colorado, was also found dead earlier this month after apparently shooting himself with a nail gun.


– 37-year-old JP Morgan executive director Ryan Henry Crane died last week.


– Tim Dickenson, a U.K.-based communications director at Swiss Re AG, also died last month, although the circumstances surrounding his death are still unknown.


MARKET UPDATE: 

2/20/2014 A strong rally from yesterday’s bottom with the Dow Jones appreciating +93 points (0.58%) and the Nasdaq climbing 29 points  (0.70%). 

Today is the perfect example of why we should wait for a market confirmation before committing to either going long or going short. Has anything changed since our proposed turning date of XXXX….. 

(*** Please Note: About 75% of the information contained within this section has been deliberately removed. Particularly, exact dates and prices of the upcoming turning points. As well as trading forecasts associated with them. I deem such information to be too valuable to be released onto the general public.  As such, this information is only available to my premium subscribers. If you are a premium subscriber please Click Here to log in. If  you would be interested in becoming a subscriber and gaining access to the most accurate forecasting service available anywhere, a forecasting service that gives you exact turning points in both price and time, please Click Here to learn more.Don’t forget, we have a risk free 14-day trial). 

Hence, I suggest the following positioning over the next few days/weeks to minimize the risk while positioning yourself for a forecasted market action.

If No Position: XXXX

If Long: XXXX

If Short: XXXX

Please Note: XXXX is available to our premium subscribers in our + Subscriber SectionIt’s FREE to start. 

Did you enjoy this article? If so, please share our blog with your friends as we try to get traction. Gratitude!!!

Who Is Killing The JP Morgan Bankers? Plus, Market Update Google