InvestWithAlex.com 

Stock Market Update, December 19th, 2013

  December 19,2013 chart

Summary: Continue to maintain a LONG/HOLD position. 

The stock market continues to push higher, setting new daily highs in the process. The trend is most definitely up.  As such, there is no change in our overall position for the time being. As my mathematical work clearly shows and as I have stated numerous times here, the bear market will start in 2014. If you would like to know the exact date of the turn, I will make that information available in early 2014. 

For now, the market continues to linger around its all time highs. My previous updates and various fundamental issues associated with the market remain right on the money. Please click on the links below to see them. 

November 22nd Report

November 15th Report. 

November 8th Report.

November 1st Report.

As we continue to hold our long position while waiting for the market reversal, right now might be a good time to start thinking about how you would liquidate your holding and/or re-allocate your capital once the bear market of 2014-2017 starts.

If you would like to take it one step further, this is a good time to start researching SHORT opportunities.  

Did you enjoy this article? If so, please share our blog with your friends as we try to get traction. Gratitude!!!  


  Stock Market Update, December 19, 2013

The Secret Behind This Stock Market Run Up

 CNBC Writes: Smart Money: Smart money? Looks like it’s mom and pop

Happy bull investwithalex

For the most recent leg of the rally, it seems like the so-called smart money may not be so smart after all.

If that’s true, the smart money has been losing.

Employing even more conventional wisdom, that might suggest the market is forming a top and ready to fall, as retail investors are often thought of as the last ones to a rally.

That thinking, though, is getting challenged.

There’s no doubt the retail investor has warmed up to the market in 2013 after sitting out much of the gains since the March 2009 lows. The mom-and-pop crowd ripped just short of $300 billion out of mutual funds from the 2009 low point through the end of 2012 even as the market gained more than 110 percent during the span.

Read The Rest Of The Article

As I have mentioned in my previous posts, the overall BULLISH psychological backdrop is now at the extreme and flashing warning signs.

Various metrics aside, I see very few bears.  Even people who used to be bears and now bulls.  All popular media is overwhelmingly BULLISH. Even if the article mentions “a possible drop” such argument is immediately counter attacked by stating something to the tune of “If the market drops it would be a wonderful buying opportunity to add more stocks”.

The article above is no different. It clearly illustrates how bullish everyone is. It’s a well known fact that Retail investors are the last ones on/off and as such could not be considered as “smart money”. Over 200 years of market data teaches us that. Yet, somehow the article twists it to be so.  Simply put, neither the market nor investors can do wrong in this market.

Will this continue? I do remember seeing similar type of prevailing BULLISH psychology before, at 2000 and 2007 tops. We all know how that ended. 

Did you enjoy this article? If so, please share our blog with your friends as we try to get traction. Gratitude!!!   

The Secret Behind This Stock Market Run Up 

Warning: The Bear Makret Is Coming. Top In Early 2014

Bloomberg Writes: Stock Funds Lure Most Cash in 13 Years as Market Rallies

 money flowing investwithalex

Investors are pouring more money into stock mutual funds in the U.S. than they have in 13 years, attracted by a market near record highs and stung by bond losses that would deepen if interest rates keep rising.

“The timing of retail investors tends to be terrible,” said Jonathan Pond, an independent financial adviser in Newton, Massachusetts, who oversees $200 million. The deposits may be a contrarian indicator of a market near a top, he said.

Jeremy Grantham, chief investment strategist at Boston-based money manager Grantham Mayo Van Otterloo & Co., told clients in a letter this week, “We will have the third in the series of serious market busts since 1999.” BlackRock Inc. Chief Executive Officer Laurence D. Fink said this month that stocks may decline as much as 15 percent because of political risks in China, Japan, France and the U.S.

Read The Rest Of The Article

As the melt up in the stock market continues, retail investors are the last ones to join the party. As always. As the article indicates, last time we had similar inflows was at the end of 1999 and early 2000 or right before the tech collapse and the subsequent recession.

I would go even further and suggest that today’s investor psychological backdrop is identical to that of 2000 top.  For example, even though multiple high performing investors did spot the technology bubble and have tried to warn the others, for the most part they were completely ignored until it was too late.  It was the “NEW” economy the old guard did not understand.  Today’s environment is identical, except one fact. Instead of it being the NEW economy, today most markets participants believe that the FED can control the economy and its interest rates. That is of course a mirage that they will pay for dearly. Overall, the bullish sentiment is off the charts. As always, retail investors will lose the most as soon as the bear market kicks in.

As I have stated so many times before, the bear market will start in March of 2014 and will take 3 years to complete. While it will not be a violent move to the downside, it will shave off about 30-50% from today’s market prices over the next few years.  You have been warned.  

Did you enjoy this article? If so, please share our blog with your friends as we try to get traction. Gratitude!!!  

PIMCO Shares a Valuable Tip

CNBC Writes: Gross: The stock market and asset prices are ‘bubbly’

 drastically-overpriced-investwithalex

Bill Gross, the co-chief investment officer of Pimco, said he thinks the stock market and “all asset prices are bubbly.”

“Bond prices, stock prices … and profit margins are bubbly to the extent that [if] any of them can be sustained, I guess, is the ultimate test,” Gross said on CNBC Wednesday.

He said the Federal Reserve‘s QE program is a “rather blunt instrument in terms of elevating, and perhaps, bubbling stock prices.”

“Margin debt is at historic levels to the extent that they want to simmer down equity prices [but] they don’t have to attack it through tapering … they can raise margin requirements.”

“The bond market is bubbly because the policy rate at 25 basis points is artificially suppressed. Investors and savers are not receiving what they have historically … in historical terms would probably be around 2 to 2.5 percent,” he said.

I have very little to add here. Mr. Gross is right on the money. I have been saying this for a while as well, everything is overpriced. Big time. The only thing I will add into the mix is my timing and mathematical work. Once again, it is predicting the beginning of a severe Bear Market that will only end  in 2016. There is no stopping it. 

Did you enjoy this article? If so, please share our blog with your friends as we try to get traction. Gratitude!!! 

Timing The Market & Advanced Cycle Analysis (Part 6)

 oscillation

Continuation of part 5….

PRIMARY CYCLES WORKING IN THE STOCK MARKET

(Please note that it took me a considerable amount of time to work out the cycles and their appropriate allocation. After reading this section, I would highly encourage you to perform your own cycle analysis to confirm the cycles below. Doing so will give you a better level of understanding and reassurance.)

Market Cycle #1: 5-Year Cycle. This cycle represents the primary trend in the stock market. In fact, this cycle had been mentioned earlier in this book when it was indicated that this particular cycle represents major long-term movements in the stock market. For example, 1982 to 1987, 1994 to 2000 and 2002 to 2007 are ALL represented by this exact five year cycle. Typically this cycle moves 5-years up and then 5 years down.

Internally, this cycle moves in the following fashion. Five years up and five years down. During the bull market the cycle moves 2 years up-1 year down-2 years up and during the bear market 2 years down-1 year up – 2 years down.  Because this cycle represents the primary trend in the stock market, an analyst who is working with this cycle would have to multiply the composite created by the cycles below by the five year cycle in order to create an accurate representation of the stock market.

Market Cycle#2: 52-Months Cycle. This cycle moves bottom to bottom every 52 months. Meaning the bull phase is represented by the first 26 months and the bear phase is represented by the following 26 months.

Market Cycle#3: 27-Months Cycle. This cycle moves bottom to bottom every 27 months. Meaning the bull phase is represented by the first 13.5 months and the bear phase is represented by the following 13.5 months.  

Market Cycle#4: 18-Month Cycle. This cycle moves bottom to bottom every 18 months. Meaning the bull phase is represented by the first 9 months and the bear phase is represented by the following 9 months.

Market Cycle#5: 13-Month Cycle. This cycle moves bottom to bottom every 13 months. Meaning the bull phase is represented by the first 6.5 months and the bear phase is represented by the following 6.5 months.

The cycles above represent the longer term moves in the market. However, as mentioned before cycle analysis can be applied to any time frame. An analyst working with shorter time frames (daily/hourly) would just have to narrow down the window of analysis in order to figure out the short term cycles and their relevant application to the stock market. When done, these shorter term cycles must be added into the composite above.  Doing so will produce a very accurate composite on both the long-term and the short-term time frames.

To be continued……

Did you enjoy this article? If so, please share our blog with your friends as we try to get traction. Gratitude!!! 


Timing The Market & Advanced Cycle Analysis (Part 6)

What Everyone Is Ought To Know About The Upcoming Real Estate Meltdown

Bloomberg Writes: Pending Sales of Existing Homes Slump by Most in Three Years

 housing crash investwithalex

Fewer Americans than forecast signed contracts to buy previously owned homes in September, the fourth straight month of declines, as rising mortgage rates slowed momentum in the housing market.

The index of pending home sales slumped 5.6 percent, exceeding all estimates in a Bloomberg survey of economists and the biggest drop in more than three years, after a 1.6 percent decrease in August, the National Association of Realtors reported today in Washington. The index fell to the lowest level this year.

Mortgage rates last month reached two-year highs and some homeowners are reluctant to put properties up for sale as they wait for prices to climb, leading to tight inventories. Those forces are pushing some would-be buyers to the sidelines and slowing the pace of recovery in real estate, giving Federal Reserve policy makers reason to delay reducing stimulus when they meet this week.

Read The Rest Of The Article Here

On October 3rd, 2013 I put my foot down and made a gutsy call. I have called for a housing top at the time. You can read the article here. I Am Calling For A Real Estate Top Here

Even though most people have dismissed this forecast I continue to stand by it. As new data points for the real estate market continue to come in, it looks as if I have made the correct and exact call. Yes, certain markets will roll over and start going down a little bit later, but the overall market is starting to look top heavy here. I would expect to continue seeing weakness over the next few quarters until we begin to see clear indications that the real estate market is heading down. At that time a lot of people will freak out and we should see a real inventory spike followed by even lower real estate prices. Of course this cycle will feed on itself for a long time.

Remember, this will be the 3rd leg down for the real estate sector. The first one was the initial decline between 2007 and 2010. Typically, 3rd legs down are longer and steeper. As such one shouldn’t be surprised to see large drops in housing prices over the next few years. As my previous valuation work here showed, overpriced markets like So. Cal should and could go down as much as 50%. 

For now we wait and see as the housing market continues its rolling over process.  

Did you enjoy this article? If so, please share our blog with your friends as we try to get traction. Gratitude!!!  

What Everyone Is Ought To Know About The Upcoming Real Estate Meltdown

Warning: If You Listen To Financial Media…You Will Lose Money

CNBC Writes: Dow could rise 10 percent or more in 2014: Siegel

bull investiwthalex

Wharton School professor Jeremy Siegel told CNBC on Monday that the Dow Jones Industrial Average (Dow Jones Global Indexes: .DJI) could rise 10 percent or more in 2014.

That may not be on par with this year’s roaring return but is still historically robust, he said, considering that 2013 has been an “extraordinary year” for stock gains.

“I think they are going to kick the [budget] can down the road a whole year,” Siegel said. “So that’ll be off our plate and that will be a very, very positive factor [for] first-quarter 2014.”

Read The Rest Of The Article

This post is to quickly remind you of two very important facts.

1. Most financial media is worthless. Half the time they don’t even know what they are talking about.  They continuously recycle worthless stories that have no impact on financial markets or individual stocks. As I have said many times before, news do not drive stock prices. I want you to be aware of that.

2. Never listen to teachers when it comes to real world applications. Most of them have the theory down, but that’s it. They do not have what it takes to be on Wall Street. If Mr. Siegel knew anything about the markets he would be managing money and making millions of dollars each year. Instead he teaches. Those who can…do and those who can’t….teach.

Anyway, what kind of garbage is this…..only 10%?  Why not 50% or 100%. Might as well just say that. As a matter of fact, any number will do.  The point I am trying to make and the secret I am sharing is this…..

If you listen financial media and/or take advice from those who do not directly participate in the financial markets, your money and you shall soon be separated.  

Okay, I am done bitching for today. 

Did you enjoy this article? If so, please share our blog with your friends as we try to get traction. Gratitude!!!  


Warning: If You Listen To Financial Media…You Will Lose Money

Timing The Market & Advanced Cycle Analysis

Continuation of part 4

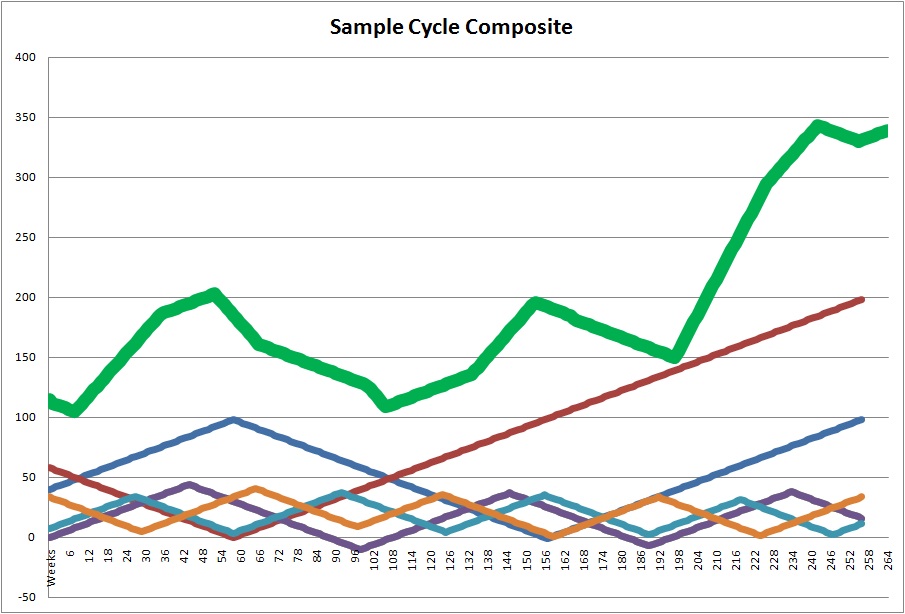
Let us study a sample market composite to gauge full understanding.  

Sample Cycle Composite

This chart requires a little bit of explanation in terms of being able to mimic the actual stock market.

  1. The chart above represents a sample  market composite over a 5 year period of time.
  2. Please note 5 separate cycles located under the green line. Each line of different color represents a different cycle working over that period of time. Note that these cycles vary in amplitude, and most importantly, in spacing. While some cycles are moving up, others are moving down.
  3. As these cycles move over time they interact with each other by either diluting each other or by amplifying energy in any particular direction.  For instance, major bull moves on the green line occur when most cycles are pointing up.
  4. As you can see from the chart, all of these cycles started at different points in time.
  5. The Green Line is the composite cycle of all cycles coming together. It is the summation of all of the moves, either up and down. By combining cycles in such a fashion we come close to mimicking the actual stock market move over that period of time.
  6. The chart above is one step removed from getting the exact composite. That is done by multiplying the composite above (green line) by the main trend at the time. When we do that  properly, we end up with an extremely accurate representation of the stock market.

For instance, an analyst working with this composite would know not only the structure of the upcoming market, but the exact turning points and the length/velocity of any upcoming move. When done with precision, the final output of the composite above should mirror the actual market movements with scary accuracy. Of course, the same type of analysis can be applied to individual stocks. Before we can put together an actual real life composite, it is important that we first take a look and study all of the major individual cycles.  

To be continued…..

Did you enjoy this article? If so, please share our blog with your friends as we try to get traction. Gratitude!!!  

Timing The Market & Advanced Cycle Analysis 

The Secret Behind The 5-Year Cycle & The Bear Market Of 2014

Dow Jones Long Term Chart 2

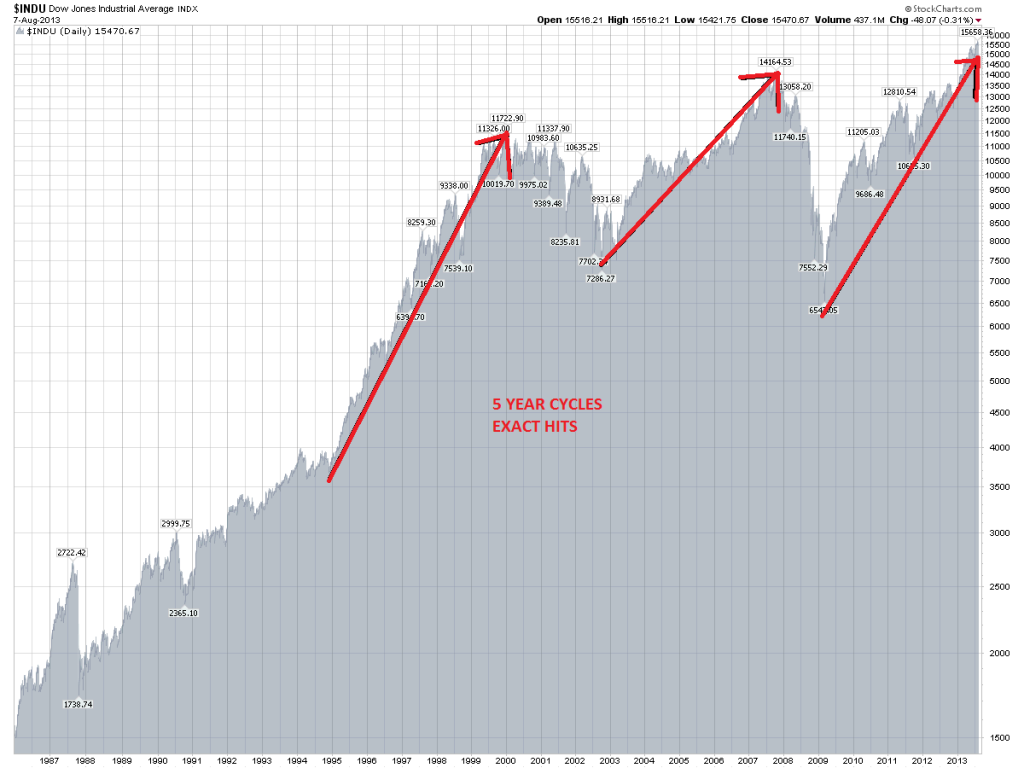
There is a prominent 5 Year stock market cycle that oscillates between the bull and the bear markets. While the cycle does show up as a bear cycle at various points, for the most part this cycle is more clearly identifiable during the bull stage. Let’s take a quick look. More importantly, let’s see what does this cycle can tell us about the future. (We are looking at the DOW)

  1. 1982-1987 From 1982 bear market bottom to pre crash 1987 the cycle lasted exactly 263 week and moved up 1977 points. That is exactly 5 Years + 10 trading days.
  2. 1994-2000 From 1994 bottom on 11/23/1994 to 01/14/2000 the market advanced 8296 points in exactly 1298 trading days. So, this cycle lasted 5 Years +32 trading days.
  3. 2002-2007 From 2002 bottom  on 10/10/2002 to 10/11/2007 top the market advanced 7209 points in exactly 1259 trading days or EXACTLY 5 years.
  4. 2009-2013/14  From 2009 bottom on 03/06/2009 to 9/18/2013 (or march 2014)  the market advanced 9241 points in 1144 days (so far).

AMAZING, isn’t it? I mean we are talking about exact hits. Bottom to top. If you go back and study the market before 1982 you will find the same cycle showing up again and again. The slight deviation by a few trading days at the end of each cycle is caused by other cycles arriving around the same time. Just by knowing this one 5 year cycle you can predict what the market will do and beat 95% of the pros.  

Now, let me warn you. This cycle is not as easy as just timing the 5 year period of time. There is something behind the scenes that causes this cycle to happen. As of right now, I cannot discuss what causes this in the public forum, but the chart above doesn’t lie. Just more prove that the market can be predicted to the day.

I confirm that another 5 year cycle has indeed started at March 2009 bottom. It is due to complete in March of 2014. However, my other work is showing that the DOW has probably already topped in September of 2013.  There is a lot of interference right now.  

As such, this leads me to believe that the DOW will oscillate here over the next few months until some sort of a top is set in March of 2014 (maybe a little bit higher or lower than September 2013 top). Thereafter, the market should resume its bear market and go down hard into the 2016/17 lows. 

Did you enjoy this article? If so, please share our blog with your friends as we try to get traction. Gratitude!!! 


The Secret Behind 5-Year Cycle & The Bear Market Of 2014

Warning: The Markets Can Easily Be Predicted

Bloomberg Writes: The Enduring Mystery of Financial Markets

Future-Predicting-InvestWithAlex 

Unfortunately, decades after the three economists had their groundbreaking insights, the crucial question remains unanswered: Can policymakers know with any certainty when markets are dangerously out of line, and is there anything they can do about it?

Economists can’t be expected to predict the future. But they should be able to identify threatening trends and to better understand the conditions that can turn a change in prices into a financial tsunami.

Read The Rest Of The Article Here

Once again, I do not understand why everyone claims that it is so hard to do. The Economy and its bubbles are very easy to see and predict.  For example, you could have looked at 2002-2007 period and have easily determined or came to a conclusion that there was a huge real estate and mortgage finance bubble developing.  When it would collapse, it would take down the entire economy, multiple financial institutions and our financial markets.

No crazy or complicated economic models needed. This is fairly basic and common sense stuff. Same thing applies to today’s environment. While the majority of the economist do not see any present issue either in the economy or the financial markets, they are there.  The majority of economic growth and market recovery over the last couple of years has been driven by an insane amount of credit pumped into our economy by the Fed through a multitude of channels.

Now the economy and the financial markets will have to pay for such a mismanagement by dropping over the next few years (as my timing work indicates). As the Fed perpetuates this cycle of boom and bust by dumping a lot of credit into the economy I remain puzzled why it is so hard to see by most economist and others participating in the financial markets. If you take conflict of interest out of the picture, this becomes very basic. 

Did you enjoy this article? If so, please share our blog with your friends as we try to get traction. Gratitude!!! 

Warning: The Markets Can Easily Be Predicted