InvestWithAlex.com 

Warning: The Machines Are Coming After Your Job

Bloomberg Writes: A Computer Might Come After Your Job Next

terminator-investwithalex
I am taking your job


First it won at “Jeopardy.” Now it might threaten millions of low-wage jobs. At least, that seems to be the implication of a Bloomberg News article on International Business Machines Corp.’s Watson supercomputer.

Developers are now figuring out how to use Watson’s processing power to replicate the experience of working with an “experienced in-store salesperson” when shopping for clothes. The software would combine databases provided by retailers with customer preferences for style and fit to help people find what they’re looking for.

If it works, this technology would be a boon for everyone who prefers to buy things from the comfort of home. Right now, only a small percentage of shopping occurs online. Shipping costs could be one reason. Another is that many people are hesitant to buy things over the Internet when they can’t try them out first, especially clothing. That reticence could be overcome by these new technologies. If a computer knew your body shape and knew the dimensions of each piece of clothing, it could show you exactly how items would fit.

Read The Rest Of The Article Here

As we move deeper into the 21st century, technological changes continue to accelerate. One thing that fascinates me as an investor is what type of an impact machines (computers and robotics) will have on the future of the labor force and by default, the overall economy.

I believe both robotics and enhanced computer systems  are already having a significant impact on the overall labor force. It is difficult to measure, but in many sectors of the economy improved productive means fewer jobs. While I don’t believe it is having an impact on the overall rate of employment just yet,  within a few decades things might be drastically different. Imagine a world where robotics take most (if not all) lower skill manual or blue color type of jobs at the cost of $0.5-2 an hour.  What happens when enhanced computer system get so good that they start to squeeze out white color work force at the fraction of the cost. To be honest with you, I have no idea.

Many will argue that this is a normal economic shift that will create more and better jobs in other sectors of the economy. Perhaps it will, but I don’t see how. This change is very different from the industrial and the low level technology revolution that preceded it.  Given  expected massive worldwide population growth I don’t see where the future high paying jobs will come from.

Does that mean a lower overall standard of living?  Once again, not necessarily. It might mean a better standard of living for future generations. One thing is for sure. This is a trend worth watching as it will impact our lives over the next few decades more than we can imagine. 

Did you enjoy this article? If so, please share our blog with your friends as we try to get traction. Gratitude!!! 

Stock Market And 3-Dimensional Analysis (Part 3)

Continuation of part 2

Click To Enlarge
Click To Enlarge

For simplicity sake, here is all you need to know. When we apply lattice structure thinking to the existing stock market structure, we soon realize that the most common derivatives are the 2x and the square roots of 2, 3 and 5. The next step in our analysis would be to calculate these derivatives for each one of our 3-DV determined above.  We do so for both upside and downside by multiplying and dividing each value.  The calculations are very simple.

For example, lets figure out derivative for the move AC of 14,100

(ORIGINAL 3-DV 14,100)

Multiply

Divide

SQRT 2

19,940

9,970

SQRT 3

24,421

8,140

SQRT 5

31,528

6,305

2X

28,200

7,050


What do these numbers represent?

They represent all possibilities of the next move.  Basically, we know that the next move (starting at point C) will either be 14,100 or the other 8 numbers representing  the derivatives of the original number above. This helps us determine the next turning point with stunning accuracy. For instance, please note that the move CE  (the move between 2003 bottom and 2009 bottom) was exactly 9,810 points. The square root of 2 derivative above stands at 9,970. This represents a 1.6% variance from the actual value.  Fairly accurate if you ask me.  Particularly if you know the exact structure and the direction of the move years before it happens.

Further, at the time of this writing (November 26th, 2013) the 3-DV of the move CF (2003 bottom to 2013/2014 top) is sitting at 20,050 and thus far has had an exact hit of 19,935 if you take 2013 September top into consideration. While I will not make exact predictions in this book, this gives you an indication of how powerful this 3-Dimensional analysis can be.

For example, in my other writings I have clearly indicated that the 2013/2014 tops will be the completion of the bull move that started at 2009 bottom.  After the move completes itself we should experience a 3 year bear market that will take us into the 2017 bottom. As you now can see, by looking at the market through the 3-DV analysis we can predict with great accuracy when the top of 2013/2014 will take place.  For example, just by looking at this one 14,100 3-DV alone (or its derivative of 19,940), we know that the market is toping right now and should reverse itself shortly.   

To Be Continued…..

Did you enjoy this article? If so, please share our blog with your friends as we try to get traction. Gratitude!!!  

Stock Market And 3-Dimensional Analysis (Part 2)

WARNING: The US Real Estate Prices Are About To Decline 45-70%

I HAVE OFFICIALLY CALLED FOR A REAL ESTATE TOP ON OCTOBER 3rd, 2013. CLICK HERE TO SEE

housing bubble


Yes, I called it perfectly in 2006-2007 and now I am saying that it is not over. 

Before we can understand where we are now and where we are going in the future we must understand where we came from. The Real Estate run up that we have experienced between 1997-2007 has no historical  precedent.  Real estate data going all the way back to 1790 clearly shows that the US housing market basically appreciated at the rate of inflation.  Yes, there were some bubbles and substantial declines, but overall, appreciation at the rate of inflation is an appropriate way to look at the US real estate sector.

real estate 1 investwithalex


A QUICK HISTORY LESSON:

All of that changed in 1997 when Bill Clinton signed The Taxpayer Relief Act into law, basically allowing $250,000 in tax free capital gains in real estate.  While real estate was already appreciating at a good clip at that time, that law added fire to the trend. 

Later,  fearing significant economic slowdown in 2002-2003 the Bush administration added a huge amount of jet fuel to the Real Estate Bubble by cutting interest rates and making mortgage finance available to everyone (even to the dead people).  As people used to say, if you can fog a mirror you can get a mortgage. Of course, all of that led to the largest finance bubble in the history of mankind that “kind of” melted down in 2007-2009. I say “kind of” because most of those excesses are still in the financial system and will have to be worked through in the future.  


WHERE ARE WE NOW?

Issue #1: US Home Ownership Rate Is Plunging

On historical basis, home ownership rate in the US is in free fall. Take a look at the chart. I think it speaks for itself.  

homeowership-rate-investwithalex 

Issue #2: Real Estate Affordability Is Plunging

Take a look at the chart as it speaks for itself. The affordability index is in free fall as well. Most likely due to higher interest rates and rising prices. 

Housing Affordability Index


Issue #3: Interest Rates Are Going Up             

The trend has shifted up and the 10-year rate is up 100% over the last 12 months. I gave detailed interest rate analysis here. Please take a look here.


Issue #4: US Economy & The Stock Market Is About To Turn Down (Big Time)

Please read “The Long Awaited US Stock Market Decline Is Likely Here” as to why.


Issue #5: Who Is Buying All Of These Properties For Cash Today?

Chinese buyers, hedge funds, banks themselves, investors, speculators, etc…..  Who cares!!! Remember all those Japanese investors buying everything they could in California and Hawaii in the late 1980’s. I wonder how that turned out for them.

On a more serious note, notice that I didn’t say Average American Family. That is the only category that we should track if we want to accurately predict the future trend in the US Real Estate market. Every other category is irrelevant over the long run.  And guess what? They are not buying.  See the charts above. 


Issue #6: Bear Market In Real Estate (sucks people back in)

As I have said here before (US Real Estate At A Turning Point), this is how the bear market works. This is the stage #2 bounce, before the big decline (stage #3).  The bear market tends to suck people back in, offer them perceived safety and a high return before slamming the door, ripping their head off, drinking their blood and taking all of their money.  The US Real Estate market is topping in Stage #2 run up here. That is why you are seeing so many divergences. The market should turn down soon. Beware.  


FUTURE OF REAL ESTATE:

Real estate is not made of Gold.  There is a tremendous amount of land available in California, Florida and all over the US.  There is no housing shortage. As such, expect real estate to decline significantly in order to revert back to its natural inflation adjusted mean. It might take a few years, it might be different for various cities, but one way or another the market will get there.

BubbleBurst investwithalex


HOW FAR DOWN?

Let’s do very simple math for the San Diego market.  It doesn’t have to be exact for our purposes.

Setup:

  • San Diego Median Family Income: $61,500
  • As Per Various Financial Guidelines Families Shouldn’t Spend More Than 30% Of Their Income On Housing.  That means a $1,500/monthly payment.
  • Median Home Price in San Diego: $500,000 (pushing that level again as per Trulia.com)
  • Interest Rates: 30 Year Mortgage 4.72% (Rates as of 9/4/2013) 

With such fundamental input variables median house value should be $290,000 -OR – A 42% DECLINE     ($1,500x360month@4.72%)

What if interest rates go to 7% over the next 5 years, which can easily happen? 

The fundamental value of the median house drops further to $225,000 -OR- A 55% DECLINE

Also, don’t forget that markets oftentimes overshoot to the bottom, just as they set blow off tops. In such a case I wouldn’t be surprised to see a median price of $150,000- 200K -OR- A 70%-60% DECLINE

You say impossible….. I say study financial markets. Nothing is impossible. 

Now, I understand and agree that there are various market forces at play that make the picture a lot more complicated. Interest rates, timing, mortgage finance, cash buyers, the FED, foreign buyers, speculation, location, supply/demand, etc….    However, fundamentals will always prevail over time. Everything else is just temporary bullshit.


ADVICE: 

Your house is not an investment. Don’t be confused. It is the place you live and raise your family. If you are happy with your house, have a fixed interest rate, can afford your monthly payments and don’t care if your house depreciates in value, I would stay put.

If you find yourself in a contrary situation……..I would consider various options. 

Did you enjoy this article? If so, please share our blog with your friends as we try to get traction. Gratitude!!!

WARNING: The US Real Estate Prices Are About To Decline 45-70%

Why The Philippine Economy Is About To Collapse

Forbes Writes:  Here’s Why The Philippines Economic Miracle Is Really A Bubble In Disguise

philippines-stock-market

The Philippines’ bubble will most likely pop when China’s economic bubble pops and/or as global and local interest rates continue to rise, which are what caused the country’s credit and asset bubble in the first place. The resumption of the U.S. Federal Reserve’s QE taper plans may put pressure on the Philippines’ financial markets in the near future. Another global economic crisis (as I expect) also puts remittances at risk.

As I’ve been saying even before this summer’s EM panic, I expect the ultimate popping of the emerging markets bubble to cause another crisis that is similar to the 1997 Asian Financial Crisis, and there is a strong chance that it will be even worse this time due to the fact that more countries are involved (Latin America, China, and Africa), and because the global economy is in a much weaker state now than it was during the booming late-1990s.

Read The Rest Of The Article

The article above is a MUST read for anyone living in the Philippines. Even though Philippines was the fastest growing economy in the world in the 3rd quarter of this year, the party is about to end.  I am sorry to say, but the Philippine economy is about to go through a major decline/contraction/collapse.   

I love the Philippines and I wish the economic backdrop was different, but the reality is hard to ignore. The article above is right on the money, providing outstanding reference points and data. Once again, I highly encourage you to read it.  Instead of commenting on the points in the article, allow me to introduce the Philippine stock market technical picture into the equation.

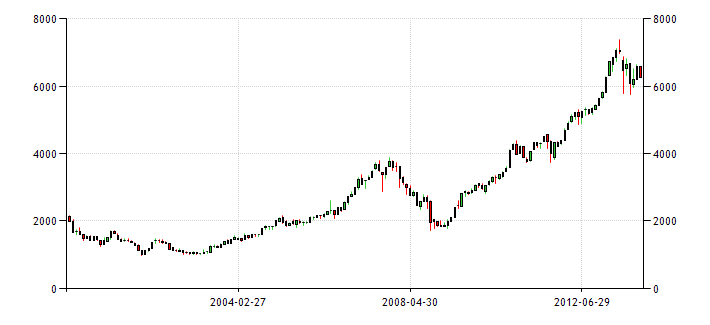
From technical side the market looks very weak. It looks like it is about to break down to the downside. Big time.  The market has tried on multiple occasions to go higher,  but was unable.  A breakdown below 5,500 level would indicate that the bear market in the Philippines in back. The problem is (a huge problem) is that there is no real technical support until it gets to about 2,000. That would be a 66% decline from today’s market prices. In other words, the stock market is predicting a devastating full on economic collapse in the Philippines.

Why do we care about this and what does it have to do with the Philippine economy? The stock market is a leading indicator. As it goes, the economy ALWAYS follows.  If we break down below 5,500 level, I would expect the Philippine economy to be in a recession within 6 months.  Everything else will follow. 

***In reality, this is a worldwide issue. A massive credit bubble is indeed here (driven by the US Fed and unsustainably low interest rates) and it will play a major role in the demise not only of the US Economy, but all emerging markets. Including China. As I have stated on numerous occasions, the US bear market will start in March of 2014.

When it does, anyone and everyone who relies on cheap credit to grow their economies will pay the price.  Unfortunately, that includes the Philippines. It is simply unavoidable. Get ready. 

P.S. PLEASE DONATE TO TYPHOON HAIYAN VICTIMS HERE

Did you enjoy this article? If so, please share our blog with your friends as we try to get traction. Gratitude!!!

Stock Market And 3-Dimensional Analysis (Part 2)

latice structure

Continuation of Part 1. 

Let me show you what I mean. 

The Right Way:

SQRT (6838^2+7510^2)=10,156 (3-DV)

As you can see, in this case price variable energy level matches the time energy level.  In simple terms, they match each other, yielding a highly relevant 3-DV in the process.

The Wrong Way: (using daily time variable)

SQRT(6,838^2 +1,155^2) = 6,935 (3-DV)

In this case the price side of the equation overwhelms the time part of the equation.  Depicting price and time as not squared.  The end product is the 3-DV that is almost identical to the price move itself. Yielding a 3-DV value that is not applicable for further 3-Dimensional analysis.

Click To Enlarge
Click To Enlarge

The bottom line is, to perform viable 3-DV calculations we have to square the chart or be in the same range of variance.  It is also important to note that at times the market (or individual stocks) will exhibit violent up or down moves, rendering squaring of the chart impossible.  In such a case and as a rule of thumb, use the prior measurement TIME variable. For example, if the price moved up 1,000 points in 20 trading hours, continue to use trading hour variable if you have used this variable in the time frame directly preceding this sharp/powerful move.

How To Predict Future Moves By Using Existing 3-DV

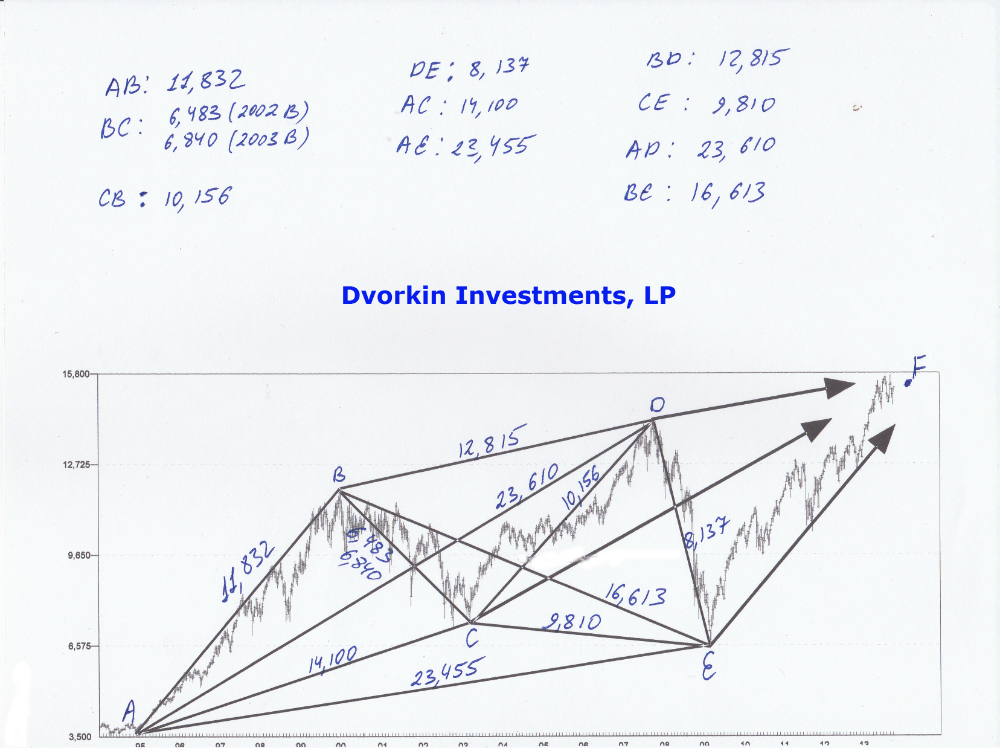
Once again, if we know the 3-DV of any move we can predict the next move with great accuracy.  It will either be identical to or a derivative of the move preceding it.  For example, looking at the chart above, if we know that AC is 14,100 we can very well forecast that CE will be equal to 9,810. Let’s take a closer look and perform a complete 3-DV analysis of the chart above.

At first glance, there isn’t that much synchronicity of the 3-DV calculated on the chart above. Other than the matching two 23,610 and 23,455 values, the rest of the values do not warrant any sort of uniformity.  The question is why?

If you remember, I have mentioned earlier that as the stock market moves through 3-Dimensional space it continues to trace out mathematical points of force.  Those point of force represent market turning points, but what are they really?  Without going into too much detail these points represent lattice  structures moving through 3-Dimensional space. We know from Chemistry that every element (or combination of elements) will have its own lattice structure. Same thing with the stock market and individual stocks.  Each individual stock or the overall stock market will have its own lattice structure or points of force associated with them. As the market moves it simply traces out these 3-Dimensional points on the 2-Dimensional stock market chart.

To Be Continued…..

Did you enjoy this article? If so, please share our blog with your friends as we try to get traction. Gratitude!!!  

The Secret Behind Upcoming Stock Market Top

Bloomberg Writes: Stock Funds Lure Most Cash in 13 Years as Market Rallies

 money flowing investwithalex

Investors are pouring more money into stock mutual funds in the U.S. than they have in 13 years, attracted by a market near record highs and stung by bond losses that would deepen if interest rates keep rising.

“The timing of retail investors tends to be terrible,” said Jonathan Pond, an independent financial adviser in Newton, Massachusetts, who oversees $200 million. The deposits may be a contrarian indicator of a market near a top, he said.

Jeremy Grantham, chief investment strategist at Boston-based money manager Grantham Mayo Van Otterloo & Co., told clients in a letter this week, “We will have the third in the series of serious market busts since 1999.” BlackRock Inc. Chief Executive Officer Laurence D. Fink said this month that stocks may decline as much as 15 percent because of political risks in China, Japan, France and the U.S.

Read The Rest Of The Article

As the melt up in the stock market continues, retail investors are the last ones to join the party. As always. As the article indicates, last time we had similar inflows was at the end of 1999 and early 2000 or right before the tech collapse and the subsequent recession.

I would go even further and suggest that today’s investor psychological backdrop is identical to that of 2000 top.  For example, even though multiple high performing investors did spot the technology bubble and have tried to warn the others, for the most part they were completely ignored until it was too late.  It was the “NEW” economy the old guard did not understand.  Today’s environment is identical, except one fact. Instead of it being the NEW economy, today most markets participants believe that the FED can control the economy and its interest rates. That is of course a mirage that they will pay for dearly. Overall, the bullish sentiment is off the charts. As always, retail investors will lose the most as soon as the bear market kicks in.

As I have stated so many times before, the bear market will start in March of 2014 and will take 3 years to complete. While it will not be a violent move to the downside, it will shave off about 30-50% from today’s market prices over the next few years.  You have been warned.  

Did you enjoy this article? If so, please share our blog with your friends as we try to get traction. Gratitude!!!  

What Everybody Ought To Know About Upcoming Emerging Market Crisis

BusinessWeek Writes: Bad Loans Could Spark an Emerging-Markets Crisis

emerging markets investwithaelx

The world’s largest emerging markets recovered quickly from the 2008 financial crisis because consumers and companies went on a borrowing binge. Now, as those economies cool, bad loans are haunting banks from Turkey to South Africa. India is injecting money into state-run lenders facing a huge rise in soured debt, and Chinese banks have been told to increase provisions against lending losses. “Credit growth in emerging markets has been phenomenal since 2008,” says Satyajit Das, author of a half-dozen books on financial risk.

He blames near-zero-percent interest rates in the U.S. and other developed nations, which have kept borrowing costs artificially low. “Many borrowers will struggle to repay the debt,” he says. “We’re ripe for a new emerging-market crisis.”

Read The Rest Of The Article

Could spark an emerging-markets crisis? You think?  How about will spark an emerging-market crisis. How about its already happening in countries like India with their currency being in a free fall.  

This is a systemic issue that comes from a singular source of low interest rates propagated by the FED. Of course everyone will borrow as much as they can when financing is flowing freely and interest rates are close to zero.  Particularly those in a week financial position. It allows them to survive for a little bit longer and they have nothing to lose. Yet, there is no chance in hell that these companies or borrowers can ever repair these loans.  Particularly not when both the US Economy and its financial markets are facing strong headwinds. The outcome? Massive defaults and substantial equity price declines in most emerging markets. 

Especially when you take the 2014-2017 bear market in the US into consideration (forecasted based on my mathematical timing work). While the US market is set for a 30-50% haircut, most emerging markets will not fare as well. 

Did you enjoy this article? If so, please share our blog with your friends as we try to get traction. Gratitude!!!  

Stock Market And 3-Dimensional Analysis

1994-2014 Analysis 

Once again the chart above represents 3-Dimensional movements within the stock market. The numbers above unify price and time into one number and are calculated as per Pythagorean Theorem formula given to you earlier.

While we have already looked at the number of these moves before let’s take a look at one more to cement our knowledge. Let’s take a look at the DE move as an example.  During this bear market decline of 2007-2009, the market moved exactly 7809 points in exactly 2288 trading hours.  When we apply our 3-Dimensional calculation we get a 3-DV of 8,137, which is the number you see on the chart. I highly encourage you to run every number on the chart above to confirm the numbers and to gain a better understanding.      

Now, understand something very important.  While the chart above is a long term chart representing the DOW between 1994-2013, it doesn’t have to be. The chart above could be the stock market chart over the last century or it could be a daily chart representing 2 hours of trading. The time frame doesn’t matter.  The same rules of 3-Dimensional analysis apply to all time frames.

What are the rules?

Rule #1: By identifying 3-DV on the chart you know exactly what the next move will be. It will either be identical to the one preceding it or a derivative of it. Meaning that once you know what the DE on the chart is, you can predict with great accuracy what the EF move will be. To the day and to the point. That’s how accurate this work is. Much more on that later.  

Rule #2: Make sure you know the time frame you are analyzing.  If you are using a long term chart, as above, make sure you do not shift to the short term chart and anticipate the same size movements.  For example, do not take DE 8,137 value and they try to find it on the daily chart. It will not work. You will only be able to find this value or the value of its derivative on the long term chart.

Rule #3: Always square price and time. When calculating your 3-DV make sure your time variable and your price variable are squared(match in size).  In simple terms, at certain times you would have to shift your time variable between minutes, hours, days and month.  Let me illustrate what I mean by showing you the right and the wrong way to do this.

Let’s assume for a second that you are looking at the chart above.  Current market is a high energy, fast moving market.  As such you have to use the hourly time frame to square the chart.  It would be wrong to use any other TIME variable.  Let’s take a look at the move labeled CD. Between 2003 bottom and 2007 top the market moved…

Price Move: 6,838 POINTS

Time Move: 7510 TRADING HOURS OR 1,155 TRADING DAYS -OR- 231 WEEKS -OR- 58 MONTH (there are 6.5 trading hours in 1 trading day)

If you want to generate a proper 3-DV measurement you have to use 7,510 trading hours as your primary TIME input. That input squares  (matches) the price movement. If you were to use trading days or weeks or months, the PRICE portion of the formula would overwhelm the equation and you would end up with a worthless measurement that is not applicable to the stock market analysis. Let me show you what I mean.  

To be continued……

Did you enjoy this article? If so, please share our blog with your friends as we try to get traction. Gratitude!!! 

Stock Market Update, November 22, 2013

daily chart Nov 22, 2013

Summary: Continue to maintain a LONG/HOLD position. 

Once again, no change since the last market update to alter my opinion. The market continues to push through it’s daily highs as it marches forward.  My previous updates remain right on the money. Please click on the links below to see them. 

November 15th Report. 

November 8th Report.

November 1st Report.

As we continue to hold our long position while waiting for the market reversal, right now might be a good time to start thinking about how you would liquidate your holding and/or re-allocate your capital once the bear market of 2014-2017 starts. If you would like to take it one step further, this is a good time to start researching SHORT opportunities.  

Did you enjoy this article? If so, please share our blog with your friends as we try to get traction. Gratitude!!!  
Stock Market Update, November 22, 201

Warning: The Biggest Market Story No One Is Talking About


10 year November

Everyone is running their mouth. Bernanke is talking about indefinite QE, Yellen is saying that she will accommodate the markets any way that she can and Larry Summers is talking about 0% interest rates to avoid economic depression. All of that is garbage. 

The only thing that truly matter is the 10-Year Note chart above. As you can see the chart is extremely bullish. I have said numerous times here, it is fatal to believe that the FED’s can control interest rates. They can influence them over the short term, but interest rates will behave as they should over the long run. The chart above clearly indicates that interest rates have reversed their course and are climbing up. Given massive amount of leverage  and speculation in the system, even a misery 0.5% increase from this point on will have huge negative consequences. Should interest rates zoom up within a short period of time (which they might) there will be hell to pay.

This is the most important trend to watch going forward. So far the trend is incredibly bullish (for interest rates). This plays very well into my forecast of the bear market starting in 2014. This confirms it. 

Did you enjoy this article? If so, please share our blog with your friends as we try to get traction. Gratitude!!!