6/3/2016 – A negative day with the Dow Jones down 32 points (-0.18%) and the Nasdaq down 29 points (-0.58%).
Bill Gross certainly believes that might be the case.
But my take from these observations is that this 40-year period of time has been quite remarkable – a grey if not black swan event that cannot be repeated. With interest rates near zero and now negative in many developed economies, near double digit annual returns for stocks and 7%+ for bonds approach a 5 or 6 Sigma event, as nerdish market technocrats might describe it.
Based on my mathematical and timing work Bill Gross is both right and wrong.
Now, most investors today would certainly believe that the statement above is insane. After all, over the long-term markets always go up. Or so they have been told. Yet, if we look at the charts going back to the first day of trading, May 19th, 1790, we will find two important periods of time that suggest otherwise.
- 1790-1860: During this 70 year period of time the Dow was able to eke out an impressive return of about 150%. That represents an annualized compounded rate to return of just 1.3%. Now, I am sure that if we take inflation into consideration, over the same period of time, the net result would be negative.
- 1899-1949: A 50 year period of time during which the Dow gained just 185%. That represents an annualized compounded rate of return of just 2.4%. Or net negative inflation adjusted rate of return during the same period of time.
Is it so hard to believe that we are in for another one of these periods?
I don’t think so and that is where Bill Gross is both right and wrong.
He is absolutely right to state that we might experience flat or even negative returns going forward. Possibly for an extended period of time. Considering today’s valuation levels, massive debt, zero interest rates and insane monetary policy, he is absolutely right.
Here is where he is wrong.
This prolonged period of time actually started in January of 2000. At least on the Dow. Before bullish investors dismiss this as insane, consider the following.
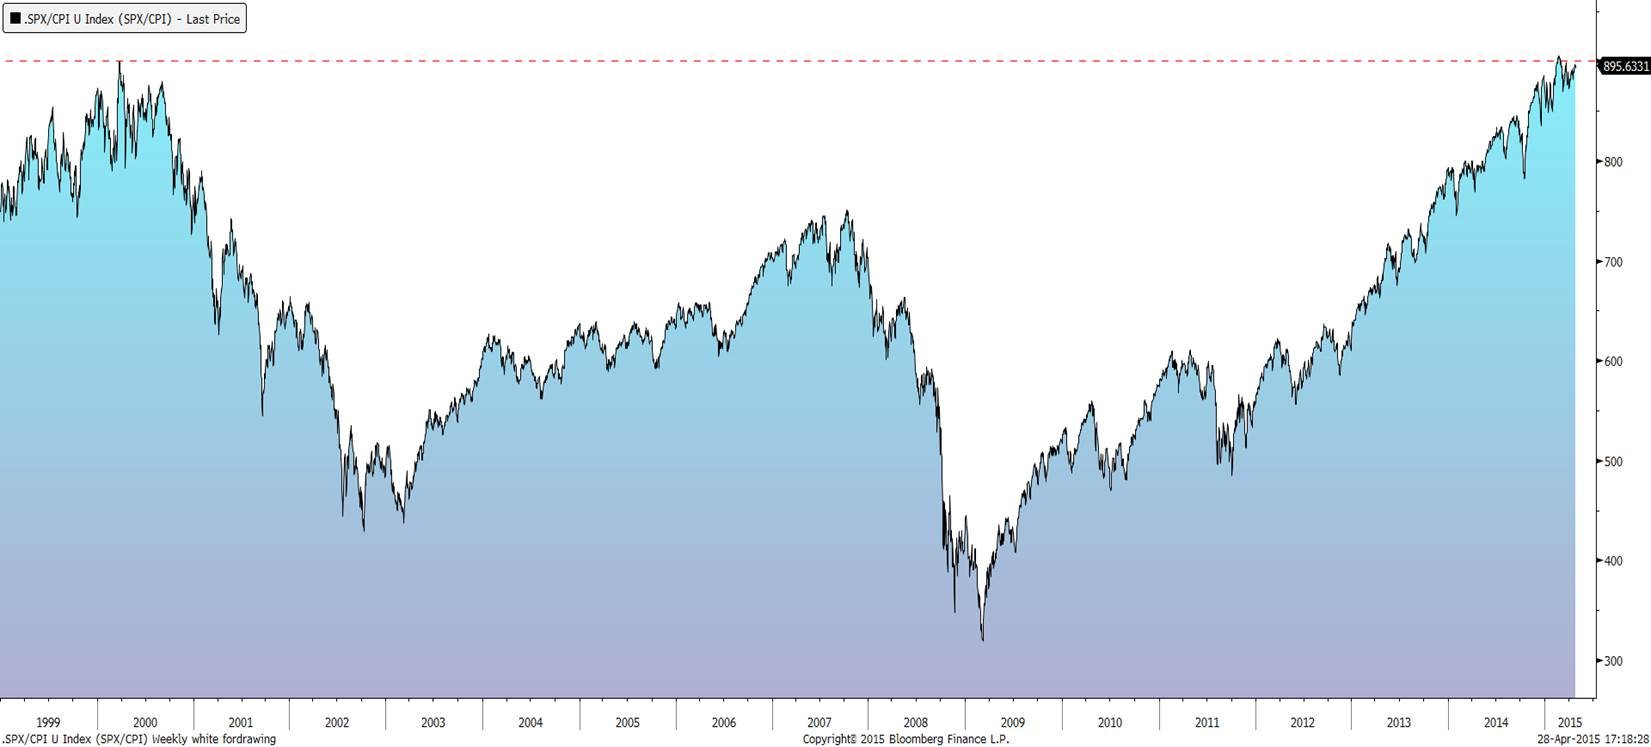
Inflation adjusted S&P/Dow are still slightly down since January of 2000. As represented by the chart below. The Nasdaq is still down in net terms, let alone inflation adjusted terms. 
Plus, as suggested above and multiple times on this blog, we are sitting at bubble valuation levels. Today. That doesn’t bode well for future market performance.
Don’t get me wrong. We will still have bull markets and bear markets. The market will rally to new all time highs only to collapse to today’s levels. What my work suggests is the following. When we look back from the year 2040, the Dow WILL find itself just north of 20,000. Again, based on my long-term mathematical and timing work.
And that would be after significant inflationary pressures the FED will unleash over the next decade. In other words, ladies and gentlemen, Bill Gross is dead on. Brace yourself.
This conclusion is further supported by my mathematical and timing work. It clearly shows a severe bear market between 2015-2017. In fact, when it starts it will very quickly retrace most of the gains accrued over the last few years. If you would be interested in learning when the bear market of 2015-2017 will start (to the day) and its internal composition, please CLICK HERE.
(***Please Note: A bear market might have started already, I am simply not disclosing this information. Due to my obligations to my Subscribers I am unable to provide you with more exact forecasts. In fact, I am being “Wishy Washy” at best with my FREE daily updates here. If you would be interested in exact forecasts, dates, times and precise daily coverage, please Click Here). Daily Stock Market Update. June 3rd, 2016 InvestWithAlex.com
Did you enjoy this article? If so, please share our blog with your friends as we try to get traction. Gratitude!!!
