6/22/2018 – A negative week with the Dow Jones down 510 points (-2.03%) and the Nasdaq down 54 points (-0.70%)
The Dow Jones is doing exactly what it should be doing. If you would like to find out exactly what happens next, based on our timing and mathematical work, please Click Here.
Now, I would hate to ruin your weekend, particularly if you are a bull, but here goes nothing.

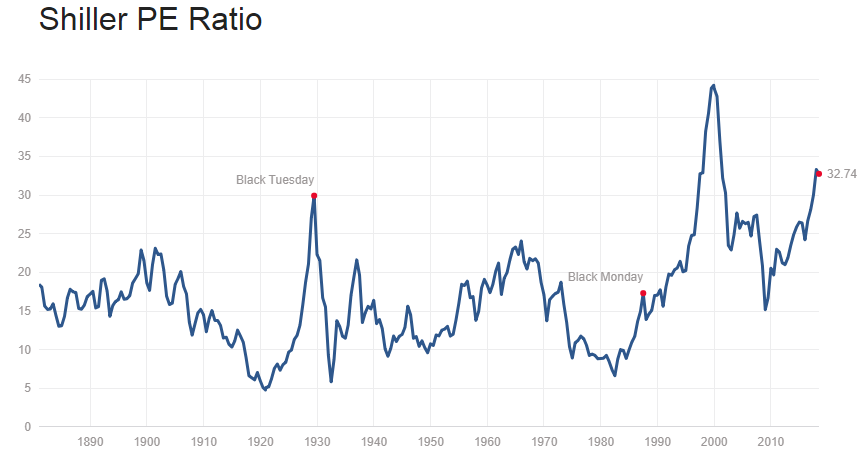
I know you are sick and tired of this chart, but nothing has changed. Shiller’s Adjusted S&P P/E ratio is now at 32.74. Slightly off highs, but still arguably at the highest level in history (if we adjust for 2000 distortions) and still above 1929 top of 29.55. In other words, the stock market has never been more expensive. It would have to collapse 50% just to hit its median price and we are not even talking about overshooting to the downside.
But what about earnings? Aren’t we supposed to have 4% GDP growth with the S&P earnings surging to the moon? After all, President Trump said so……MAGA?
NO!!!
![]()
Notice something of significant importance from the chart above. The S&P earnings are back or slightly above their 2014 levels. AKA….what growth? Since their 2016 dip bottom, everything that could be thrown at the market from the bullish side was already done. Weak dollar, tax cuts, money printing, etc….. The opposite is true now. The FED is tightening and deleveraging their balance sheet, the dollar is surging and Trump’s tax cuts are already priced in.
BUT, Warren Buffett said it’s a good time to be a long-term investor. 
Umn, perhaps that’s a good idea if you are willing to wait until Warren Buffett reincarnates as a $1000 bill.
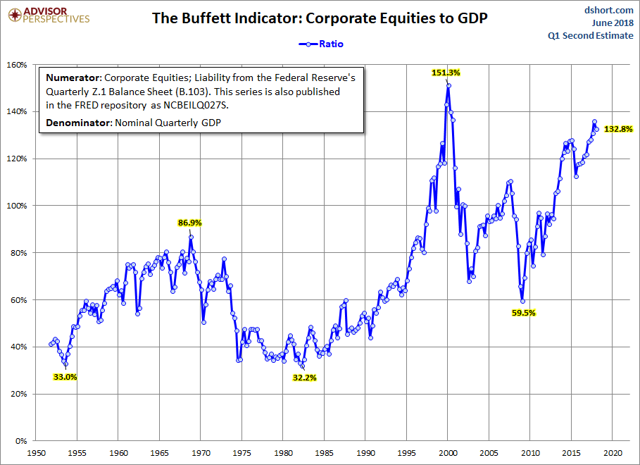
Here is the bottom line, you have to dismiss what Mr. Buffett says as he now represents the stock market in its entirety. Instead, pay attention to Mr. Buffett’s favorite market indicator of Corporate Equities to GDP is saying.
The said chart is clear in its conclusion. The stock market today is selling at the second highest valuation level ever. Certainly not a good time to look for value that Mr. Buffett so dearly loves. Valuations would have to decline over 50% just to hit their median.
Finally, the scariest chart of them all. 
It is truly mind boggling to see how long and leveraged everyone is. When the market finally cracks, as it surely will, all of the red on the right hand side will act as jet fuel to the downside.
To very quickly summarize, the stock market is incredibly expensive and sitting at historically high valuation levels. At the same time, positive drivers that were in force over the last few years (low interest rates, QE, weak dollar, margin expansion, tax cuts, etc…) have either reversed or in process of doing so. Finally, long-term bullish sentiment has never been higher as is represented by historically high margin debt levels.
What can possibly go wrong?
Luckily, our mathematical and timing work is clear in this regard. If you would like to find out what the stock market will do next, in both price and time, please Click Here
