Market Crash In 2016….Why Wait?

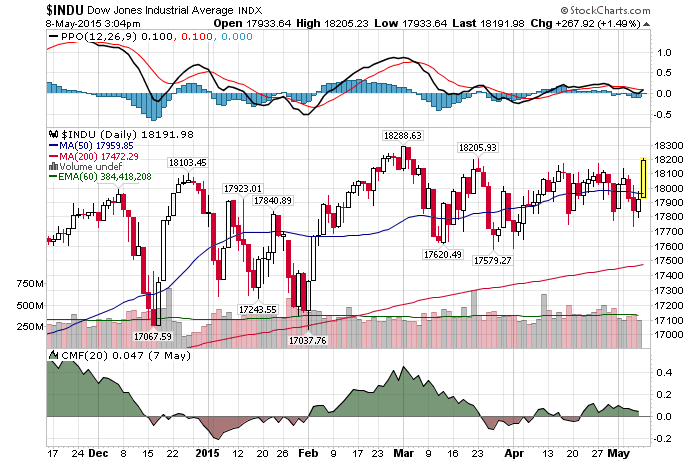
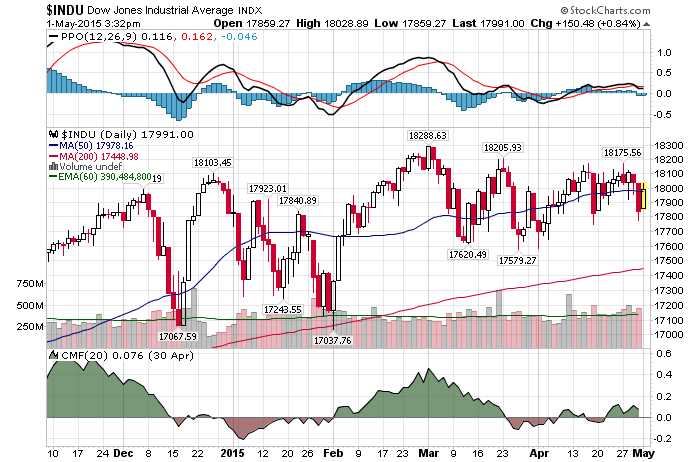
Daily Chart May 11th InvestWithAlex

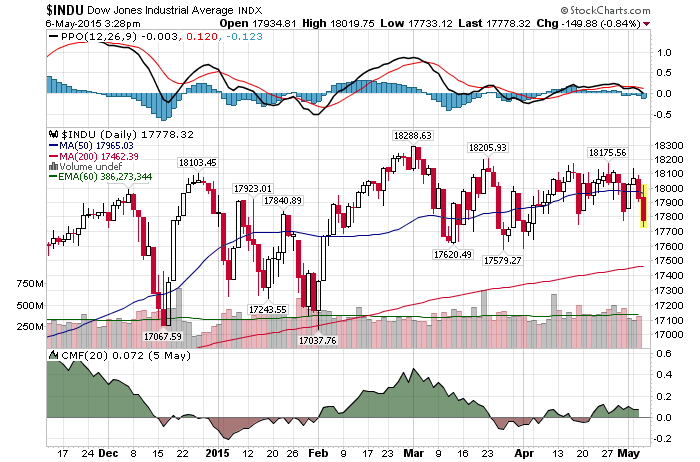
5/11/2015 – A down day with the Dow Jones down 86 points (-0.47%) and the Nasdaq down 10 points (-0.20%).

A massive and rather rapid stock market decline is coming later on this year. And while we won’t have a crash, considering the amount of margin debt out there, quite a few people will get wiped out. If you would like to find out exactly when this move will develop, to the day, please Click Here. 

Over the last few months a few analysts suggested that a bear market and a possible crash will occur in 2016. Something to do with the presidential cycle, the need to have a blow off top and increased gravitational forces in Andromeda Galaxy. For instance, Analyst Says Bull Market Will Not End With Top Tech Stocks So Cheap.

Excuse my ignorance, but why exactly is it impossible for us to have a large scale decline, maybe even a crash, in 2015? 

Personal preferences and wishful thinking aside, here is our current setup…..

  • Extreme overvaluations in most sectors of the stock market.
  • Outright bubbles in Tech and Biotech.
  • An adjusted P/E ratio above 1929, 1937, 1966, 1987, 2007, etc…. tops. Only 2000 top was higher, due to the lack of earnings in the tech sector at that time.
  • The FED is about to raise interest rates.
  • Any remaining QE velocity is quickly dissipating.
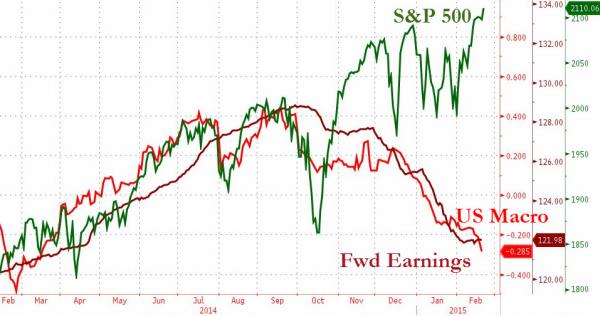
  • Macroeconomic data is collapsing (previous charts).
  • The US Economy is on a verge of an official recession. Q1 growth of 0.2%. Inventory build up saved the GDP from going negative.
  • Earnings growth estimates are accelerating down (previous charts).
  • We are still in a secular bear market.
  • 10 Months of market distribution. (NYSE since July of 2014)
  • Extreme bullish sentiment.
  • Margin debt is at an all time high.
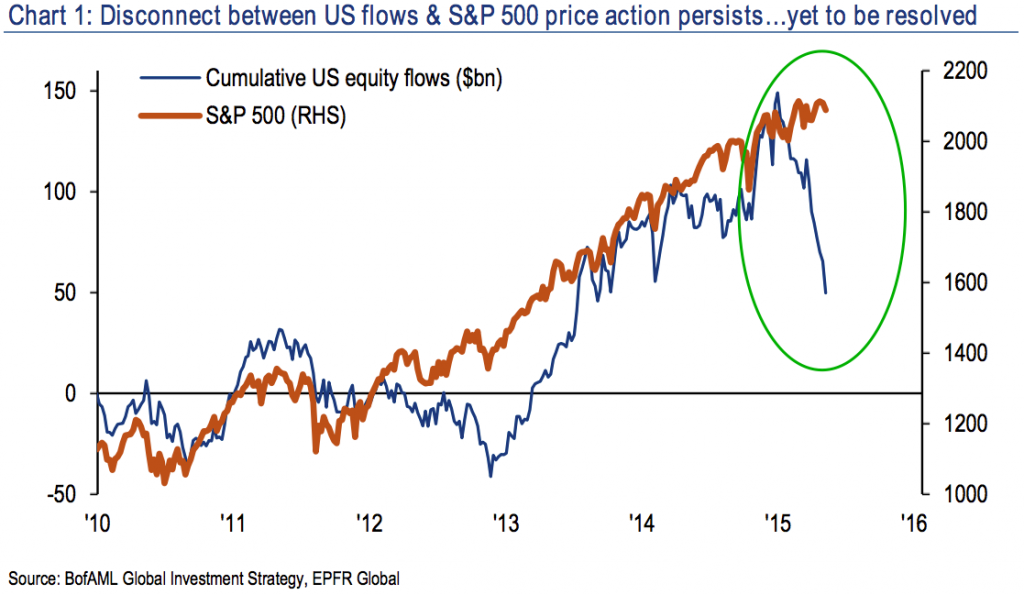
  • Fund outflows continue to accelerate (weekend update).
  • Etc….

I am sure I have missed quite a  few points, but you get the idea. Sounds like a perfect recipe for a disaster to me. The best part is, I don’t think we have to wait until 2016.

This conclusion is further supported by my mathematical and timing work. It clearly shows a severe bear market between 2015-2017. In fact, when it starts it will very quickly retrace most of the gains accrued over the last few years.  If you would be interested in learning when the bear market of 2015-2017 will start (to the day) and its internal composition, please CLICK HERE.

(***Please NoteA bear market might have started already, I am simply not disclosing this information. Due to my obligations to my Subscribers I am unable to provide you with more exact forecasts. In fact, I am being “Wishy Washy” at best with my FREE daily updates here. If you would be interested in exact forecasts, dates, times and precise daily coverage, please Click Here). Daily Stock Market Update. May 11th, 2015  InvestWithAlex.com

Did you enjoy this article? If so, please share our blog with your friends as we try to get traction. Gratitude!!!

Market Crash In 2016….Why Wait?  Google

Markets Levitate As Divergences Hit Record Highs

Daily Chart May 8th InvestWithAlex

5/8/2015 – A positive day with the Dow Jones up 266 points (+1.49%) and the Nasdaq up 58 points (+1.17%). 

The jobs number missed its expectation? Sell, sell, sell. Wait! What? It’s ideal enough for the FED to pause their proposed interest rate hikes? Buy, Buy, Buy!!! That about summarizes today’s market action. And if you had any doubts that this market is purely FED/Liquidity driven, well, they should be gone by now.

A few important things to get through before the weekend.

First, quite an honest look from Bill Gross of where we are today, what is causing today’s asset valuation bubbles and what the eventual outcome will be. Bill Gross: Central Banks Are Gaming Asset Prices Definitely worth a look. To summarize, we are now in two massive bubbles, stocks and bonds, driven by the FED and their obsession with higher asset prices. To perpetuate the myth of strong economic recovery. It now becomes a matter of time before all of this ends very badly. I cold-heartedly agree.

Second, macro economic data continues to collapse and equity outflows accelerate as the stock market remains near all time highs. Divergences galore. The disconnect in the US stock market just keeps getting bigger. The charts below should send a chill down your spine.

equity outflows investwithalex

Macrodata

Finally, Larry Summers is concerned the US Economy will fall back into a recessionary mode. Larry Summers: I’m Concerned US Growth Won’t Pick Up

I have held a view that the US Economy will start rolling over into an all out recession by the 4th quarter of 2014. We have been witnessing exactly that over the last few months. This is rather simple. The entire US Economic recovery, over the last few years, has been driven by QE, zero interest rates and asset price speculation.

Take that away and we would already be in a severe recession. Further, now that these “prosperity drivers” are withering away, there is absolutely nothing to drive this economy forward. I have already covered the fact that we won’t see CAPEX growth going forward and I am having a really hard time imagining what can push us forward. Considering today’s valuation levels, this will indeed end very badly.

This conclusion is further supported by my mathematical and timing work. It clearly shows a severe bear market between 2015-2017. In fact, when it starts it will very quickly retrace most of the gains accrued over the last few years.  If you would be interested in learning when the bear market of 2014/15-2017 will start (to the day) and its internal composition, please CLICK HERE.

(***Please Note: A bear market might have started already, I am simply not disclosing this information. Due to my obligations to my Subscribers I am unable to provide you with more exact forecasts. In fact, I am being “Wishy Washy” at best with my FREE daily updates here. If you would be interested in exact forecasts, dates, times and precise daily coverage, please Click Here). Daily Stock Market Update. May 8th, 2015  InvestWithAlex.com

Did you enjoy this article? If so, please share our blog with your friends as we try to get traction. Gratitude!!!

Markets Levitate As Divergences Hit Record Highs Google

Why The Stock Market Is Exact And Not Random

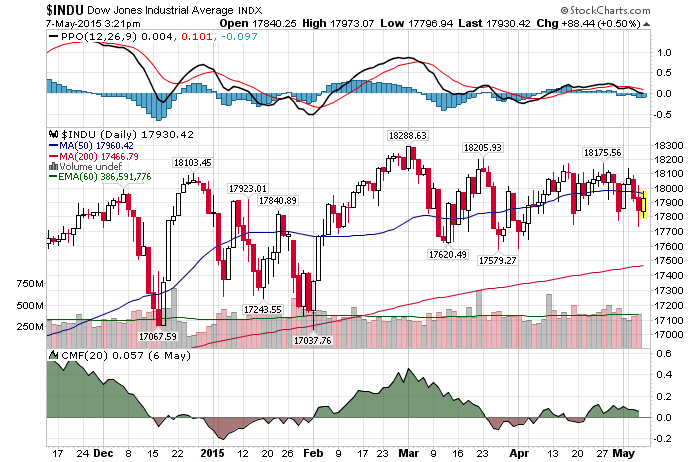
Daily Chart May 7th InvestWithAlex

5/7/2015 – A positive day with the Dow Jones up 83 points (+0.47%) and the Nasdaq up 26 points (+0.53%).

Over the last few months the stock market has been about as exciting as a day at the dentist. So much so that the Dow of today trades exactly where it was on November 21st, 2014. The NYSE is where it was in July of 2014. But do not despair, this period of low volatility will soon end.

Most investors believe that the stock market is random, volatile, and cannot be predicted. Nonsense. If anything, the market is exact. Once you understand how it works behind the scenes (The Secret Behind The Stock Market), exact calculations can be made.

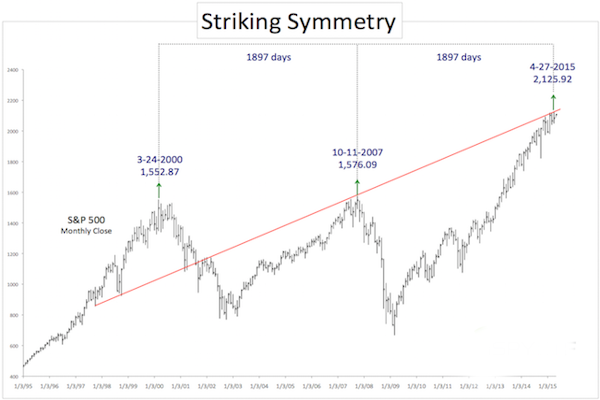
That is precisely what the charts below show.

S&P Symmetry InvestWithAlex

Here is one of my charts showing something similar, but much more accurate.

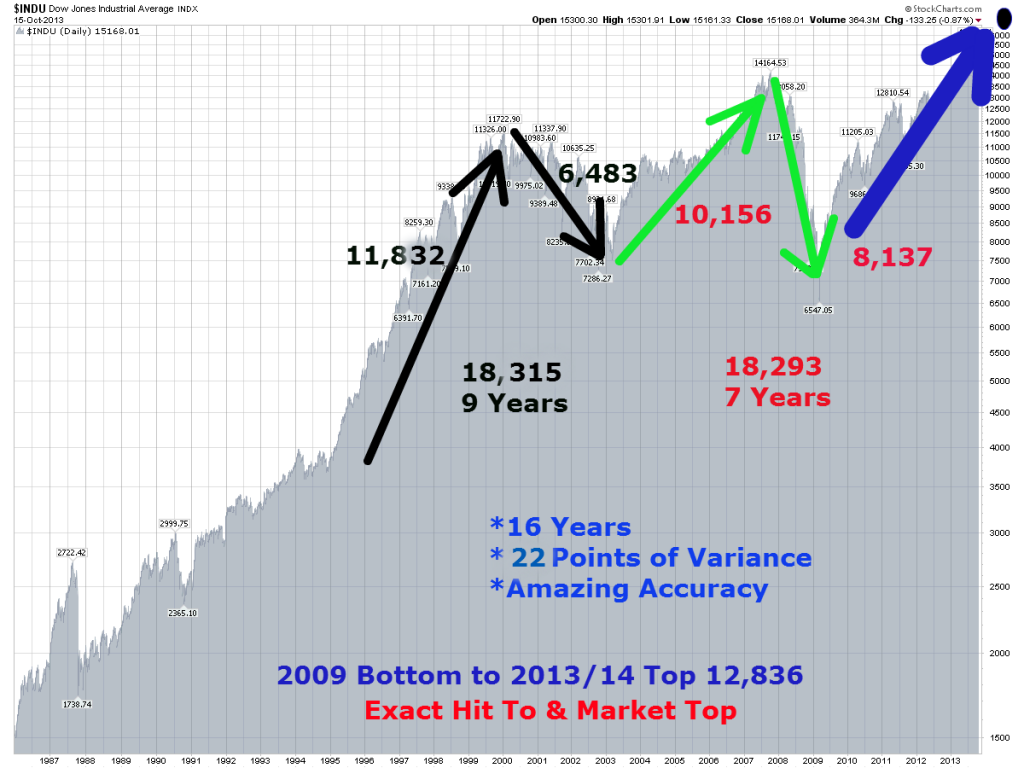
Long Term Dow Structure35

I cannot overstate how amazing this chart is. Just a few points.

  • As we have already discussed, the move between 1994 bottom and 2000 top was 11,832 3-DV UNITS. The Dow topped at exactly 11,866 in January of 2000. Amazing!!!
  • The up move between 1994 bottom and 2000 top was 11,832 3-DV UNITS. The down move between 2000 top and 2002 bottom was 6,483 3-DV UNITS. When you combine both values together you end up with a value of 18,315 3-DV UNITS. The move took 9 years.
  • The up move between 2002 bottom and 2007 top was 10,156 3-DV UNITS. The down move between 2007 top and 2009 bottom was 8,137 3-DV UNITS. When you combine both values together you end up with a value of 18,293 3-DV UNITS. The move took 7 years.

To summarize, the combined move took 16 years and there was only 22 3-DV UNITS of variance between two sections. This variance over the 16 year period of time can be attributed to as little as 2 trading days and a few hundred points on the Dow. This example alone should put to rest all claims that the stock market is random and unpredictable. Once again, when we identify the exact structure of the stock market through using our 3-Dimensional analysis we can time the market with great precision.

For example, if we understand the structure above we know that the move between 2002 bottom and 2009 bottom will be identical in 3-DV UNITS of the move between 1994 bottom and 2002 bottom. Just by having this information alone one should be able to figure out the stock market with great precision. Further, once we have hit the 2007 top on the DOW, any analyst using this technique knows that the upcoming down move will be exactly 8,127 3-DV UNITS. (18283-10156=8,127)

That would mean that once the 2007 top is confirmed you would know exactly where the market would bottom. So, while everyone is freaking out in the late 2008 and early 2009 you are either shorting the market and making a lot of money or you are setting yourself up for the upcoming bull market that you know will start in March of 2009.

I hope this clearly illustrates how powerful this 3-Dimensional analysis can be. Also, please keep in mind that the example above is just a tiny sample of the information available to you once 3-Dimensional analysis is performed. Again, once the market structure is fully understood you would know not only where but WHEN the market would turn.

This conclusion is further supported by my mathematical and timing work. It clearly shows a severe bear market between 2015-2017. In fact, when it starts it will very quickly retrace most of the gains accrued over the last few years.  If you would be interested in learning when the bear market of 2014/15-2017 will start (to the day) and its internal composition, please CLICK HERE.

(***Please Note: A bear market might have started already, I am simply not disclosing this information. Due to my obligations to my Subscribers I am unable to provide you with more exact forecasts. In fact, I am being “Wishy Washy” at best with my FREE daily updates here. If you would be interested in exact forecasts, dates, times and precise daily coverage, please Click Here). Daily Stock Market Update. May 7th, 2015  InvestWithAlex.com

Did you enjoy this article? If so, please share our blog with your friends as we try to get traction. Gratitude!!!

Why The Stock Market Is Exact And Not Random  Google

As The Dow Goes Negative For The Year, The Worst Is Yet To Come

Daily Chart May 6th InvestWithAlex

5/6/2015 – Another down day with the Dow Jones down 85 points (-0.48%) and the Nasdaq down 20 points (-0.40%). 

A massive and rather rapid stock market decline is coming later on this year. And while we won’t have a crash, considering the amount of margin debt out there, quite a few people will get wiped out. If you would like to find out exactly when this move will develop, to the day, please Click Here. 

For now, most investors continue to play chicken with the FED. And they will pay dearly for it. I am not sure if the FED can be any more clear here. They WILL raise rates and soon. Plus, when even Janet Yellen suggests that stocks are too expensive….Fed’s Yellen says equity valuations high, warns of ‘potential dangers’…..well, you deserve to lose a lot of money if you maintain a net bullish position going forward.

At the same time, maybe the bulls are right. According to quite a few market pundits, the party in the equity markets hasn’t even started yet. Case and point.

I cannot stop shaking my head in disbelief. To save you some time, here is what was said:

“This is an extraordinary buying opportunity, buy any and all dips, with zero interest rates the price of equities could be infinite, this bull market will continue, valuation don’t matter anymore, etc….”

Valuations don’t matter……infinite run ups are just around the corner …..buy now. That sounds familiar. If I didn’t hear the exact same thing at 2007 and 2000 tops, well, call me a fool.

Again, the underlying assumption in both cases is the same. We are in such a unique monetary easing environment that there is no way in hell the markets can go down. Maybe so, but here is the major point that most investors miss. Today’s market environment becomes a matter of psychological setup as opposed to a fundamental background.

When everyone and their day trading grandmother believe that we are in such a bullish environment, the market is getting ready to reverse. Why? Well, it’s rather simple, everyone has already bought into the long side of the market. Contrary to the opinion of the market pundits above, I would argue that the only opportunity here is on the short side (or in cash).

This conclusion is further supported by my mathematical and timing work. It clearly shows a severe bear market between 2015-2017. In fact, when it starts it will very quickly retrace most of the gains accrued over the last few years.  If you would be interested in learning when the bear market of 2014/15-2017 will start (to the day) and its internal composition, please CLICK HERE.

(***Please Note: A bear market might have started already, I am simply not disclosing this information. Due to my obligations to my Subscribers I am unable to provide you with more exact forecasts. In fact, I am being “Wishy Washy” at best with my FREE daily updates here. If you would be interested in exact forecasts, dates, times and precise daily coverage, please Click Here). Daily Stock Market Update. May 6th, 2015  InvestWithAlex.com

Did you enjoy this article? If so, please share our blog with your friends as we try to get traction. Gratitude!!!

As The Dow Goes Negative For The Year, The Worst Is Yet To Come  Google

Capital Outflows And How Fast They Will Collapse The Market.

Daily Chart May 5th InvestWithAlex

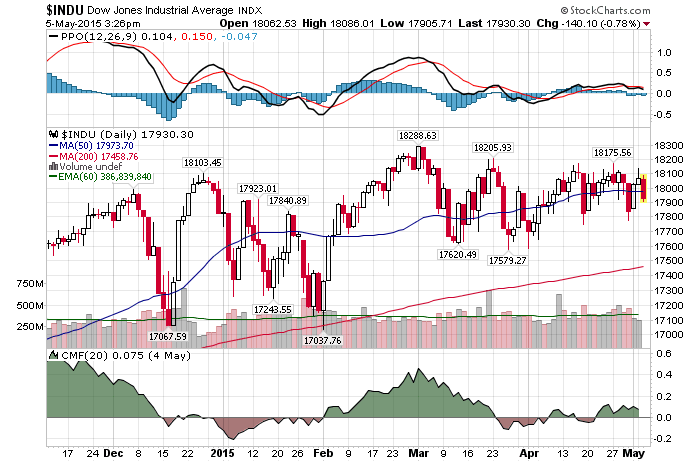
5/5/2015 – A down day with the Dow Jones down 142 points (-0.79%) and the Nasdaq down 78 points (-1.55%)

Despite bullish spirits running high, the stock market has been stuck in a flat trading range for over 10 months now (NYSE). And while most stock prices are miraculously maintaining their upper range, fund outflows are starting to match 2008 panic levels.

In April, U.S. equity mutual funds and ETFs saw outflows of $35.8 billion, according to TrimTabs. That’s the biggest move away from American stocks since October 2008. And the bearish tone is confirmed by the flows in the leveraged ETF space, where leveraged short ETFs saw an increase in assets of 4.6 percent, while leveraged long ETFs saw assets dip by 2.5 percent.

But Wait, There’s More! There is always a bull lurking around, ready to put a positive spin on the news above.

“I actually think it could be a positive for U.S. stocks, because the more people are fleeing equities, the less likely we are to have a crash instantaneously,” Boris Schlossberg of BK Asset Management.  “It’s only when we have bubble-kind-of-conditions that leads to very sharp corrections in equities.”

If my mathematical and timing work is correct, the final leg of a secular 2000-2017 bear market is just around the corner. The only remaining question is, how fast will any such bear leg develop…….will it be a crash or a prolonged decline?

Both. If my work is accurate we should see a fairly rapid sell-off when the TIME is right. Considering today’s market setup and the overall bullish overtone, it will catch most investors by surprise. That will be followed by a quick bounce and a subsequent prolonged decline into the final bottom. In other words, those without this timing and mathematical breakdown stand zero chance of NOT losing money over the next few years.

This conclusion is further supported by my mathematical and timing work. It clearly shows a severe bear market between 2015-2017. In fact, when it starts it will very quickly retrace most of the gains accrued over the last few years.  If you would be interested in learning when the bear market of 2014/15-2017 will start (to the day) and its internal composition, please CLICK HERE.

(***Please Note: A bear market might have started already, I am simply not disclosing this information. Due to my obligations to my Subscribers I am unable to provide you with more exact forecasts. In fact, I am being “Wishy Washy” at best with my FREE daily updates here. If you would be interested in exact forecasts, dates, times and precise daily coverage, please Click Here). Daily Stock Market Update. May 4th, 2015  InvestWithAlex.com

Did you enjoy this article? If so, please share our blog with your friends as we try to get traction. Gratitude!!!

Capital Outflows And How Fast They Will Collapse The Market. Google

Shocking: Long-Term Stock Market Composition Predicts A Severe Bear Market

Daily Chart May 1st5/1/2015 – A positive day with the Dow Jones up 182 points (+1.02%) and the Nasdaq up 64 points (+1.29%) 

Below is a comprehensive longer-term review of the stock market and what the next few years hold. 

In the early January of 2000, the US Economy wa s booming. The Dow was fast approaching 11,800 and the Nasdaq was a stone throws away from its improbable benchmark of 5,000. Everyone was making a ton of money and as far as most people were concerned, the future looked very bright.  So much so, that very few people predicted a bear market of 2000-2002, let alone a secular 2000-2017 bear market that was about to begin.

The only way to do so was to know and to understand the cyclical TIME structure oscillating within the stock market.  For instance, an analyst working with such time cycles would know that the stock market’s 17-18 year cycle was topping out in conjunction with the 5 year cycle that started at 1994 bottom.  The bull market that started at the bottom in August of 1982 was coming to a conclusion. In fact, it would top out exactly 17.5 years after it had started or on January 14th, 2000 at 11,800. The 5 year cycle that started in December of 1994 would top out at exactly the same time; 5 years and 35 trading days after it had started.

What does this have to do with predicting a severe bear market of 2014/15-2017?

Everything.  Based on my work the stock market is a mathematically precise entity. And while there are hundreds of TIME cycles oscillating within the stock market at any one time, I will concentrate on only two to prove my point.  The 17-18 cycle and the 5 year cycles. We will look at these cycles over the last 100+ years and I will prove to you, without a shadow of a doubt, they work.

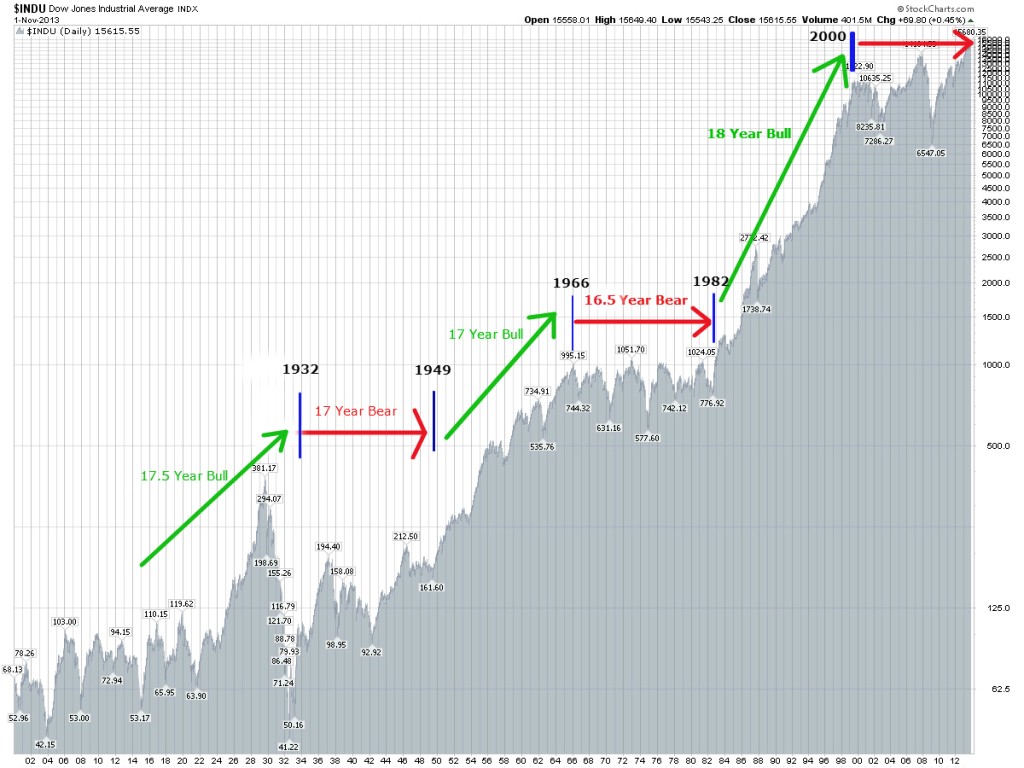
THE 17-18 YEAR CYCLE IN THE STOCK MARKET:
Long Term Dow Structure3

Long-term cycles within the stock market tend to oscillate going all the way back to the first day of trading, in May of 1790.  If you would be inclined, I would encourage you to verify that information for yourself. For our purposes we will start our analysis a little bit later or exactly 100 years ago. As the chart above indicates, the stock market tends to oscillate in clearly defined 17-18 year alternating Bull/Bear market cycles.

  • 17.5 Year Bull Market (1914 bottom to 1932 bottom): The previous bear market terminated in July of 1914. At that time the US stock market shut down for World War 1. The stock market remained closed between August of 1914 and December of 1914 (a very rare occurrence). When the market finally reopened in December of 1914 it immediately began a rally that would not terminate until October of 1929. Followed by a now famous 1929 stock market crash and a massive 90% 3 year decline. The cycle terminated at the bottom in 1932, completing the 17.5 year bull market cycle at that time.

*Note: It is important to address the 1929-1932 bear market and its impact on the overall 1914-1932 Bull Market cycle. It is a complex matter to discuss without sufficient background or understanding, but the final (short-term) structural composition of this Bull Cycle inverted over the last 3 years (1929-1932). Mostly due to a massive rally between 1924-1929 and a number of down cycles converging on this time period at the same time.  Regardless, the overall cycle lasted 17.5 years.

  • 17 Year BEAR Market (1932 bottom to 1949 bottom): The cycle originated at the bottom in July of 1932 and lasted until June of 1949. During this period of time we had a post great depression bounce, 1937 crash and World War 2. Yet, despite the overall upward trajectory, this clearly defined 1949 bottom remained 60% below its 1929 top and well below both its 1937 and 1942 tops.
  • 17 Year BULL Market (1949 bottom to 1966 top): The market surged higher between 1949 bottom and 1966 top. This was the so called “Golden Age” of post war reconstruction and the American industrial boom. During this time the Dow appreciated over 500% in a clearly defined bull market cycle.
  • 16.5 Year BEAR Market (1966 top to 1982 bottom): The market stayed relatively flat during this period of time with a few notable declines of 30-50%. With the 1972-1974 mid cycle decline of 54% being the largest one.  This clearly defined bear market completed in August of 1982. Approximately 25% below its 1966 top.
  • 17.5 Year BULL Market (1982 bottom to 2000 top): A very well known period and a clearly defined bull market. The market surged higher from its August of 1982 bottom to reach its historic top in January of 2000. During this time the Dow appreciated over 1,400% in one of the strongest bull markets in history.
  • 17 Year BEAR Market (2000 top to 2017 bottom): Even though the market is sitting near all time highs (as of this writing in January of 2014) and even though most people have assumed that the new bull market has started, in relative terms the market hasn’t appreciated very much since its top in 2000. The Nasdaq is still down. Plus, with the final down leg of this bear market being ahead of us (based on my mathematical and timing work), the BEAR market of 2000-2017 should complete itself in a negative territory or below its 2000 top.

It is important to note that the small variation (of +/- 1 year) in duration of these cycles is caused by smaller or larger cycles arriving at the same time. As such and based on the cycles above, we are no longer working in an arbitrary fashion when it comes to predicting the stock market.  In other words, if the stock market repeats a clearly defined 17-18 year Bull/Bear cycle over a 220 year period of time (since 1790) and does so without interruption,  it is safe to assume that the future is predictable and not random.

THE 5 YEAR CYCLE IN THE STOCK MARKET

One other easily identifiable cycle within the stock market is the 5 year cycle. These 5 year cycles represent one completed growth pattern or one completed Bull or Bear cycle. Typically, they tend to appear for 5 years, disappear and then reappear at a certain point in the future. While they are not sequential as the 17-18 year cycle above, once their place within the overall stock market is understood, they show up at exactly the right time.  For instance,

  • 1914 -1920: Bull Market
  • 1924-1929: Bull Market (followed by a 1929 crash)
  • 1932-1937: Bull Market (followed by a 1937 crash)
  • 1937-1942: Bear Market
  • 1966-1971: Bear Market
  • 1982-1987: Bull Market (followed by a 1987 crash)
  • 1994-2000: Bull Market (followed by a 2000 crash)
  • 2002-2007: Bull Market (followed by a 2007 crash)
  • 2009-2014: Bull Market

One thing to understand about these 5 Year cycles is that they are exact. They have much lower level variance as compared to their longer counterparts. Essentially, we are NOT talking about 5 years +/- 6 months. We are talking about 5 years +/- a few days. For instance, the 2002-2007cycle started on October 10th, 2002 (at 2002 bottom) and terminated on October 11th, 2007. If you are counting, that is exactly 5 Years and 1 day or scary accurate. I encourage you to study the other cycles outlined above in order to prove to yourself how shockingly accurate they all are.

 CONCLUSION: 

In summary, predicting a bear market of 2015-2017 is rather simple.  All 17-18 year bear cycles end with a 2-3 year bear market. For instance, 1912-1914, 1946-1949 and 1979-1982. And while most believe that the secular bear market ended at 2009 bottom, it is not the case. The secular bear market of 2000-2017 is still in effect and will terminate only when the year 2017 is reached. Although the final price bottom will be higher than the mid-cycle bottom reached in March of 2009.

Further, the 5-Year cycle that started on March 6th, 2009 bottom terminated on July 16th, 2014. Suggesting that the stock market is now ready to initiate its bear leg (despite recent higher highs). When I combine this cyclical analysis with the rest of my mathematical and timing work, the outcome is crystal clear. A severe bear market of 2015-2017 is just around the corner.

This conclusion is further supported by my mathematical and timing work. It clearly shows a severe bear market between 2014/15-2017. In fact, when it starts it will very quickly retrace most of the gains accrued over the last few years.  If you would be interested in learning when the bear market of 2014/15-2017 will start (to the day) and its internal composition, please CLICK HERE.

(***Please NoteA bear market might have started already, I am simply not disclosing this information. Due to my obligations to my Subscribers I am unable to provide you with more exact forecasts. In fact, I am being “Wishy Washy” at best with my FREE daily updates here. If you would be interested in exact forecasts, dates, times and precise daily coverage, please Click Here). Daily Stock Market Update. May 1st, 2015  InvestWithAlex.com

Did you enjoy this article? If so, please share our blog with your friends as we try to get traction. Gratitude!!!

Shocking: Long-Term Stock Market Composition Predicts A Severe Bear Market  Google
The US Economy Nears “Official” Recession As The FED Blames It On The Weather. Who Is Right?

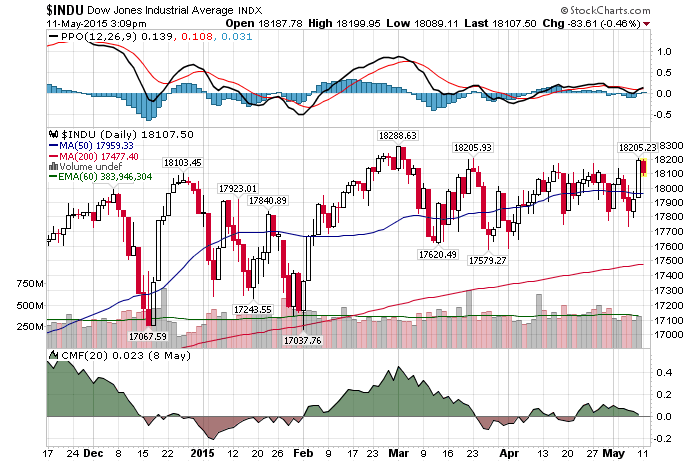
Daily Chart April 29 2015

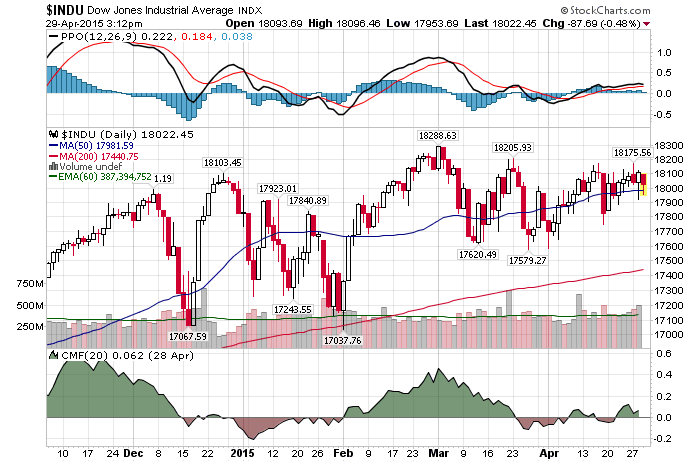
4/29/2015 – A down day with the Dow Jones down 75 points (-0.41%) and the Nasdaq down 32 points (-0.63%)

If you have followed this blog for some time you are very well aware that I have suggested over a year ago that the US economy will continue to decelerate throughout 2014-2015. Until it slips into an official recession. Today’s GDP growth of 0.2% (vs. expected 1%) gives more credence to such a view.

The FED blamed the weather, strong US dollar, energy prices and other transitory factors for this slow down. Fully expecting the US Economy to rebound in the second half of the year. Hence, interest rate hikes are still in play.

Does any of that matter when it comes to our financial markets? YES and NO

YES. Today’s economic situation is rather easy to understand. At least from my vantage point. The US Economy is running on fumes of zero interest rates and QE #1-3. Nothing more and nothing less. Once this liquidity finally works its way through the system, we will see the US Economy fall back into a recessionary mode. Judging by today’s numbers we are nearly there.

Simply put, there is nothing to drive this economy forward. In fact, I would love to hear what, if anything, will force this economy to grow. That is one of the reasons we are seeing massive corporate stock buybacks and no capital expenditures. Most corporates don’t know what to do with their cash and most don’t have the need to invest in their own business.

NO. It doesn’t matter in terms of the eventual outcome. Whether or not the US Economy falls into a recession, whether or not the FED raises interest rates or introduces another round of QE, one simple truth remains. We are in a massive stock market bubble that will implode sooner or later.

As a result, it is time for investors to stop being mesmerized by the FED. Instead, it is time for them to realize that we are in a bubble that will soon pop. No matter what the FED or the US Economy does.

This conclusion is further supported by my mathematical and timing work. It clearly shows a severe bear market between 2015-2017. In fact, when it starts it will very quickly retrace most of the gains accrued over the last few years.  If you would be interested in learning when the bear market of 2015-2017 will start (to the day) and its internal composition, please CLICK HERE.

(***Please NoteA bear market might have started already, I am simply not disclosing this information. Due to my obligations to my Subscribers I am unable to provide you with more exact forecasts. In fact, I am being “Wishy Washy” at best with my FREE daily updates here. If you would be interested in exact forecasts, dates, times and precise daily coverage, please Click Here). Daily Stock Market Update. April 29th, 2015  InvestWithAlex.com

Did you enjoy this article? If so, please share our blog with your friends as we try to get traction. Gratitude!!!

The US Economy Nears “Official” Recession As The FED Blames It On Weather. Who Is Right?  Google

What You Should Expect From The FED Tomorrow

Daily Chart April 28 2015

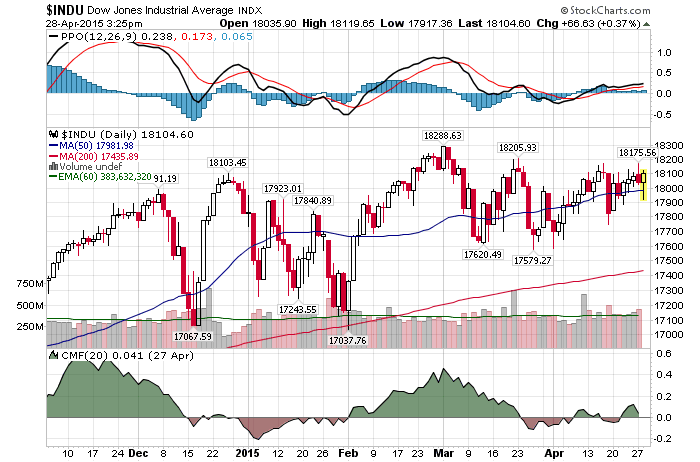
4/28/2015- A mixed day with the Dow Jones up 72 points (+0.40%) and the Nasdaq down 5 points (-0.10%). 

So, does it matter what the FED says tomorrow? Not really and not if you value your money. Here is why.

As far as I am concerned there is only one thing, and one thing only, that is holding this market together. The FED and investors blind faith in the fact that the FED will be able to stop any and all market corrections. Either through QE, interest rates or by simply making statements to the press. So much so that every single bottom over the last couple of months can be attributed to the FED talk.  El-Erian tends to agree. Danger, Danger — ‘Market Is in Love With Central Bank Trade’

Here are the 3 reasons as to why this “herd mentality trade” will blow up in investors faces. And much sooner than most people believe. 

  1. The Fed is a Reactionary Force: If we study the past, the FED has always been late to react to any and all market developments. For instance, Bernanke was talking about the accelerating US Economy as late as Q1 of 2008. They have no clue and there is no reason to believe that this time will be any different.
  2. The Market Will Decline Anyway: My mathematical and timing work makes it very clear. Over the short-term the market is independent of all fundamental inputs. That is to say, the market will top out on a certain date in 2015 and initiate its decline. No matter what the FED does or say. That day is approaching fast.
  3. Investors Will Lose Confidence In The FED: This is unavoidable. As soon as the FED is unable to backstop the next decline, most investors will lose confidence in a millisecond.  That in itself will accelerate the decline

The main take away from the points above is as follows. The FED trade will be in place until it is not.  The problems is, by the time most investors realize this fact, it will already be too late. By the time the analysis above becomes a reality, the stock market will already be down 10-25%.

This conclusion is further supported by my mathematical and timing work. It clearly shows a severe bear market between 2015-2017. In fact, when it starts it will very quickly retrace most of the gains accrued over the last few years.  If you would be interested in learning when the bear market of 2015-2017 will start (to the day) and its internal composition, please CLICK HERE.

(***Please Note: A bear market might have started already, I am simply not disclosing this information. Due to my obligations to my Subscribers I am unable to provide you with more exact forecasts. In fact, I am being “Wishy Washy” at best with my FREE daily updates here. If you would be interested in exact forecasts, dates, times and precise daily coverage, please Click Here)Daily Stock Market Update. April 28th, 2015  InvestWithAlex.com

Did you enjoy this article? If so, please share our blog with your friends as we try to get traction. Gratitude!!!

What You Should Expect From The FED Tomorrow Google

Is Today’s Excessive Bullishness Warranted?

Daily Chart April 27 2015

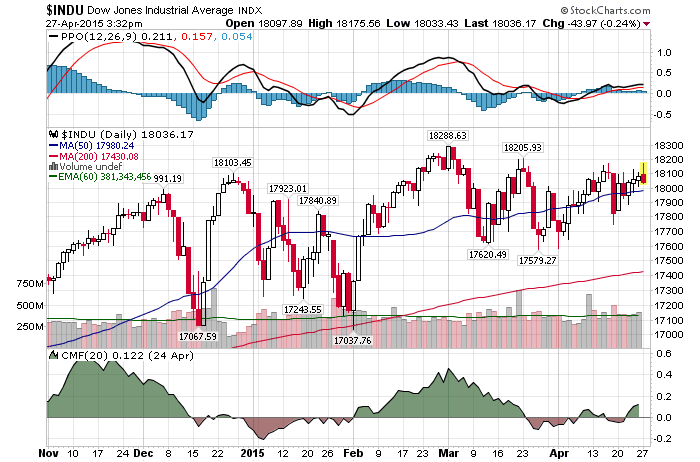
4/27/2015 – A down day with the Dow Jones down 41 points (-0.23%) and the Nasdaq down 32 points (-0.63%)

I would hate to poop on everyone’s parade, BUT the Dow is still sitting well bellow its March 2nd top, IBB is collapsing and I can still argue that we have been in a period of distribution or consolidation since July of 2014.

So, why is that I get the same feeling I had at 2007 top? For instance, Stocks can handle whatever the Fed throws at them

Wow, apparently everything is coming up roses and this market is getting ready to surge higher. That’s one way to look at things. And the other? How a $17 Trillion Bull Market Falls Short Relative to Past

“I look at U.S. stocks as very fully priced,” said Robert Arnott, the chairman of Research Affiliates in Newport Beach, California, and a pioneer in the field of fundamental indexing. About $170 billion is managed using his firm’s investment strategies. “Do I view them immediately vulnerable and dangerous? No. I view them dangerous for long-term investors.”

Now we are getting somewhere. I only have one problem with the statement/article above. “Not immediately vulnerable and dangerous….only for long-term investors?”. Based on my work the stock market can correct in one of two ways. A prolonged decline, similar to what we have experienced on the Dow between 2002 and 2003. Or, a quick drop followed by a prolonged period of consolidation. For instance, 1937.

That is to say, today’s stock market environment, given all of the things I talk about on this blog, is about as dangerous as you can imagine. So much so that investors might see a rapid 20-30% correction in a matter of months. And in an environment where most investors truly believe that such an adjustment is impossible, well, that could be a devastating move for quite a few people.

This conclusion is further supported by my mathematical and timing work. It clearly shows a severe bear market between 2015-2017. In fact, when it starts it will very quickly retrace most of the gains accrued over the last few years.  If you would be interested in learning when the bear market of 2015-2017 will start (to the day) and its internal composition, please CLICK HERE.

(***Please Note: A bear market might have started already, I am simply not disclosing this information. Due to my obligations to my Subscribers I am unable to provide you with more exact forecasts. In fact, I am being “Wishy Washy” at best with my FREE daily updates here. If you would be interested in exact forecasts, dates, times and precise daily coverage, please Click Here). Daily Stock Market Update. April 27th, 2015 InvestWithAlex.com

Did you enjoy this article? If so, please share our blog with your friends as we try to get traction. Gratitude!!!

Is Today’s Excessive Bullishness Warranted?  Google

Stock Picker’s Market….For Short Sellers

Daily Chart April 24 2015

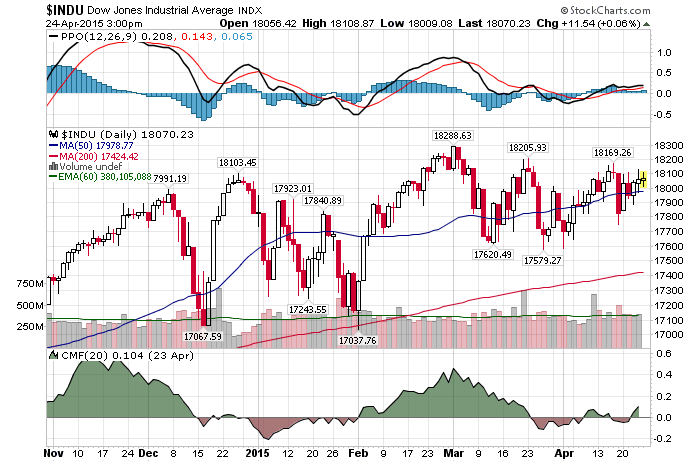
4/24/2015 – A positive day with the Dow Jones up 21 points (+0.12%) and the Nasdaq up 36 points (+0.71%) 

The stock market continues to behave exactly as forecasted. If you would like to find out what happens next, please Click Here. 

Are we in a “stock picker’s” market as this article suggests …….Is this the ‘stock picker’s market’ you’ve been asking for?

The short answer is: NO. We are in the sell/short everything market.

The long answer is a follows. I started my hedge fund on January 1st, 2002. In 2002 the Dow declined 21% (Nasdaq did much worse), while my fund returned +24%, net of fees. How did I do it? Not by shorting. I concentrated on significantly undervalued companies that were selling at dirt cheap prices. You know, your vanilla Warren Buffett kind of stuff.

I remember investing in quite a few home builders and financials. Most of them were significantly undervalued at the time. In other words, that was the stock picker’s market.

Today? Not so much. I wish I was kidding, but I am not exaggerating when I tell you that I am unable to find a single undervalued company in today’s market. Outside of a few special situations. Everything has been driven to exuberant levels. That is the primary difference. We are now in a bigger bubble than we were in 2000-2002.

I would love to buy stocks here, but I cannot. And I am not the only one having this problem. Quite a few successful money managers are seeing the same problem. I wrote about it before. Good Luck Finding Something To Invest In

The moral of the story is, there are times when it makes sense to buy everything in sight (2009 bottom) and the there are times when you should sell everything and run for the exist (2000, 2007 and today). Well, assuming you want to get there before everyone else does.

This conclusion is further supported by my mathematical and timing work. It clearly shows a severe bear market between 2015-2017. In fact, when it starts it will very quickly retrace most of the gains accrued over the last few years.  If you would be interested in learning when the bear market of 2015-2017 will start (to the day) and its internal composition, please CLICK HERE.

(***Please Note: A bear market might have started already, I am simply not disclosing this information. Due to my obligations to my Subscribers I am unable to provide you with more exact forecasts. In fact, I am being “Wishy Washy” at best with my FREE daily updates here. If you would be interested in exact forecasts, dates, times and precise daily coverage, please Click Here). Daily Stock Market Update. April 24th, 2015 InvestWithAlex.com

Did you enjoy this article? If so, please share our blog with your friends as we try to get traction. Gratitude!!!

Stock Picker’s Market….For Short Sellers  Google