The FED To Investors: Expect Panic And Illiquidity

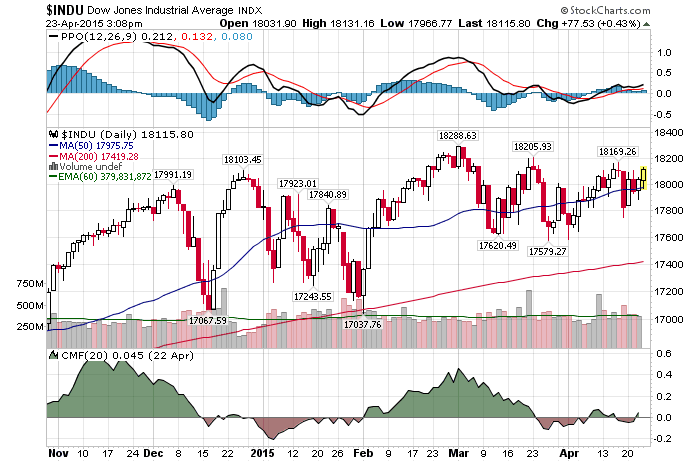
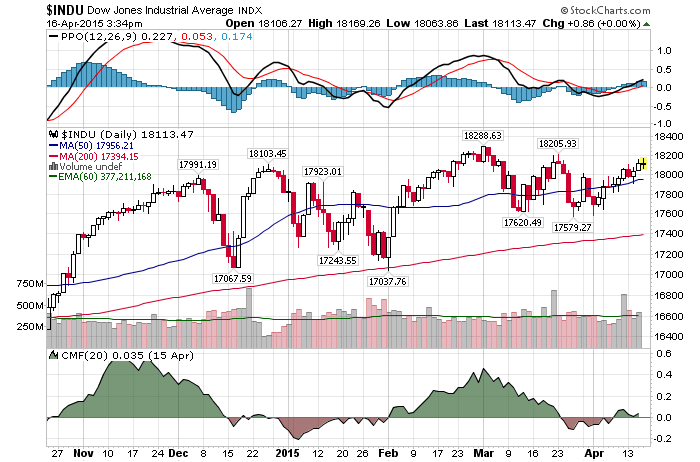
Daily Chart April 23 2015

4/23/2015 – Another up day with the Dow Jones up 21 points (0.11%) and the Nasdaq up 21 points (0.41%)

The stock market continues to behave as anticipated. If you would like to find out what happens next, please click here. 

You know the bubble is getting out of control when even the FED is warning investors about today’s high risk environment.

Market liquidity drought raises alarm bells inside Fed

Sections of the U.S. financial system that may be vulnerable to investor panic are raising concerns inside the Federal Reserve, as policymakers preparing for the first interest-rate hike in nearly a decade seek to ensure the market is ready and able to handle it whenever it happens.

Liquid markets could quickly turn illiquid in response to a shift in Fed policy or some other shock, which could amplify any adverse market response, as occurred during the taper tantrum.

In other words, investors continue to play chicken with the FED. Here is one thing most investors are forgetting. Given recent all time highs on most major indices, the volume has been declining. This is atypical and suggests that the stock market is already illuquid. I wrote about it before Top Hedge Fund Manager: No Liquidity, Stock Market Shock Is Imminent

Does that mean we are about to experience the repeat of 2007-2009? Not likely in terms of magnitude of the move, but it is quite possible that any upcoming correction will be violent.

This conclusion is further supported by my mathematical and timing work. It clearly shows a severe bear market between 2015-2017. In fact, when it starts it will very quickly retrace most of the gains accrued over the last few years.  If you would be interested in learning when the bear market of 2015-2017 will start (to the day) and its internal composition, please CLICK HERE.

(***Please Note: A bear market might have started already, I am simply not disclosing this information. Due to my obligations to my Subscribers I am unable to provide you with more exact forecasts. In fact, I am being “Wishy Washy” at best with my FREE daily updates here. If you would be interested in exact forecasts, dates, times and precise daily coverage, please Click Here). Daily Stock Market Update. April 24th, 2015 InvestWithAlex.com

Did you enjoy this article? If so, please share our blog with your friends as we try to get traction. Gratitude!!!

The FED To Investors: Expect Panic And Illiquidity Google

Coming Soon: Trade Of The Decade?

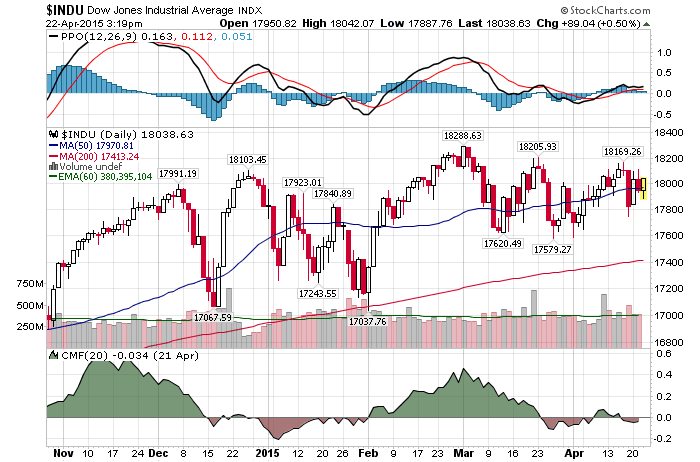
Daily Chart April 22 2015

4/22/2015 – A positive day with the Dow Jones up 88 points (+0.49%) and the Nasdaq up 21 points (+0.42%) 

In last night’s daily update I have suggested that today’s short setup is about as ideal as the long setup was at 2009 bottom. Hence, short sellers should be thankful for such high prices.

Bill Gross introduces the same idea, but in the bond market Bill Gross’s ‘Short of a Lifetime’ Would Mean Armageddon (watch the video, it’s worth your time).

“It’s Just A Matter Of Time”

While the conversation in the link above has to do with zero yielding German bonds, the same line of thinking should apply to the US Treasury market. At some point “follow the FED” trade will fail and the yields will surge. And while I don’t think we are there yet, it is just a matter of time. As a result, my forecast remains, 10-Year Treasury note will see a double bottom at 1.4-1.5% over the next two years before this 30 year bull run in yields is over.

When it comes to the stock market, “short equity” setup we are facing today is about as ideal as it was at 2000 and 2007 tops. Very limited upside or risk (if any) and massive downside. In other words, long-term investors should heed the lessons of two previous market tops. And instead of trying to figure out how many more years this secular bull market has left (hint: we are still in a secular bear market that started in 2000), they should seriously consider shifting their portfolios to the short side or cash.

This conclusion is further supported by my mathematical and timing work. It clearly shows a severe bear market between 2015-2017. In fact, when it starts it will very quickly retrace most of the gains accrued over the last few years.  If you would be interested in learning when the bear market of 2015-2017 will start (to the day) and its internal composition, please CLICK HERE.

(***Please Note: A bear market might have started already, I am simply not disclosing this information. Due to my obligations to my Subscribers I am unable to provide you with more exact forecasts. In fact, I am being “Wishy Washy” at best with my FREE daily updates here. If you would be interested in exact forecasts, dates, times and precise daily coverage, please Click Here). Daily Stock Market Update. April 22nd, 2015  InvestWithAlex.com

Did you enjoy this article? If so, please share our blog with your friends as we try to get traction. Gratitude!!!
Coming Soon: Trade Of The Decade  Google

Why Short Sellers Should Be Thanking GOD

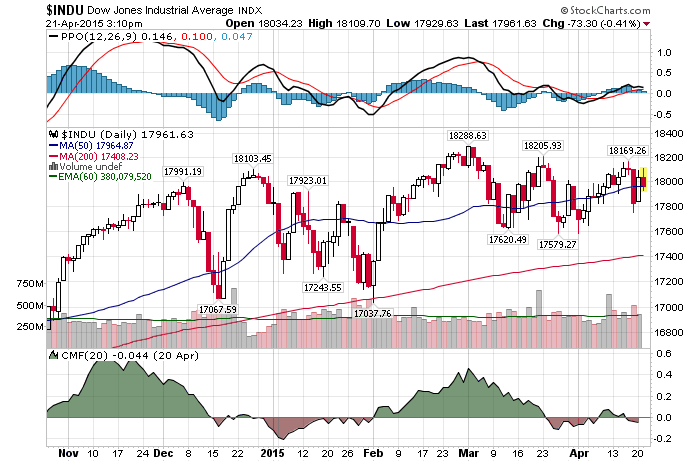
Daily Chart April 21A 2015

4/21/2015 – A mixed day with the Dow Jones down 85 points (-0.47%) and the Nasdaq up 19 points (+0.39%)

Short sellers, repeat after me….

  • An opportunity to short Netflix (NFLX) at $570? Thank you Jesus (or whoever you pray to).
  • An opportunity to short Biotech (IBB) at $364?  Praise the Lord.
  • The Nasdaq is at 5,000…… Hallelujah.

On a more serious note, once in the while the stock market does something so utterly stupid, it takes your breath away.  What am I talking about? Today’s divergence between fundamental/macro data and the market’s bubble valuation levels. I wrote about it earlier Why The FED Has No Clue. Yet, despite this apparent ideal short trade setup, it’s not as easy as it sounds.

For short-sellers in U.S. stocks, the agony just piles on

“How are you supposed to actively short stocks in this environment? It has been impossible,” Seattle-based Fleckenstein told Reuters.

His frustration is shared by others dedicated to betting on declines, if not for the broader market then for individual stocks that look overvalued. Outside of the hard-hit energy industry, most sectors have performed well over the last several months, and dedicated short funds have been stung.

The biggest take away from the article above is not that short sellers have been unable to make money, but rather, the fact even the best researched and most successful short sellers are afraid to enter this market on the short side.

Isn’t that bullish? 

On the contrary. That suggests three things. First, everyone is already in. Just as they were at 2000 and 2007 tops. Second, the market has been distributing for close to 9 months. Finally, any upcoming bear leg is likely to be fast/violent. In other words, today’s short sellers should be grateful for the many amazing money making opportunities the market offers.

This conclusion is further supported by my mathematical and timing work. It clearly shows a severe bear market between 2015-2017. In fact, when it starts it will very quickly retrace most of the gains accrued over the last few years.  If you would be interested in learning when the bear market of 2015-2017 will start (to the day) and its internal composition, please CLICK HERE.

(***Please Note: A bear market might have started already, I am simply not disclosing this information. Due to my obligations to my Subscribers I am unable to provide you with more exact forecasts. In fact, I am being “Wishy Washy” at best with my FREE daily updates here. If you would be interested in exact forecasts, dates, times and precise daily coverage, please Click Here). Daily Stock Market Update. April 21st, 2015  InvestWithAlex.com

Did you enjoy this article? If so, please share our blog with your friends as we try to get traction. Gratitude!!!
Why Short Sellers Should Be Thanking GOD Google

How It Was Possible To Predict Today’s Stock Market Bloodbath

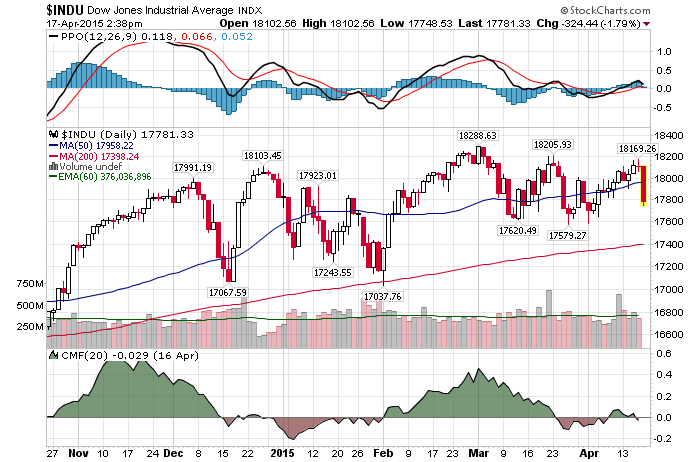
Daily Chart April 17 2015

4/17/2015 – A big down day with the Dow Jones down 280 points (-1.55%) and the Nasdaq down 76 points (-1.52%). 

The stock market continues to behave exactly as forecasted. If you would like to find out what happens next, please Click Here.

So, was it possible to predict today’s sell-off?

Sure, but you wouldn’t be able to forecast or anticipate it with the help of either fundamental or technical analysis.  You would need something more. You would need TIMING analysis.

Most investors measure the movements of their underlying financial instruments in PRICE only. That is a wrong approach. Don’t forget, all charts consist of two axis. Price and time. By concentrating only on the price portion of the equation, investors and analyst leave out 50% of necessary data. TIME data needed to make accurate stock market forecasts. In other words, we need to unify price and time.

To fully understand how to do that, get two free chapters of my book Timed Value. 

Let’s take a quick look at the real stock market example to see the amazing precision this particular technique can offer us.

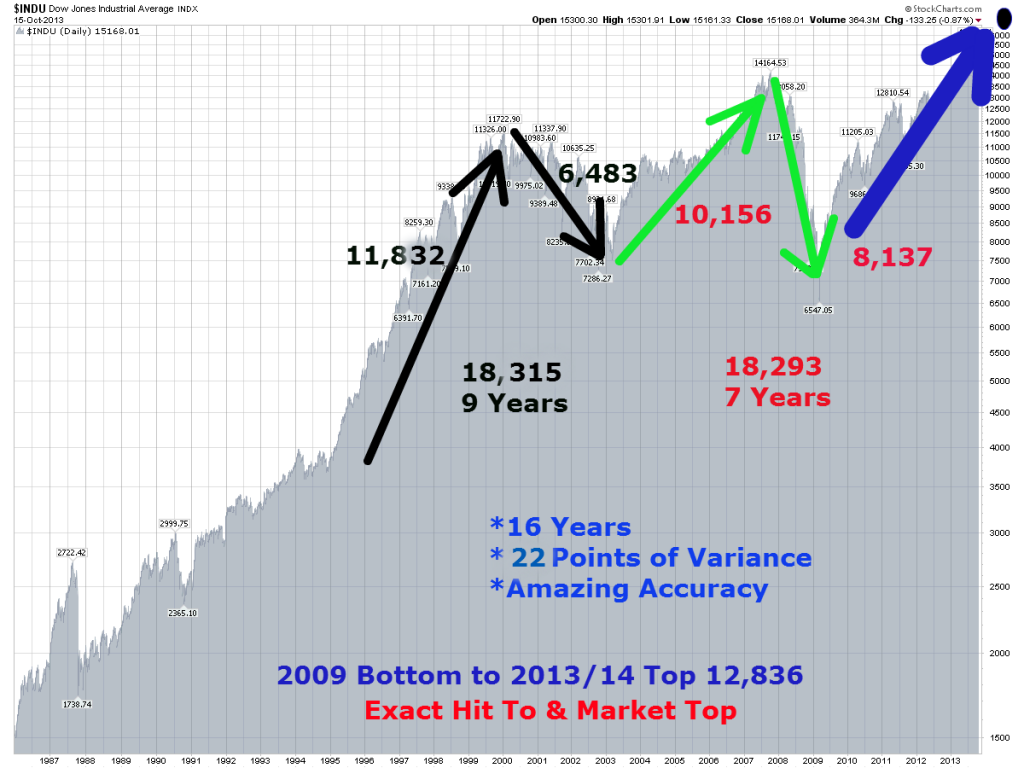
Long Term Dow Structure35

I cannot overstate how amazing this chart is. Just a few points. (3-DV stands for 3-Dimensional Value)

  • As we have already discussed, the move between 1994 bottom and 2000 top was 11,832 3-DV UNITS. The Dow topped at exactly 11,866 in January of 2000. Amazing!!!
  • The up move between 1994 bottom and 2000 top was 11,832 3-DV UNITS. The down move between 2000 top and 2002 bottom was 6,483 3-DV UNITS. When you combine both values together you end up with a value of 18,315 3-DV UNITS. The move took 9 years.
  • The up move between 2002 bottom and 2007 top was 10,156 3-DV UNITS. The down move between 2007 top and 2009 bottom was 8,137 3-DV UNITS. When you combine both values together you end up with a value of 18,293 3-DV UNITS. The move took 7 years.

To summarize, the combined move took 16 years and there was only 22 3-DV UNITS of variance between two sections. This variance over the 16 year period of time can be attributed to as little as 2 trading days and a few hundred points on the Dow. This example alone should put to rest all claims that the stock market is random and unpredictable. Once again, when we identify the exact structure of the stock market through using our 3-Dimensional analysis we can time the market with great precision.

For example, if we understand the structure above we know that the move between 2002 bottom and 2009 bottom will be identical in 3-DV UNITS of the move between 1994 bottom and 2002 bottom. Just by having this information alone one should be able to figure out the stock market with great precision. Further, once we have hit the 2007 top on the DOW, any analyst using this technique knows that the upcoming down move will be exactly 8,127 3-DV UNITS. (18283-10156=8,127)

That would mean that once the 2007 top is confirmed you would know exactly where the market would bottom. So, while everyone is freaking out in the late 2008 and early 2009 you are either shorting the market and making a lot of money or you are setting yourself up for the upcoming bull market that you know will start in March of 2009. Same thing or calculations apply to the December 31st, 2013 top on the Dow Jones.

I hope this clearly illustrates how powerful this type of an analysis can be.  Again, once the market structure is fully understood you would know not only where but WHEN the market would turn.

So, what does the future hold…….will we get another bounce (buy the dip) or is this sell-off just getting started? 

Well, my mathematical and timing work clearly shows a severe bear market between 2015-2017. In fact, when it starts it will very quickly retrace most of the gains accrued over the last few years.  If you would be interested in learning when the bear market of 2015-2017 will start (to the day) and its internal composition, please CLICK HERE.

(***Please Note: A bear market might have started already, I am simply not disclosing this information. Due to my obligations to my Subscribers I am unable to provide you with more exact forecasts. In fact, I am being “Wishy Washy” at best with my FREE daily updates here. If you would be interested in exact forecasts, dates, times and precise daily coverage, please Click Here). Daily Stock Market Update. April 17th, 2015  InvestWithAlex.com

Did you enjoy this article? If so, please share our blog with your friends as we try to get traction. Gratitude!!!
How It Was Possible To Predict Today’s Stock Market Bloodbath Google

Shocking: Why The Stock Market Deserves Infinite Valuation

Daily Chart April 16 2015

4/16/2015 – A down day with the Dow Jones down 7 points (-0.04%) and the Nasdaq down 3 points (-0.06%) 

According to quite a few market pundits, the party in the equity markets hasn’t even started yet. Case and point

I cannot stop shaking my head in disbelief. To save you some time, here is what was said:

“This is an extraordinary buying opportunity, buy any and all dips, with zero interest rates the price of equities could be infinite, this bull market will continue, valuation don’t matter anymore, etc….”

Valuations don’t matter……infinite run ups are just around the corner …..buy now. That sounds familiar. If I didn’t hear the exact same thing at 2007 and 2000 tops, well, call me a fool.

Again, the underlying assumption in both cases is the same. We are in such a unique monetary easing environment that there is no way in hell the markets can go down. Maybe so, but here is the major point that most investors miss. Today’s market environment becomes a matter of psychological setup as opposed to a fundamental background.

When everyone and their day trading grandmother believe that we are in such a bullish environment, the market is getting ready to reverse. Why? Well, it’s rather simple, everyone has already bought into the long side of the market. Contrary to the opinion of the market pundits above, I would argue that the only opportunity here is on the short side (or in cash).

This conclusion is further supported by my mathematical and timing work. It clearly shows a severe bear market between 2015-2017. In fact, when it starts it will very quickly retrace most of the gains accrued over the last few years.  If you would be interested in learning when the bear market of 2015-2017 will start (to the day) and its internal composition, please CLICK HERE.

(***Please Note: A bear market might have started already, I am simply not disclosing this information. Due to my obligations to my Subscribers I am unable to provide you with more exact forecasts. In fact, I am being “Wishy Washy” at best with my FREE daily updates here. If you would be interested in exact forecasts, dates, times and precise daily coverage, please Click Here). Daily Stock Market Update. April 17th, 2015  InvestWithAlex.com

Did you enjoy this article? If so, please share our blog with your friends as we try to get traction. Gratitude!!!
Shocking: Why The Stock Market Deserves Infinite Valuation  Google

The FED Expects An Economic Boom, WTF?

Daily Chart April 15 2015

4/15/2015 – A positive day with the Dow Jones up 74 points (+0.41%) and the Nasdaq up 34 points (+0.68%). 

Something strange is in the air. While most people will agree that we are heading towards some sort of an economic storm, most believe we won’t see any major trouble before 2017-2018, even as late as 2022. So much so that St. Louis Fed President James Bullard believes the US Economy is about to boom.

Fed’s Bullard says rate hikes are needed for coming ‘boom’

Now, wait a second. Let’s bring an ounce of common sense to the statement above. Since 2009 bottom we have lived in an environment of zero interest rates and 3 massive capital infusions in the form of QE. And even with all of that money floating around the US Economy has failed to show any signs of a “Boom”.

Sure, our capital markets have experienced a massive boom, but as I have shown here so many times before, the US Economy is rolling over and accelerating down.

Bullard: We risk a market bubble if we don’t move on monetary policy

“A risk of remaining at the zero lower bound too long is that a significant asset market bubble will develop.”

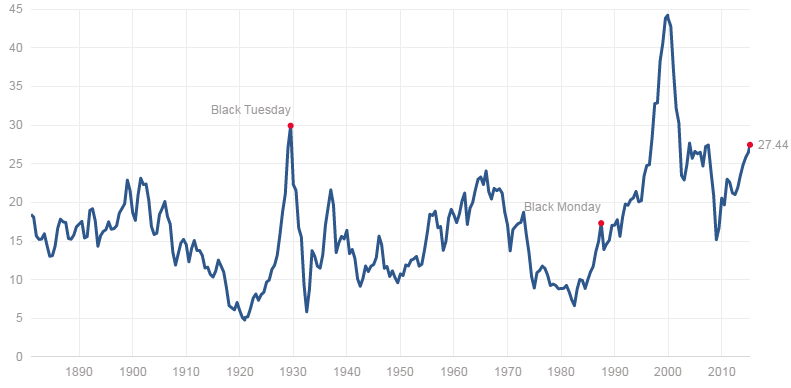
Earth to Bullard: We are already in a massive bubble. It is already too late. And you don’t need a fancy Harvard Ph.D. nor do you have to look further than the chart below to fully realize that. Take a look.

The market is now more expensive than at 1907,1937, 1966,1972 and 1987 tops. Just as expensive as at 1929 and 2007 tops. Only 2000 top stands above (due to the tech bubble and the lack of earnings at that time  – arguably that number can be dismissed). And the charlatans at the FED have the audacity to claim that there is “No Bubble”? Despite QE, zero interest rates, stock buybacks, high margin debt, etc…. Seriously, WTF?

This leads me to stand by my earlier statement. The FED has no clue.  

PE Ratio

This conclusion is further supported by my mathematical and timing work. It clearly shows a severe bear market between 2014/15-2017. In fact, when it starts it will very quickly retrace most of the gains accrued over the last few years.  If you would be interested in learning when the bear market of 2014/15-2017 will start (to the day) and its internal composition, please CLICK HERE.

(***Please Note: A bear market might have started already, I am simply not disclosing this information. Due to my obligations to my Subscribers I am unable to provide you with more exact forecasts. In fact, I am being “Wishy Washy” at best with my FREE daily updates here. If you would be interested in exact forecasts, dates, times and precise daily coverage, please Click Here). Daily Stock Market Update. April 15th, 2015  InvestWithAlex.com

Did you enjoy this article? If so, please share our blog with your friends as we try to get traction. Gratitude!!!
The FED Expects An Economic Boom, WTF? Google

Dream Big & Speculate Away

Daily Chart April 14 2015

4/14/2015 – A mixed day with the Dow Jones up 60 points (+0.33%) and the Nasdaq down 11 points (-0.22%).  

Everyday I attempt to bring you a few more data points in order to illustrate that we are in a massive financial bubble. We have two more today. First, Mr. Cramer.

Cramer: Go for it! Dream big for your portfolio

Where Mr. Cramer tries to convince me that I am just not intelligent enough to understanding proper valuation techniques.  You see, its not that Netflix, Facebook, Twitter, Alibaba, etc…. are overvalued, I am just too stupid to understand how to value them properly.

Cramer thinks that some stocks are undervalued simply because investors just can’t think big enough and imagine what could happen in the future. And there could be big bucks in store if investors try to think outside of the box.

So, dream big and buy on margin. After all, it appears we live in a world where valuations no longer matter. Call me crazy, but I think Mr. Cramer had the exact same view at 2000 and 2007 tops.

Second, about a month ago Mark Cuban brought up the issue of a massive venture capital bubble and its illiqudity. I wrote about it earlier What Most People Don’t Know About Mark Cuban’s Bubble Call. It also important to note that the same bubble exists in today’s private equity funds. Well, at least in their attempts to take this junk public at incredible valuation levels (watch the video below).

That is to say, the game of musical chairs continues to intensify. In both private and public markets. When will it stop? Based on my work, we do not have that much, if any, time left. Big losses are ahead.

This conclusion is further supported by my mathematical and timing work. It clearly shows a severe bear market between 2014/15-2017. In fact, when it starts it will very quickly retrace most of the gains accrued over the last few years.  If you would be interested in learning when the bear market of 2014/15-2017 will start (to the day) and its internal composition, please CLICK HERE.

(***Please Note: A bear market might have started already, I am simply not disclosing this information. Due to my obligations to my Subscribers I am unable to provide you with more exact forecasts. In fact, I am being “Wishy Washy” at best with my FREE daily updates here. If you would be interested in exact forecasts, dates, times and precise daily coverage, please Click Here). Daily Stock Market Update. April 14th, 2015  InvestWithAlex.com

Did you enjoy this article? If so, please share our blog with your friends as we try to get traction. Gratitude!!!

Dream Big & Speculate Away Google

Why The FED Has No Clue

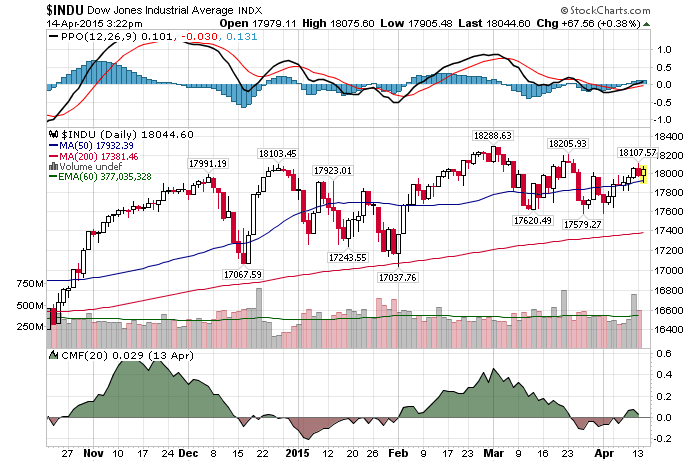
Daily Chart April 13 2015

4/13/2015 – A down day with the Dow Jones down 81 points (-0.45%) and the Nasdaq down 8 points (-0.15%). 

The stock market continues to behave as forecasted. If you would like to find out what happens next, please Click Here.

Despite the appearance of having complete control over our financial markets, the FED might lose that power of perception fairly soon. And once the FED trade goes, the markets should implode. I have long argued that the FED has no idea of where we are and what their reckless QE and zero interest rate policy has done.  Case and point…..

Exclusive: Fed’s Williams sees less risk of rate retreat after lift-off

“So even if the economy got some bad shocks, really you are probably just talking about flattening that path out a bit, or maybe raising rates more slowly.”

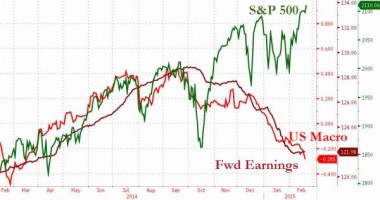
Economic lift-off……what economic lift-off? See, I told you they were clueless. Over the last few months I have presented at least a dozen data points showing that the US Economy is rolling over and accelerating down. (Ex: chart below). Plus, forward earnings and guidance are expected to be adjusted lower due to the strong dollar and the same economic issues. We should see the evidence of that in Q-1 reports.

Finally, no matter what the FED says, asset bubbles do not translate to strong economic growth. The view Mr. Williams has is identical to the view Mr. Bernanke held in Q-1 of 2008. As the FED minutes revealed, Mr. Bernanke was concerned about overheating the economy and the housing sector. The 2007-2009 bear market was pushing into its 6th month by that point.

That is to say, don’t rely on the FED to make your investment decisions. And if you do, you will pay dearly for it.

Macrodata

This conclusion is further supported by my mathematical and timing work. It clearly shows a severe bear market between 2014/15-2017. In fact, when it starts it will very quickly retrace most of the gains accrued over the last few years.  If you would be interested in learning when the bear market of 2014/15-2017 will start (to the day) and its internal composition, please CLICK HERE.

(***Please NoteA bear market might have started already, I am simply not disclosing this information. Due to my obligations to my Subscribers I am unable to provide you with more exact forecasts. In fact, I am being “Wishy Washy” at best with my FREE daily updates here. If you would be interested in exact forecasts, dates, times and precise daily coverage, please Click Here). Daily Stock Market Update. April 13th, 2015  InvestWithAlex.com

Did you enjoy this article? If so, please share our blog with your friends as we try to get traction. Gratitude!!!
Why The FED Has No Clue Google

Shocking: The Same Price Buys You Either A 9 Bedroom Castle Or A 1 Br Apartment

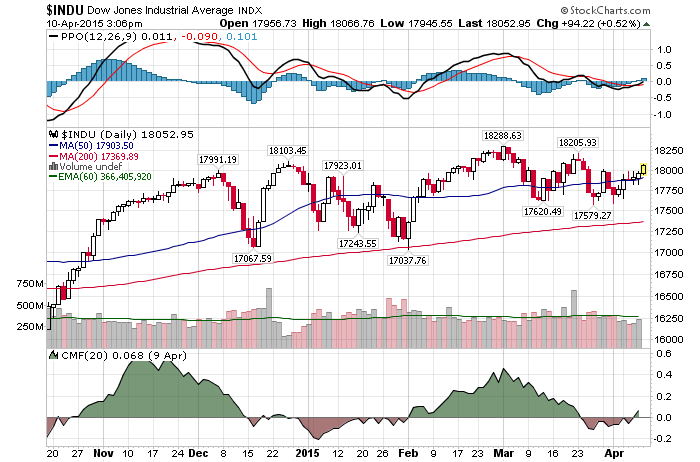
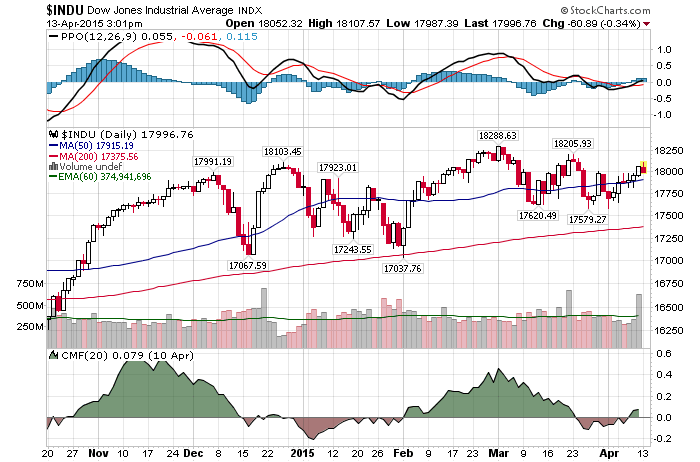
Daily Chart April 10 2015

4/10/2015 – Another positive day with the Dow Jones up 99 points (+0.55%) and the Nasdaq up 21 points (+0.43%). 

The market continues to behave as forecasted. If you would like to find out what happens next, please Click Here.  A lot of stuff to to cover this Friday.

First, here is a question……for the same amount of money, would you buy a 9 Br Castle in France or a 1 Br crappy apartment with no balcony in Sydney?  

Don’t for a second think that I have forgotten about our persisting Real Estate bubble. Nothing new on that front. The dead cat bounce off of 2010-2011 bottom is now over, the market is rolling over and it will accelerate down over the next 5 years. Most likely in conjunction with the upcoming recession and a bear market in equities. Our friend MISH has a jaw dropping post on 10 French Castles that are Cheaper than Sydney Units. Check it out. 

 Second, Einhorn Says Too Much Easy Money Is Holding Back U.S. Economy

Greenlight Capital’s Einhorn makes his point by discussing the pros and cons of jelly donuts. “My point is that you can have too much of a good thing and overdoses are destructive. Chairman Bernanke is presently force-feeding us what seems like the 36th Jelly Donut of easy money and wondering why it isn’t giving us energy or making us feel better. Instead of a robust recovery, the economy continues to be sluggish. Last year, when asked why his measures weren’t working, he suggested it was “bad luck.”

The problem is, the damage has already been done and it is now impossible to avoid the consequences. In this case, the consequences being a severe bear market in equities and a deep recession within the US Economy. Current weakness and collapsing economic variables, despite zero interest rates and a massive liquidity infusion, is a clear evidence of that.

Finally, Dimon, now Summers: There’s a liquidity problem

Both Dimon and Summers believe there might be a liquidity problem in the bond market. An issue that concerns both of them very much. I am beginning to hear anecdotal evidence that is the case within the stock market as well. While my positions are not large enough to trigger liquidity concerns, some of the bigger guys out there are starting to have problems liquidating their postions.

Or so I hear.  In terms of press, Crispin Odey of Odey Asset Management talks about just that in The Secret Behind This Hedge Fund Manager’s Market Collapse Prediction. That is to say, should the market start a significant decline, we might see liquidity vanish overnight. We saw a little bit of that in October of 2014. Point being, if/when things get ugly, they will get ugly fast.

This conclusion is further supported by my mathematical and timing work. It clearly shows a severe bear market between 2014/15-2017. In fact, when it starts it will very quickly retrace most of the gains accrued over the last few years.  If you would be interested in learning when the bear market of 2014/15-2017 will start (to the day) and its internal composition, please CLICK HERE.

(***Please Note: A bear market might have started already, I am simply not disclosing this information. Due to my obligations to my Subscribers I am unable to provide you with more exact forecasts. In fact, I am being “Wishy Washy” at best with my FREE daily updates here. If you would be interested in exact forecasts, dates, times and precise daily coverage, please Click Here). Daily Stock Market Update. April 10th, 2015  InvestWithAlex.com

Did you enjoy this article? If so, please share our blog with your friends as we try to get traction. Gratitude!!!
Shocking: The Same Price Buys You Either A 9 Bedroom Castle Or 1 Bedroom Apartment Google

Good Luck Finding Something To Invest In

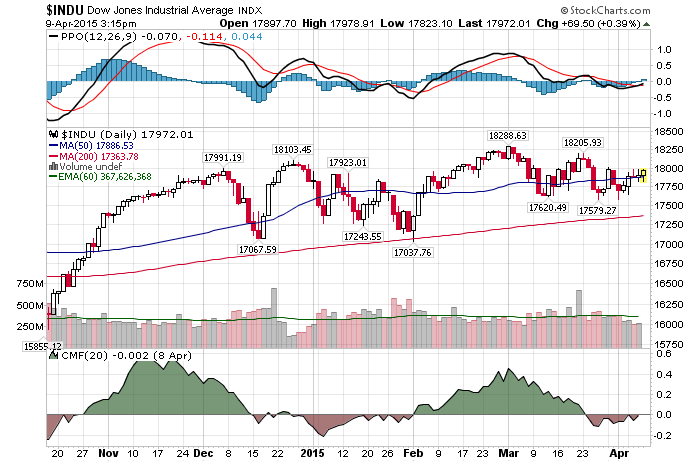
Daily Chart April 9 20154/09/2015 –  A positive day with the Dow Jones up 56 points (+0.31%) and the Nasdaq up 24 points (+0.48%).

The stock market continues to behave as forecasted. If you would like to find out what happens next, please Click Here.

I continue on with my relentless drive to suggest that today’s market environment is about as close to 2000 and 2007 tops as one can get.  And just as back then, very few people are listening or paying attention. Today’s analysis deals with the lack of investment opportunities. (take a look at the article….it is worth 2 minutes of your time).

Managers say they haven’t changed, the market has. The easy money climate of near-zero interest rates engineered by the Federal Reserve has artificially inflated prices of lower-quality U.S. stocks, they say, punishing those who focus on businesses with the best fundamentals. At the same time, the relentless climb of prices across equity markets has left them with few chances to sniff out bargains or show what they can do in more-volatile times.

“In straight-up markets you don’t need active managers,” D’Alelio said in a telephone interview. “If the next five years are the same, there won’t be any active managers left.”

Not only do I agree and sympathize with the sentiment above, I find myself in the same boat. There is nothing to invest in. Now, pay attention. I didn’t say to “speculate in”, I have said “to invest in”.

Proper investing demands initial undervaluation in growth or value as a starting point. With most stock being excessively overvalued, finding a reasonably priced investment opportunity at this juncture is just about as tough as finding Hillary Clinton’s lost emails.

At least at 2000 top most of the money flowed into technology and there were a multitude of cheap and unknown investment opportunities laying by the way side. That is not the case today. Everything, and I mean everything has been driven up to excessive levels. We all know how this ends.

This conclusion is further supported by my mathematical and timing work. It clearly shows a severe bear market between 2014/15-2017. In fact, when it starts it will very quickly retrace most of the gains accrued over the last few years.  If you would be interested in learning when the bear market of 2014/15-2017 will start (to the day) and its internal composition, please CLICK HERE.

(***Please NoteA bear market might have started already, I am simply not disclosing this information. Due to my obligations to my Subscribers I am unable to provide you with more exact forecasts. In fact, I am being “Wishy Washy” at best with my FREE daily updates here. If you would be interested in exact forecasts, dates, times and precise daily coverage, please Click Here). Daily Stock Market Update. February 24th, 2015  InvestWithAlex.com

Did you enjoy this article? If so, please share our blog with your friends as we try to get traction. Gratitude!!!
Good Luck Finding Something To Invest In Google