Why The FED Will Be Powerless To Stop An Upcoming Bear Market

Daily Chart April 8 2015

4/8/2015- A positive day with the Dow Jones up 27 points (+0.15%) and the Nasdaq up 40 points (+0.83%). 

As far as I am concerned there is only one thing, and one thing only, that is holding this market together. The FED and investors blind faith in the fact that the FED will be able to stop any and all market corrections. Either through QE, interest rates or by simply making statements to the press. So much so that every single bottom over the last couple of months can be attributed to the FED talk.  El-Erian tends to agree. Danger, Danger — ‘Market Is in Love With Central Bank Trade’

Here are the 3 reasons as to why this “herd mentality trade” will blow up in investors faces.

  1. The Fed is a Reactionary Force: If we study the past, the FED has always been late to react to any and all market developments. For instance, Bernanke was talking about the accelerating US Economy as late as Q1 of 2008. They have no clue and there is no reason to believe that this time will be any different.
  2. The Market Will Decline Anyway: My mathematical and timing work makes it very clear. Over the short-term the market is independent of all fundamental inputs. That is to say, the market will top out on a certain date in 2015 and initiate its decline. No matter what the FED does or say. That day is approaching fast.
  3. Investors Will Lose Confidence In The FED: This is unavoidable. As soon as the FED is unable to backstop the next decline, most investors will lose confidence in a millisecond.  That in itself will accelerate the decline

The main take away from the points above is as follows. The FED trade will be in place until it is not.  The problems is, by the time most investors realize this fact, it will already be too late. By the time the analysis above becomes a reality, the stock market will already be down 10-25%.

This conclusion is further supported by my mathematical and timing work. It clearly shows a severe bear market between 2015-2017. In fact, when it starts it will very quickly retrace most of the gains accrued over the last few years.  If you would be interested in learning when the bear market of 2015-2017 will start (to the day) and its internal composition, please CLICK HERE.

(***Please Note: A bear market might have started already, I am simply not disclosing this information. Due to my obligations to my Subscribers I am unable to provide you with more exact forecasts. In fact, I am being “Wishy Washy” at best with my FREE daily updates here. If you would be interested in exact forecasts, dates, times and precise daily coverage, please Click Here)Daily Stock Market Update. April 8th, 2015  InvestWithAlex.com

Did you enjoy this article? If so, please share our blog with your friends as we try to get traction. Gratitude!!!

Why The FED Will Be Powerless To Stop An Upcoming Bear Market Google

Will Lower Earnings Plunge The Market?

Daily Chart April 7 2015

4/7/2015 – A down day with the Dow Jones down 8 points (-0.04%) and the Nasdaq down 7 points (-0.14%).

The stock market continues to behave, more or less, as forecasted. If you would like to find out what happens next, please Click Here. 

How can I tell that we are in the stock market bubble?

This is rather simple. Just take a look at today’s P/E ratio (see the chart below). The chart displays Shiller Adjusted P/E Ratio of 27.12 (Current S&P 500 PE Ratio: 20.39). As you can see for yourself, we are once again pushing the limit. This ratio becomes even worse when we realize that most of the earnings over the last few years have been driven by QE, Zero Interest Rates and stock buybacks. Not fundamentals. Just as a reference points, bear markets end with a P/E of 5-10 (after earnings have collapsed).

In the meantime, the US Economy is rolling over the earnings are expected to decline……BANK OF AMERICA: We’re heading for an earnings recession

“In the last two periods of dollar strength (1978-85, 1995-02), which each included at least one recession, PE multiples expanded by 39% and 52% (3 and 8 multiple points), respectively,” BAML notes. “Similarly, in this cycle the S&P 500 PE multiples have continued to rise amid the years of significant dollar strength.”

I have to laugh at this. Bank Of America expects P/E expansion to continue while earnings collapse, the US economy rolls over and the FED possibly hikes rates?????

This insanity only makes sense in a financial bubble and that is precisely where we are today. In other words, the stock market is perfectly setup for a big decline here. The question is, are you ready for it?

PE Ratio

This conclusion is further supported by my mathematical and timing work. It clearly shows a severe bear market between 2015-2017. In fact, when it starts it will very quickly retrace most of the gains accrued over the last few years.  If you would be interested in learning when the bear market of 2015-2017 will start (to the day) and its internal composition, please CLICK HERE.

(***Please Note: A bear market might have started already, I am simply not disclosing this information. Due to my obligations to my Subscribers I am unable to provide you with more exact forecasts. In fact, I am being “Wishy Washy” at best with my FREE daily updates here. If you would be interested in exact forecasts, dates, times and precise daily coverage, please Click Here). Daily Stock Market Update. April 7th, 2015  InvestWithAlex.com

Did you enjoy this article? If so, please share our blog with your friends as we try to get traction. Gratitude!!!

Will Lower Earnings Plunge The Market? Google

Scary: Long-Term Cycles Show The Stock Market Will…..

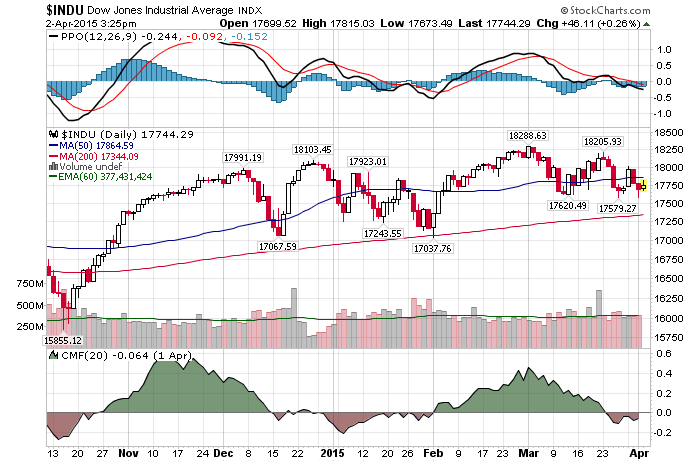
Daily Chart April 2 2015

4/2/2015 – A positive day with the Dow Jones up 64 points (+0.36%) and the Nasdaq up 6 points (+0.14%) 

Below is a comprehensive longer-term review of the stock market and what the next few years hold. 

In the early January of 2000, the US Economy wa s booming. The Dow was fast approaching 11,800 and the Nasdaq was a stone throws away from its improbable benchmark of 5,000. Everyone was making a ton of money and as far as most people were concerned, the future looked very bright.  So much so, that very few people predicted a bear market of 2000-2002, let alone a secular 2000-2017 bear market that was about to begin.

The only way to do so was to know and to understand the cyclical TIME structure oscillating within the stock market.  For instance, an analyst working with such time cycles would know that the stock market’s 17-18 year cycle was topping out in conjunction with the 5 year cycle that started at 1994 bottom.  The bull market that started at the bottom in August of 1982 was coming to a conclusion. In fact, it would top out exactly 17.5 years after it had started or on January 14th, 2000 at 11,800. The 5 year cycle that started in December of 1994 would top out at exactly the same time; 5 years and 35 trading days after it had started.

What does this have to do with predicting a severe bear market of 2014/15-2017?

Everything.  Based on my work the stock market is a mathematically precise entity. And while there are hundreds of TIME cycles oscillating within the stock market at any one time, I will concentrate on only two to prove my point.  The 17-18 cycle and the 5 year cycles. We will look at these cycles over the last 100+ years and I will prove to you, without a shadow of a doubt, they work.

THE 17-18 YEAR CYCLE IN THE STOCK MARKET:
Long Term Dow Structure3

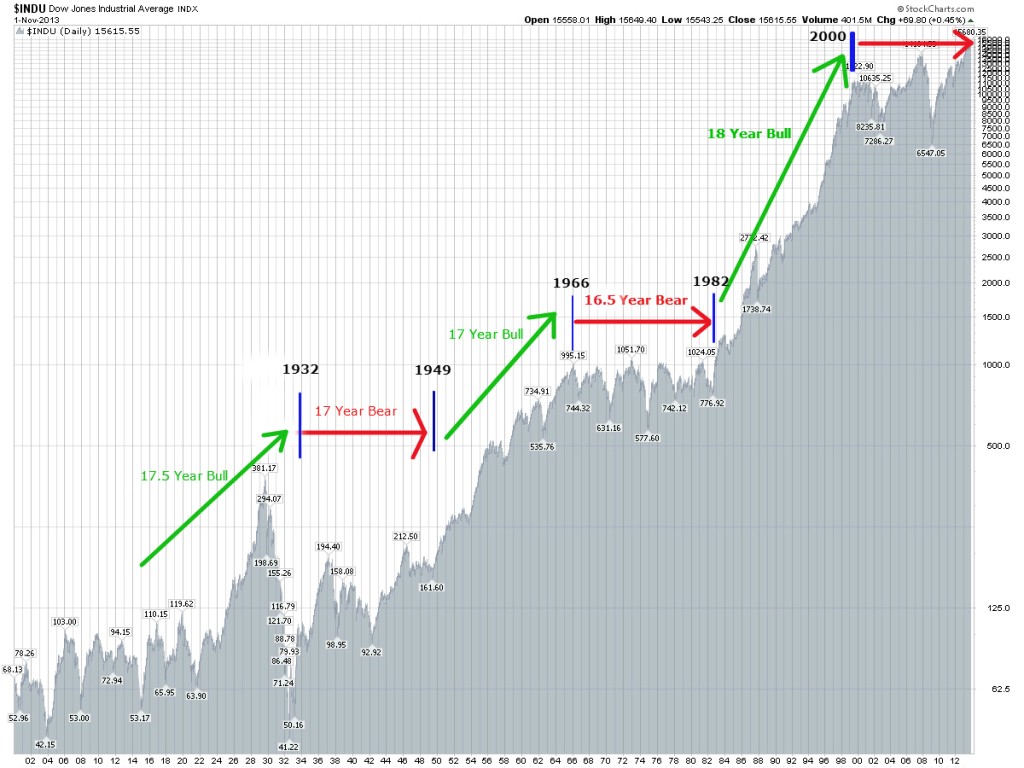
Long-term cycles within the stock market tend to oscillate going all the way back to the first day of trading, in May of 1790.  If you would be inclined, I would encourage you to verify that information for yourself. For our purposes we will start our analysis a little bit later or exactly 100 years ago. As the chart above indicates, the stock market tends to oscillate in clearly defined 17-18 year alternating Bull/Bear market cycles.

  • 17.5 Year Bull Market (1914 bottom to 1932 bottom): The previous bear market terminated in July of 1914. At that time the US stock market shut down for World War 1. The stock market remained closed between August of 1914 and December of 1914 (a very rare occurrence). When the market finally reopened in December of 1914 it immediately began a rally that would not terminate until October of 1929. Followed by a now famous 1929 stock market crash and a massive 90% 3 year decline. The cycle terminated at the bottom in 1932, completing the 17.5 year bull market cycle at that time.

*Note: It is important to address the 1929-1932 bear market and its impact on the overall 1914-1932 Bull Market cycle. It is a complex matter to discuss without sufficient background or understanding, but the final (short-term) structural composition of this Bull Cycle inverted over the last 3 years (1929-1932). Mostly due to a massive rally between 1924-1929 and a number of down cycles converging on this time period at the same time.  Regardless, the overall cycle lasted 17.5 years.

  • 17 Year BEAR Market (1932 bottom to 1949 bottom): The cycle originated at the bottom in July of 1932 and lasted until June of 1949. During this period of time we had a post great depression bounce, 1937 crash and World War 2. Yet, despite the overall upward trajectory, this clearly defined 1949 bottom remained 60% below its 1929 top and well below both its 1937 and 1942 tops.
  • 17 Year BULL Market (1949 bottom to 1966 top): The market surged higher between 1949 bottom and 1966 top. This was the so called “Golden Age” of post war reconstruction and the American industrial boom. During this time the Dow appreciated over 500% in a clearly defined bull market cycle.
  • 16.5 Year BEAR Market (1966 top to 1982 bottom): The market stayed relatively flat during this period of time with a few notable declines of 30-50%. With the 1972-1974 mid cycle decline of 54% being the largest one.  This clearly defined bear market completed in August of 1982. Approximately 25% below its 1966 top.
  • 17.5 Year BULL Market (1982 bottom to 2000 top): A very well known period and a clearly defined bull market. The market surged higher from its August of 1982 bottom to reach its historic top in January of 2000. During this time the Dow appreciated over 1,400% in one of the strongest bull markets in history.
  • 17 Year BEAR Market (2000 top to 2017 bottom): Even though the market is sitting near all time highs (as of this writing in January of 2014) and even though most people have assumed that the new bull market has started, in relative terms the market hasn’t appreciated very much since its top in 2000. The Nasdaq is still down. Plus, with the final down leg of this bear market being ahead of us (based on my mathematical and timing work), the BEAR market of 2000-2017 should complete itself in a negative territory or below its 2000 top.

It is important to note that the small variation (of +/- 1 year) in duration of these cycles is caused by smaller or larger cycles arriving at the same time. As such and based on the cycles above, we are no longer working in an arbitrary fashion when it comes to predicting the stock market.  In other words, if the stock market repeats a clearly defined 17-18 year Bull/Bear cycle over a 220 year period of time (since 1790) and does so without interruption,  it is safe to assume that the future is predictable and not random.

THE 5 YEAR CYCLE IN THE STOCK MARKET

One other easily identifiable cycle within the stock market is the 5 year cycle. These 5 year cycles represent one completed growth pattern or one completed Bull or Bear cycle. Typically, they tend to appear for 5 years, disappear and then reappear at a certain point in the future. While they are not sequential as the 17-18 year cycle above, once their place within the overall stock market is understood, they show up at exactly the right time.  For instance,

  • 1914 -1920: Bull Market
  • 1924-1929: Bull Market (followed by a 1929 crash)
  • 1932-1937: Bull Market (followed by a 1937 crash)
  • 1937-1942: Bear Market
  • 1966-1971: Bear Market
  • 1982-1987: Bull Market (followed by a 1987 crash)
  • 1994-2000: Bull Market (followed by a 2000 crash)
  • 2002-2007: Bull Market (followed by a 2007 crash)
  • 2009-2014: Bull Market

One thing to understand about these 5 Year cycles is that they are exact. They have much lower level variance as compared to their longer counterparts. Essentially, we are NOT talking about 5 years +/- 6 months. We are talking about 5 years +/- a few days. For instance, the 2002-2007cycle started on October 10th, 2002 (at 2002 bottom) and terminated on October 11th, 2007. If you are counting, that is exactly 5 Years and 1 day or scary accurate. I encourage you to study the other cycles outlined above in order to prove to yourself how shockingly accurate they all are.

 CONCLUSION: 

In summary, predicting a bear market of 2015-2017 is rather simple.  All 17-18 year bear cycles end with a 2-3 year bear market. For instance, 1912-1914, 1946-1949 and 1979-1982. And while most believe that the secular bear market ended at 2009 bottom, it is not the case. The secular bear market of 2000-2017 is still in effect and will terminate only when the year 2017 is reached. Although the final price bottom will be higher than the mid-cycle bottom reached in March of 2009.

Further, the 5-Year cycle that started on March 6th, 2009 bottom terminated on July 16th, 2014. Suggesting that the stock market is now ready to initiate its bear leg (despite recent higher highs). When I combine this cyclical analysis with the rest of my mathematical and timing work, the outcome is crystal clear. A severe bear market of 2015-2017 is just around the corner.

This conclusion is further supported by my mathematical and timing work. It clearly shows a severe bear market between 2014/15-2017. In fact, when it starts it will very quickly retrace most of the gains accrued over the last few years.  If you would be interested in learning when the bear market of 2014/15-2017 will start (to the day) and its internal composition, please CLICK HERE.

(***Please NoteA bear market might have started already, I am simply not disclosing this information. Due to my obligations to my Subscribers I am unable to provide you with more exact forecasts. In fact, I am being “Wishy Washy” at best with my FREE daily updates here. If you would be interested in exact forecasts, dates, times and precise daily coverage, please Click Here). Daily Stock Market Update. April 4th, 2015  InvestWithAlex.com

Did you enjoy this article? If so, please share our blog with your friends as we try to get traction. Gratitude!!!

Scary: Long-Term Cycles Show The Stock Market Will….. Google

Is The S&P About To Breakdown?

Daily Chart April 1 2015

4/1/2015 – Another down day with the Dow Jones down 78 points (-0.44%) and the Nasdaq down 20 points (-0.40%).

A very solid technical look of where we are in the technical composition of the market. Definitely worth 2 minutes of your time.

I am seeing the same thing as Carter. The markets are getting weaker by the day. Markets internals continue to deteriorate, distribution period has been in place over the last 6-9 months, interest rates are about to rise, stocks are overvalued and so on and so forth. You get the picture.

In terms of the catalyst. I don’t think you will have to look further than Q-1 earnings season. Again, due to the recent surge in the US Dollar and slowing economy, I would expect quite a few big guys to miss and guide lower. And I am not even talking about small and mid caps. That could be devastating, considering today’s expensive P/E multiples and high expectations.

This conclusion is further supported by my mathematical and timing work. It clearly shows a severe bear market between 2015-2017. In fact, when it starts it will very quickly retrace most of the gains accrued over the last few years.  If you would be interested in learning when the bear market of 2015-2017 will start (to the day) and its internal composition, please CLICK HERE.

(***Please Note: A bear market might have started already, I am simply not disclosing this information. Due to my obligations to my Subscribers I am unable to provide you with more exact forecasts. In fact, I am being “Wishy Washy” at best with my FREE daily updates here. If you would be interested in exact forecasts, dates, times and precise daily coverage, please Click Here). Daily Stock Market Update. April 1st, 2015  InvestWithAlex.com

Did you enjoy this article? If so, please share our blog with your friends as we try to get traction. Gratitude!!!

Is The S&P About To Breakdown?  Google

Will Earnings Surprise To The Downside?

Daily Chart AMarch 31st

3/31/2015 – A down day with the Dow Jones down 198 points (-1.10%) and the Nasdaq down 46 points (-0.44%). 

It appears that way as we have discussed the likelihood of that happening over the last few weeks. Strong dollar, collapsing GDP growth, decelerating economy and corporate growth, no QE and anticipated interest rate hikes. Given today’s hefty valuation levels, is this a perfect bearish setup or a bear trap if the earnings are not as bad? Watch the video below and decide for yourself.

This conclusion is further supported by my mathematical and timing work. It clearly shows a severe bear market between 2015-2017. In fact, when it starts it will very quickly retrace most of the gains accrued over the last few years.  If you would be interested in learning when the bear market of 2015-2017 will start (to the day) and its internal composition, please CLICK HERE.

(***Please NoteA bear market might have started already, I am simply not disclosing this information. Due to my obligations to my Subscribers I am unable to provide you with more exact forecasts. In fact, I am being “Wishy Washy” at best with my FREE daily updates here. If you would be interested in exact forecasts, dates, times and precise daily coverage, please Click Here). Daily Stock Market Update. March 31st, 2015  InvestWithAlex.com

Did you enjoy this article? If so, please share our blog with your friends as we try to get traction. Gratitude!!!

Will Earnings Surprise To The Downside?  Google

Is The US Economy Accelerating Down?

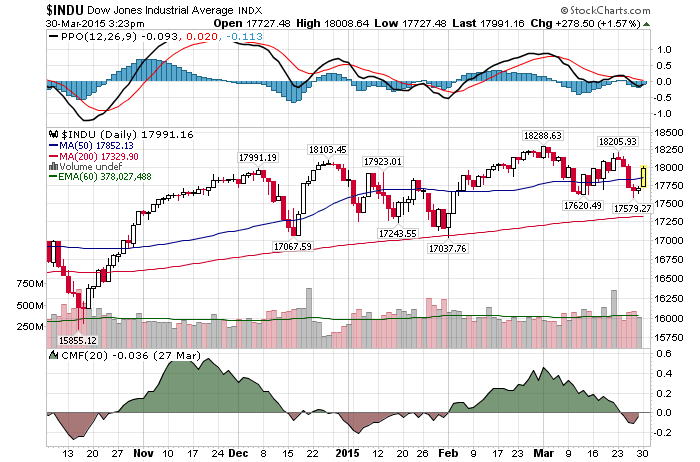
Daily Chart AMarch 30h

3/30/2015 – A big up day with the Dow Jones 263 points (+1.49%) and the Nasdaq up 56 points (+1.15%). 

If you have followed my blog for over a year, you very well know that my economic forecast has been dead on. Thus far. Over a year ago I have clearly outlined that the US Economy will start rolling over in Q3-4 of 2014, accelerating its downfall thereafter.

Now, Business Insider is seeing the same thing Something weird is going on in the US economy, and it’s not good  This brings out 3 incredibly important questions.

  1. Why is the US Economy rolling over?  – To put it bluntly, because the US Economy today is one massive Ponzi scheme.  And yes, you can blame the FED for this one. The improvements we have seen over the last few years have very little to do with real economic growth and have everything to do with massive amounts of liquidity pumped into the system. In the form of QE and zero interest rates. Liquidity that went straight into stock buybacks and propping up speculative asset prices. We all know how that ends.
  2. Many experts expect a Q2-4 GDP bounce, will we get one? NO. As was suggested above, there is nothing to drive this economy forward. Now that the QE is gone and the FED is considering raising interest rates, where will surge come from? It WON’T.  Unless the FED re-introduces QE, we won’t see any further improvements. On the contrary, expect most economic drivers to decelerate even further in 2015.
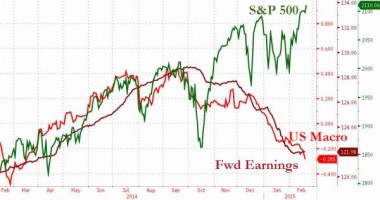
  3. How will this impact the stock market? – As is evident from the chart below, the stock market has disconnected from any sort of fundamental reality in early 2014. Now, there are only two possible outcomes. Either earnings and economic data surges higher or the stock market breaks down. Based on the analysis above, the latter is a much more likely outcome.

Macrodata

This conclusion is further supported by my mathematical and timing work. It clearly shows a severe bear market between 2015-2017. In fact, when it starts it will very quickly retrace most of the gains accrued over the last few years.  If you would be interested in learning when the bear market of 2015-2017 will start (to the day) and its internal composition, please CLICK HERE.

(***Please NoteA bear market might have started already, I am simply not disclosing this information. Due to my obligations to my Subscribers I am unable to provide you with more exact forecasts. In fact, I am being “Wishy Washy” at best with my FREE daily updates here. If you would be interested in exact forecasts, dates, times and precise daily coverage, please Click Here). Daily Stock Market Update. March 30th, 2015  InvestWithAlex.com

Did you enjoy this article? If so, please share our blog with your friends as we try to get traction. Gratitude!!!

Is The US Economy Accelerating Down? Google

Hey Bulls, Step Up Or Else

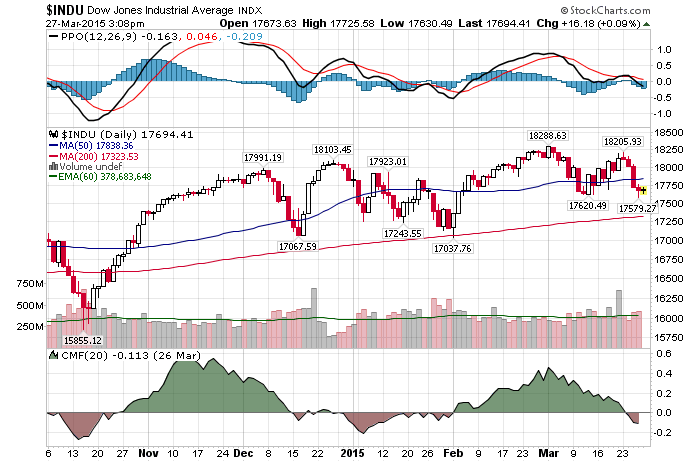
Daily Chart AMarch 27th

3/27/2015 – An up day with the Dow Jones up 32 points (+0.18%) and the Nasdaq up 28 points (+0.27%)

It appears everyone left for the Hamptons a day early this week. A lot of interesting stuff going into the weekend. Let’s take a look.

There has been a lot discussion lately about weather or not the stock market is overvalued. And while the bears claim that it is, as I do, the bull tend to pretend we are still in the early stages of a secular bull market. The analysis above and the charts associated with it are dead on. Again, today’s stock market is just as overvalued as it was at 2007 and 2000 tops. I have no doubt about that. Take a look and decide for yourself.

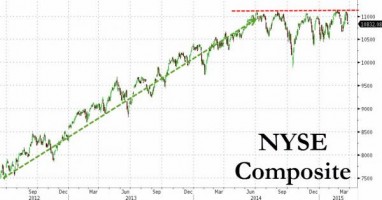
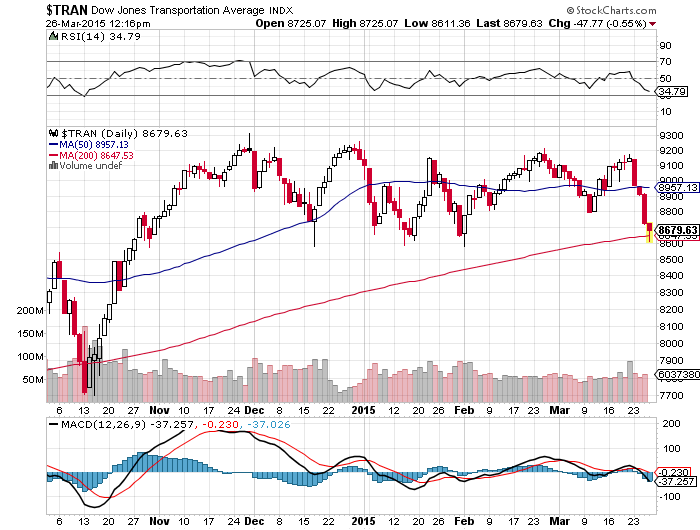
Well, that is not necessarily true. Consider the following. Just yesterday I have suggested that the Dow Theory might have confirmed trend reversal. You can see it here. Did The Dow Theory Just Confirm Trend Reversal?  Then, take a look at the chart below. I have argued over the last few months that the stock market has been in a distribution, getting ready to roll over, since June 17th, 2014. If you want a more detailed analysis, please Click Here.

NYSE Chart

Finally, as the article above suggests, stock market bulls need to step up their buying or the market might finally break down. There is only one problem with their proposition. I truly believe that being a bull today is equivalent to blowing your brains out. Considering today’s overvaluation levels, speculation, slowing earnings, strong dollar, massive divergence between economic data and the stock market, buying stocks today is as close to a financial suicide as anyone can get.

But don’t tell that to 99% of market participants out there. 

This conclusion is further supported by my mathematical and timing work. It clearly shows a severe bear market between 2015-2017. In fact, when it starts it will very quickly retrace most of the gains accrued over the last few years.  If you would be interested in learning when the bear market of 2015-2017 will start (to the day) and its internal composition, please CLICK HERE.

(***Please Note: A bear market might have started already, I am simply not disclosing this information. Due to my obligations to my Subscribers I am unable to provide you with more exact forecasts. In fact, I am being “Wishy Washy” at best with my FREE daily updates here. If you would be interested in exact forecasts, dates, times and precise daily coverage, please Click Here). Daily Stock Market Update. March 27th, 2015  InvestWithAlex.com

Did you enjoy this article? If so, please share our blog with your friends as we try to get traction. Gratitude!!!

Hey Bulls, Step Up Or Else Google

The Secret Behind This Market Sell-Off

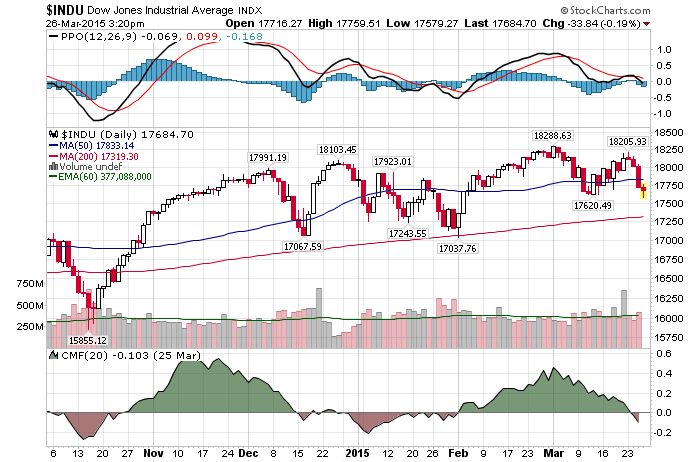
Daily Chart AMarch 26rd

3/26/2015 – Another down day with the Dow Jones down 40 points (-0.23%) and the Nasdaq down 13 points (-0.27%). 

Despite the recent sell-off, the stock market remains near all time highs. A stone throws away, so to speak.  Yet, according to David Rosenberg, the stock market will have to deal with the following 4 issues going forward.

1. Earnings momentum has slowed. Bottom-up consensus forecasts for S&P 500 operating earnings growth in the first quarter have fallen to -3.1% from +5.3% year-over-year. “The second quarter has been sliced to -0.7% YoY as well, so technically speaking we could be looking at a mild profits recession here in the US – this is down from the +5.9% estimate at the start of the year,” he wrote.

Yes, and as I have suggested before, I believe quite a few companies will guide lower in Q1. We already saw that with Intel a few weeks ago. You can find a more comprehensive analysis here Intel (INTC) Guides Down. Are Others About To Follow?  Intel was just the first. 

2. Valuations are high. The trailing P/E ratio is 20x, compared to the long-run norm of 16x. “It actually is not all that uncommon to see the equity market up in years when EPS growth is flat-ish (as the consensus now believes for 2015) but that requires price-to-earnings multiple expansion.

I have beaten this topic to death here over the last few months. If you take historical metrics into consideration, we are in an overvaluation bubble. Particularly, when you realize that most of the corporate earnings over the last few years have been driven by speculation, stock buybacks and a giant EQ/Debt/Liquidity bubble. At some point the P/E ratio will swing back to the other extreme and you won’t want to be around when that happens. I gather that this time is fast approaching.

3. Economic data has been disappointing. The Citigroup Economic Surprise Index is at the lowest level since August 2011, and in that month, the S&P 500 dipped in a way that led some to think the economic cycle was turning.

I don’t think the chart below needs any further comments. 

Macrodata

The strong dollar is hurting profits. “There is such a thing as too much of a good thing,” Rosenberg wrote, and the dollar bull market is not over. He advised investors to avoid sectors that have EPS forecasts below zero, including Utilities (-6.6%) and Telecom (-0.8%.)

I tend to agree. Technicals suggest, at least for the time being, that the dollar rally will continue. I can only imagine how much this hurts multinationals when they report earnings in Q1-Q2. Despite hedging, very few anticipated the velocity of the dollar move over the last 4 months. I believe we will see the evidence of that soon.

In summary: The stock market is incredibly overpriced, by any measure. The economy is rolling over. Earnings multiples are high while the corporates are guiding down. Everyone is bullish and the strong dollar will have an adverse impact on earnings. Yet, I am supposed to believe that this bull market is just getting started, as most market pundits suggest? Again, you don’t have to be a genius to figure out what happens next.

This conclusion is further supported by my mathematical and timing work. It clearly shows a severe bear market between 2015-2017. In fact, when it starts it will very quickly retrace most of the gains accrued over the last few years.  If you would be interested in learning when the bear market of 2015-2017 will start (to the day) and its internal composition, please CLICK HERE.

(***Please Note: A bear market might have started already, I am simply not disclosing this information. Due to my obligations to my Subscribers I am unable to provide you with more exact forecasts. In fact, I am being “Wishy Washy” at best with my FREE daily updates here. If you would be interested in exact forecasts, dates, times and precise daily coverage, please Click Here). Daily Stock Market Update. March 26th, 2015  InvestWithAlex.com

Did you enjoy this article? If so, please share our blog with your friends as we try to get traction. Gratitude!!!

The Secret Behind This Market Sell-Off  Google

How Low Can A Bear Market Here Go?

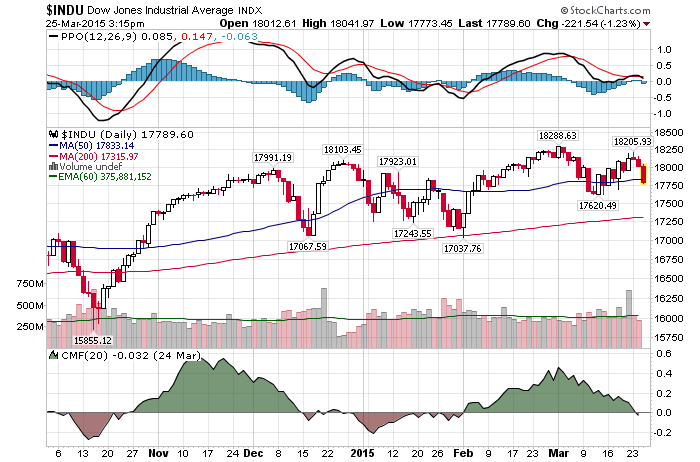
Daily Chart AMarch 25rd

2/25/2015 – A big down day with the Dow Jones down 290 points (1.62%) and the Nasdaq down 118 points (-2.37%). 

Jim Stack was fortunate enough to pick the 2009 bottom. Now, the president of InvesTech Research, which is on the Hulbert Financial Digest’s Honor Roll of top newsletters over the past 15 years, and Stack Financial Management, which manages more than $1 billion of investors’ money, believes we are on the verge of a bear market.

Here is what concerns him.

  • Rising interest rates,” he explained, “can provide significant headwinds to a bull market,” which he calls “one of the more interest-rate-sensitive bull markets in our lifetime.”
  • Margin debt has peaked and begun to fall. “Past peaks in margin debt have led or coincided with the start of past bear markets,” he wrote in InvesTech Research.
  • Professional investors are extremely bullish, with bearish sentiment under 14%, “the fewest bears since 1987, just before the crash,” he told me.
  • Corporate profits topped out more than a year ago, but S&P 500 earnings per share continued to rise until recently. That discrepancy is often an early-warning sign.
  • Although the S&P 500’s current multiple of 19.9 times earnings is slightly below the average when interest rates are below 3%, that will make stocks especially vulnerable when rates do rise. And the median U.S. company trades at its highest valuation of the past 65 years, according to the noted finance scholar Kenneth French of Dartmouth College.

Nothing that I haven’t covered here before, but it nice to hear the same thing from somebody else.  The question is, if a bear market does start, how low will it go? Jim suggests the following

A more likely outcome, he said, was for the S&P 500 to retrace about half of its bull market gains. If March 2 was the peak, that would mean it could fall to around 1,400, roughly a 35% decline.

I would say that is a fairly good estimate. And as I have suggested before and despite the fact that I am bearish, I don’t anticipate the markets to collapse as they did in 2007-2009. That was a mid-cycle panic. The upcoming decline will be more reminiscent of 2000-2002 decline on the Dow. Still, it wouldn’t make sense to be long here.

This conclusion is further supported by my mathematical and timing work. It clearly shows a severe bear market between 2015-2017. In fact, when it starts it will very quickly retrace most of the gains accrued over the last few years.  If you would be interested in learning when the bear market of 2015-2017 will start (to the day) and its internal composition, please CLICK HERE.

(***Please NoteA bear market might have started already, I am simply not disclosing this information. Due to my obligations to my Subscribers I am unable to provide you with more exact forecasts. In fact, I am being “Wishy Washy” at best with my FREE daily updates here. If you would be interested in exact forecasts, dates, times and precise daily coverage, please Click Here). Daily Stock Market Update. March 25th, 2015  InvestWithAlex.com

Did you enjoy this article? If so, please share our blog with your friends as we try to get traction. Gratitude!!!

How Low Can A Bear Market Here Go? Google