This Party Is Just Getting Started. Stock Market Valuations Can Go Infinite

Daily Chart AMarch 23rd

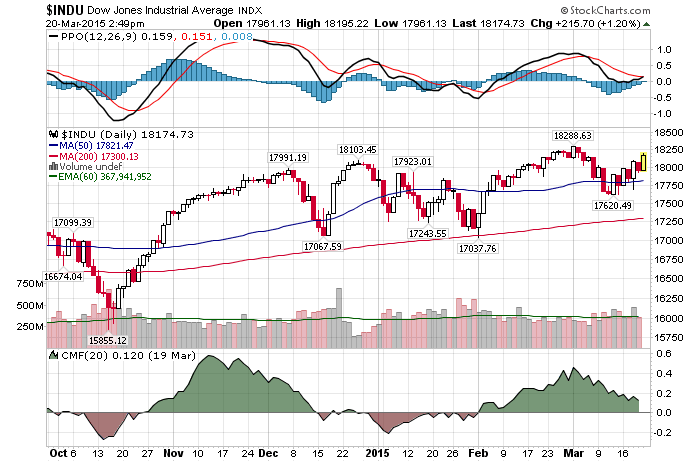
3/23/2015 – A down day with the Dow Jones down 11 points (-0.06%) and the Nasdaq down 15 points (-0.31%) 

According to quite a few market pundits, the party in the equity markets hasn’t even started yet. Case and point

I cannot stop shaking my head in disbelief. To save you some time, here is what was said:

“This is an extraordinary buying opportunity, buy any and all dips, with zero interest rates the price of equities could be infinite, this bull market will continue, valuation don’t matter anymore, etc….”

Valuations don’t matter……infinite run ups are just around the corner …..buy now. That sounds familiar. If I didn’t hear the exact same thing at 2007 and 2000 tops, well, call me a fool.

Again, the underlying assumption in both cases is the same. We are in such a unique monetary easing environment that there is no way in hell the markets can go down. Maybe so, but here is the major point that most investors miss. Today’s market environment becomes a matter of psychological setup as opposed to a fundamental background.

When everyone and their day trading grandmother believe that we are in such a bullish environment, the market is getting ready to reverse. Why? Well, it’s rather simple, everyone has already bought into the long side of the market. Contrary to the opinion of the market pundits above, I would argue that the only opportunity here is on the short side (or in cash).

This conclusion is further supported by my mathematical and timing work. It clearly shows a severe bear market between 2015-2017. In fact, when it starts it will very quickly retrace most of the gains accrued over the last few years.  If you would be interested in learning when the bear market of 2015-2017 will start (to the day) and its internal composition, please CLICK HERE.

(***Please Note: A bear market might have started already, I am simply not disclosing this information. Due to my obligations to my Subscribers I am unable to provide you with more exact forecasts. In fact, I am being “Wishy Washy” at best with my FREE daily updates here. If you would be interested in exact forecasts, dates, times and precise daily coverage, please Click Here). Daily Stock Market Update. March 23rd, 2015  InvestWithAlex.com

Did you enjoy this article? If so, please share our blog with your friends as we try to get traction. Gratitude!!!

This Party Is Just Getting Started. Stock Market Valuations Can Go Infinite  Google

Did Biotech (IBB) Top Out TODAY?

Daily Chart AMarch 20th

3/20/2015 – An up day with the Dow Jones up 162 points (+0.94%) and the Nasdaq up 34 points (+0.68%)

Before we get to Biotech, there has been a lot of talk recently about how most markets are heavily manipulated. From gold to equities, from bonds to cocaine (not that I would know). For instance, Yardeni: Markets all rigged, it is what it is  I don’t see it. My mathematical work continues to show that the Dow continues to trace out its exact mathematical points of force. If you would like to find out what happens next, please Click Here.   

Now, to Biotech. 

The Nasdaq hit an Intraday high of 5,132 on March 10th, 2000, then promptly turned around and proceeded to collapse 80%. Is it possible that the Biotech Index (IBB) did the same thing exactly 15 years later?

Not only is it possible, it is highly probable. Back in 2000 it was Pets.com and Nortel Networks. Today, it is hundreds of impressive sounding “Genome” Biotech names that have

  • A few Ph.D’s on their payroll.
  • An impressive idea.
  • A white paper on how their new generation drug will change the world and make Trillions….a  paper that maybe 10 people on this Earth can fully understand.
  • No way in hell of making a cent or getting their drug to the market.
  • A whole bunch of stupid investors that believe they will get rich.

Make no mistake, Biotech is an a giant bubble that will pop. And it’s not only Biotech. We are witnessing the same thing in the Silicon Valley’s “Mark Cuban” illiquidity bubble and even on the Nasdaq. Alibaba deal values Snapchat at $15 billion Do I really need to say anything when an app with no revenue is valued at $15 Billion by a company that is in its own spectacular overvaluation bubble? I hope note.

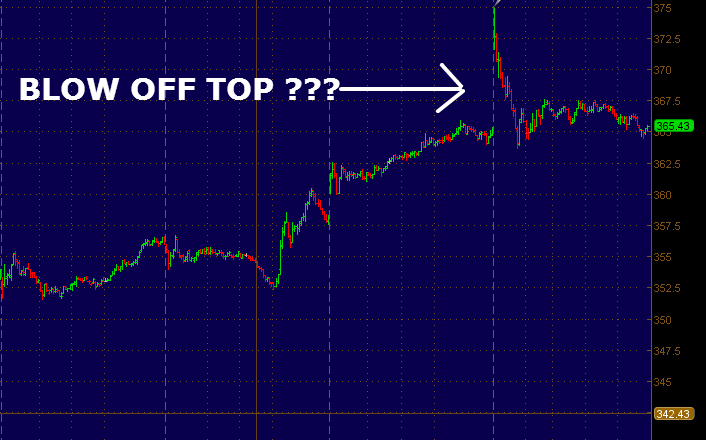
Anyway, why do I believe we might have hit the top in Biotech (IBB) today? Today’s blow off (gap) open and some of my other work within the sector.  That is to say, don’t be surprised if we get a massive sell-off in Biotech over the next few months.

IBB2

This conclusion is further supported by my mathematical and timing work. It clearly shows a severe bear market between 2015-2017. In fact, when it starts it will very quickly retrace most of the gains accrued over the last few years.  If you would be interested in learning when the bear market of 2015-2017 will start (to the day) and its internal composition, please CLICK HERE.

(***Please NoteA bear market might have started already, I am simply not disclosing this information. Due to my obligations to my Subscribers I am unable to provide you with more exact forecasts. In fact, I am being “Wishy Washy” at best with my FREE daily updates here. If you would be interested in exact forecasts, dates, times and precise daily coverage, please Click Here). Daily Stock Market Update. March 20th, 2015  InvestWithAlex.com

Did you enjoy this article? If so, please share our blog with your friends as we try to get traction. Gratitude!!!

Did Biotech (IBB) Top Out TODAY? Google

What You Ought To Know About Today’s Stock Buybacks

Daily Chart AMarch 19th

3/19/2015 –  A mixed day with the Dow Jones down 117 points (-0.65%) and the Nasdaq up 9 points (0.19%)

We have talked about stock buybacks and their eventual negative impact on this forum before. The Atlantic has a fairly good expose on the subject matter from a different angle Stock Buybacks Are Killing the American Economy

The article asks a simple question. Despite corporate profits being at the highest levels on record, at 12% of GDP, the underlying economic picture continues to deteriorate. Where did the money go?

The answer is as simple as it is surprising: Much of it went to stock buybacks—more than $6.9 trillion of them since 2004, according to data compiled by Mustafa Erdem Sakinç of The Academic-Industry Research Network. Over the past decade, the companies that make up the S&P 500 have spent an astounding 54 percent of profits on stock buybacks. Last year alone, U.S. corporations spent about $700 billion, or roughly 4 percent of GDP, to prop up their share prices by repurchasing their own stock.

Here is the scariest part. Not only was this money more or less wasted, this money was also borrowed away from future growth…..in the form of QE and zero interest rates. And the result? Overpriced and highly speculative stock market that is set to fall as soon as this “buyback” stimulus is withdrawn.

Finally, keep in mind that most corporations behave as individual investors would. They always buyback at the top while hoarding cash at the bottom. As was evident during the 2006-2010 period. That is not a good omen for the future.

This conclusion is further supported by my mathematical and timing work. It clearly shows a severe bear market between 2015-2017. In fact, when it starts it will very quickly retrace most of the gains accrued over the last few years.  If you would be interested in learning when the bear market of 2015-2017 will start (to the day) and its internal composition, please CLICK HERE.

(***Please NoteA bear market might have started already, I am simply not disclosing this information. Due to my obligations to my Subscribers I am unable to provide you with more exact forecasts. In fact, I am being “Wishy Washy” at best with my FREE daily updates here. If you would be interested in exact forecasts, dates, times and precise daily coverage, please Click Here). Daily Stock Market Update. March 19th, 2015  InvestWithAlex.com

Did you enjoy this article? If so, please share our blog with your friends as we try to get traction. Gratitude!!!

What You Ought To Know About Today’s Stock Buybacks  Google

Is It Time To Short Janet Yellen & The FED?

Daily Chart AMarch 18th

3/18/2015 – An up day with the Dow Jones up 227 points (+1.27%) and the Nasdaq up 45 points (+0.92%)

If you recall, in the last two weeks of February the market barely moved. And towards the end of February I suggested that this period of low volatility is coming to an end. Boy, did it ever. After the market topped out on March 2nd, the Dow has delivered close to 2,500 points in short-term market swings. That’s pretty impressive!!!

What happens next?

Today’s market rally was obviously FED induced. What did they say? Blah, blah, blah…….blah, blah. Literally. The FED wanted flexibility, to raise or not to raise, and that is precisely what their statement entails. Nothing more or less. In the final analysis, the talking heads can now spend another month dissecting every word in their never ending quest to find meaning.

In terms of the stock market, the bulls are large and in charge. Or so it appears. The stock market played out exactly as one of our scenarios suggested (subscriber section). And while the bulls feel vindicated, I wouldn’t get too excited just yet. The volatility we have experienced over the last few weeks is here to stay and the bulls might very quickly find themselves on the other side of the FED’s stupidity.

This conclusion is further supported by my mathematical and timing work. It clearly shows a severe bear market between 2015-2017. In fact, when it starts it will very quickly retrace most of the gains accrued over the last few years.  If you would be interested in learning when the bear market of 2015-2017 will start (to the day) and its internal composition, please CLICK HERE.

(***Please Note: A bear market might have started already, I am simply not disclosing this information. Due to my obligations to my Subscribers I am unable to provide you with more exact forecasts. In fact, I am being “Wishy Washy” at best with my FREE daily updates here. If you would be interested in exact forecasts, dates, times and precise daily coverage, please Click Here). Daily Stock Market Update. March 17th, 2015  InvestWithAlex.com

Did you enjoy this article? If so, please share our blog with your friends as we try to get traction. Gratitude!!!

Is It Time To Short Janet Yellen & The FED? Google

How Low Will An Upcoming Bear Market Go?

Daily Chart AMarch 16th

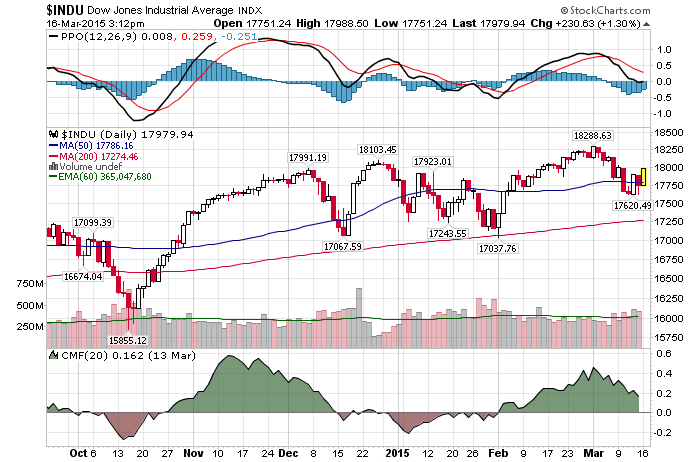
3/16/2015 – A strong up day with the Dow Jones up  228 points (+1.29%) and the Nasdaq up 58 points (+1.19%). 

Jim Stack was fortunate enough to pick the 2009 bottom. Now, the president of InvesTech Research, which is on the Hulbert Financial Digest’s Honor Roll of top newsletters over the past 15 years, and Stack Financial Management, which manages more than $1 billion of investors’ money, believes we are on the verge of a bear market.

Here is what concerns him.

  • Rising interest rates,” he explained, “can provide significant headwinds to a bull market,” which he calls “one of the more interest-rate-sensitive bull markets in our lifetime.”
  • Margin debt has peaked and begun to fall. “Past peaks in margin debt have led or coincided with the start of past bear markets,” he wrote in InvesTech Research.
  • Professional investors are extremely bullish, with bearish sentiment under 14%, “the fewest bears since 1987, just before the crash,” he told me.
  • Corporate profits topped out more than a year ago, but S&P 500 earnings per share continued to rise until recently. That discrepancy is often an early-warning sign.
  • Although the S&P 500’s current multiple of 19.9 times earnings is slightly below the average when interest rates are below 3%, that will make stocks especially vulnerable when rates do rise. And the median U.S. company trades at its highest valuation of the past 65 years, according to the noted finance scholar Kenneth French of Dartmouth College.

Nothing that I haven’t covered here before, but it nice to hear the same thing from somebody else.  The question is, if a bear market does start, how low will it go? Jim suggests the following

A more likely outcome, he said, was for the S&P 500 to retrace about half of its bull market gains. If March 2 was the peak, that would mean it could fall to around 1,400, roughly a 35% decline.

I would say that is a fairly good estimate. And as I have suggested before and despite the fact that I am bearish, I don’t anticipate the markets to collapse as they did in 2007-2009. That was a mid-cycle panic. The upcoming decline will be more reminiscent of 2000-2002 decline on the Dow. Still, it wouldn’t make sense to be long here.

This conclusion is further supported by my mathematical and timing work. It clearly shows a severe bear market between 2015-2017. In fact, when it starts it will very quickly retrace most of the gains accrued over the last few years.  If you would be interested in learning when the bear market of 2015-2017 will start (to the day) and its internal composition, please CLICK HERE.

(***Please NoteA bear market might have started already, I am simply not disclosing this information. Due to my obligations to my Subscribers I am unable to provide you with more exact forecasts. In fact, I am being “Wishy Washy” at best with my FREE daily updates here. If you would be interested in exact forecasts, dates, times and precise daily coverage, please Click Here). Daily Stock Market Update. March 16th, 2015  InvestWithAlex.com

Did you enjoy this article? If so, please share our blog with your friends as we try to get traction. Gratitude!!!

How Low Will An Upcoming Bear Market Go? Google

How I Predicted The March 2nd Top. Dead On.

Daily Chart AMarch 13th

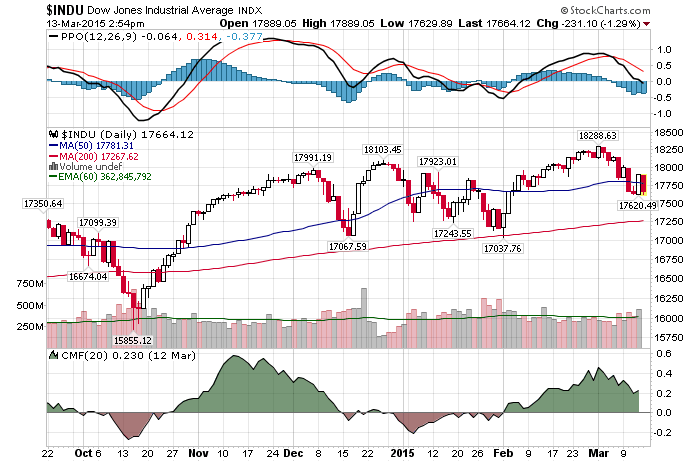
3/13/2015 – A big down day with the Dow Jones down 146 points (-0.81%) points and the Nasdaq down 21 points (-0.44%). 

Going into the end of February my subscribers knew that we were facing a major turning point at the Dow 18,320 (+/- 50 points) and that it would occur on February 27th (+/- 1 trading day). If you are wondering, yes, +/- 1 trading day included March 2nd.

My advice was also rather simple, to go short right at the top. The actual top arrived on March 2nd at the Dow 18,285. In the final analysis I have missed it by 15-35 Dow points or 0.08%. Close enough. Since then, the Dow is down -3.7% Are we about to bounce or is this sell-off just getting started? Click Here to find out.

So, how was I able to predict the exact top well in advance?

I use two primary analytic tools and none of them have anything to do with technical analysis, fundamental analysis, quant, Elliot Wave, the Dow theory or the such. My unique mathematical and timing work took me over 10 years of trial and error to develop and I am not even done. Further, it goes well beyond all of the tools mention above. Let me give you an example and its application to March 2nd.

1. Cyclical Composition Of The Stock Market.

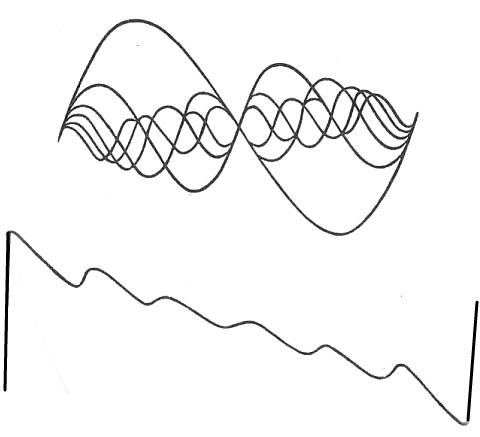
There are at least 50 cycles moving within the stock market at any one time. From long-term cycles spanning 100 years or more to cycles oscillating with 4 minute Intraday periodicity.  What we see on a 2-Dimensional Price/Time chart is a shadow of what is really going on behind the scenes.

composite_wave

What we see on the stock chart is the summation of all cycles into a singular composite. As per example above. What complicates the analysis is the fact that these cycles are not continuous. They shift and jump according to their own DNA sequence type of a mechanism. Meaning, it is a dynamic system that needs constant adjustment. However, once you know how these cycles behave and their order, you should be able to predict the stock market with astonishing accuracy.

Now, a number of incredibly important TIME cycles were arriving on February 27th (+/- 1 trading day). That meant the market was likely to top out at that TIME. The next question was….. WHERE?

2. Mathematical Stock Market Composition. 

That is where my mathematical work comes in. As I have suggested previously, the stock market has a mathematical structure that it traces out behind the scenes. It is hidden , unless you know exactly what to look for. Again, the market traces out this structure in 3-Dimensional space. Once you know how to measure it, you should be able predict exactly where the next turning point is. I describe the whole process in great detail in my Timed Value book.

For instance, this same work indicated that a powerful point of force was located at the Dow 18,320 (+/- 50 points). In my subsequent communications to my subscribers I have indicated that the exact hit would be at 18,310 and that I would go 100% short at 18,300. The Dow topped out at 18,285 (15 points away) on March 2nd and I went short soon after. It was as simple as that.

Now, the more important question is, are we about to bounce or will this sell-off accelerate down. Click Here to find out.  If would you like to learn more about the process I use, you can start with two free chapters from my book Timed Value 

Long-term, my work shows a severe bear market between 2015-2017. In fact, when it starts it will very quickly retrace most of the gains accrued over the last few years.  If you would be interested in learning when the bear market of 2015-2017 will start (to the day) and its internal composition, please CLICK HERE.

(***Please NoteA bear market might have started already, I am simply not disclosing this information. Due to my obligations to my Subscribers I am unable to provide you with more exact forecasts. In fact, I am being “Wishy Washy” at best with my FREE daily updates here. If you would be interested in exact forecasts, dates, times and precise daily coverage, please Click Here). Daily Stock Market Update. March 13th, 2015  InvestWithAlex.com

Did you enjoy this article? If so, please share our blog with your friends as we try to get traction. Gratitude!!!

How I Predicted The March 2nd Top. Dead On. Google

Intel (INTC) Guides Down. Are Others About To Follow?

Daily Chart AMarch 12th

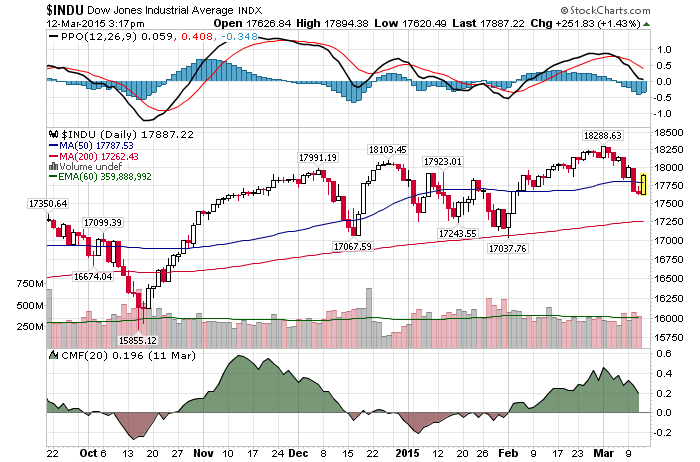
3/12/2015 – An up day with the Dow Jones up 259 points (1.47%) and the Nasdaq up 43 points (0.89%)

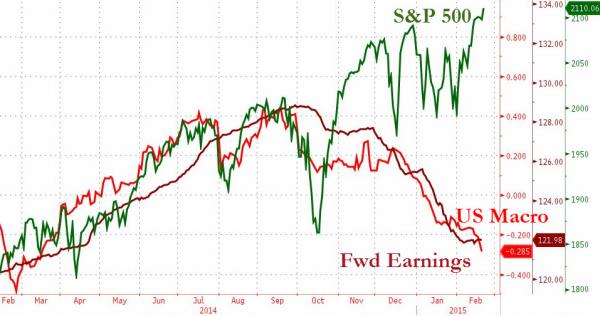
It has been my premise that the stock market has disconnected from any sort of economic reality a while ago. And while numerous Macro Economic indicators are literally collapsing, as covered here previously, the stock market is sitting near all time highs.

Earlier today Intel (INTC) slashed its Q1 revenue forecast by 7%. The bad old days may be back for Intel and other PC stalwarts Blaming it mostly on weaker demand and stronger dollar.

The change in revenue outlook is a result of weaker than expected demand for business desktop PCs and lower than expected inventory levels across the PC supply chain.The company believes the changes to demand and inventory patterns are caused by lower than expected Windows XP refresh in small and medium business and increasingly challenging macroeconomic and currency conditions, particularly in Europe.

Most financial pundits were quick to dismiss this lower guidance as a “one time event” limited to tech stalwarts. I, however, think there is a much bigger story there. I believe Intel is just the first large company to guide lower. Many more will follow.

Again, in addition to Macro data collapsing, the GDP expectations are also being adjusted down. By 20-50%, depending on the source. That is to say, it is just a matter of time before others start guiding lower as well. If not now, Q2 should do the trick. Once that realization sets in, it won’t be long before the stock market starts playing catch up with the fundamental data below.

Macrodata

This conclusion is further supported by my mathematical and timing work. It clearly shows a severe bear market between 2015-2017. In fact, when it starts it will very quickly retrace most of the gains accrued over the last few years.  If you would be interested in learning when the bear market of 2015-2017 will start (to the day) and its internal composition, please CLICK HERE.

(***Please Note: A bear market might have started already, I am simply not disclosing this information. Due to my obligations to my Subscribers I am unable to provide you with more exact forecasts. In fact, I am being “Wishy Washy” at best with my FREE daily updates here. If you would be interested in exact forecasts, dates, times and precise daily coverage, please Click Here). Daily Stock Market Update. March 12th, 2015  InvestWithAlex.com

Did you enjoy this article? If so, please share our blog with your friends as we try to get traction. Gratitude!!!

Intel (INTC) Guides Down. Are Others About To Follow? Google

Just Another Correction Or Something More?

Daily Chart AMarch 11th

3/11/2015 – Another down day with the Dow Jones down 26 points (-0.15%) and the Nasdaq down 10 points (-0.20%). 

Over the last couple of years one investment strategy in particular worked like magic.  If you were to buy every correction, you would have been greatly rewarded. In record time. It then comes as no surprise that today’s correction is viewed, by most market participants, in the very same fashion.

The question is…..should it be? 

I would exercise extreme caution here. Here is why. In addition to the very well know fundamental issues such as bubble valuation levels and upcoming interest rate increases, we are also dealing with with excessively bullish mindset.

This is anecdotal, but I saw the same mindset at 2000 and 2007 tops. Just last night I had dinner with a big money manager who told me in no uncertain terms “We won’t see another 10-20% correction for as long as Obama is in office (I have no idea why).  Plus, the FED will backstop every sell-off and that anyone who believes otherwise will lose money.”

Perhaps. At the same time, I would rather rely on actual data points and my mathematical/timing work. Not pie in the sky dreams perpetuated by the FED and 6 year of bull market. That is to say, when a bear market kicks in and does go through a 20% (or more) correction, 99% of the investors out there will be left behind holding the bag of HOPE. Just as before. Don’t be one of those people.

This conclusion is further supported by my mathematical and timing work. It clearly shows a severe bear market between 2015-2017. In fact, when it starts it will very quickly retrace most of the gains accrued over the last few years.  If you would be interested in learning when the bear market of 2015-2017 will start (to the day) and its internal composition, please CLICK HERE.

(***Please NoteA bear market might have started already, I am simply not disclosing this information. Due to my obligations to my Subscribers I am unable to provide you with more exact forecasts. In fact, I am being “Wishy Washy” at best with my FREE daily updates here. If you would be interested in exact forecasts, dates, times and precise daily coverage, please Click Here). Daily Stock Market Update. March 11th, 2015  InvestWithAlex.com

Did you enjoy this article? If so, please share our blog with your friends as we try to get traction. Gratitude!!!

Just Another Correction Or Something More? Google

How I Missed The Exact March 2nd Top By 0.1%

Daily Chart AMarch 10th

3/10/2015 – A big down day with the Dow Jones down 333 points (-1.85%) and the Nasdaq down 83 points (-1.67%).

Going into the end of February my subscribers knew that we were facing a major turning point at the Dow 18,320 (+/- 50 points) and that it would occur on February 27th (+/- 1 trading day). If you are wondering, yes, +/- 1 trading day included March 2nd.

My advice was also rather simple, to go short right at the top. The actual top arrived on March 2nd at the Dow 18,285. In the final analysis I have missed it by 15-35 Dow points or 0.1%. Close enough. If you would like to find out what happens next, if this sell-off is over or just getting started, please Click Here.

In the meantime and as I write this, the talking heads on CNBC are trying to figure out what has caused this decline. Was it Greece…the dollar…..was it the good jobs report and anticipated rate increases?

Who cares!!!

While it is important to understand fundamental and technical metrics behind market moves, such indicators do a piss poor job in predicting what the market will do next.  As is the case today.

The stock market moves according it its own mathematical points of force. As it moves in multi-dimensional space with the DNA type of sequencing guiding the entire process. In other words, the stock market is a natural and alive system that moves according to its own growth pattern. As a human body would from the moment of fertilization to the moment of death. If you would be interested in learning more you can start here Timed Value. 

This conclusion is further supported by my mathematical and timing work. It clearly shows a severe bear market between 2014/15-2017. In fact, when it starts it will very quickly retrace most of the gains accrued over the last few years.  If you would be interested in learning when the bear market of 2014/15-2017 will start (to the day) and its internal composition, please CLICK HERE.

(***Please Note: A bear market might have started already, I am simply not disclosing this information. Due to my obligations to my Subscribers I am unable to provide you with more exact forecasts. In fact, I am being “Wishy Washy” at best with my FREE daily updates here. If you would be interested in exact forecasts, dates, times and precise daily coverage, please Click Here). Daily Stock Market Update. March 10th, 2015  InvestWithAlex.com

Did you enjoy this article? If so, please share our blog with your friends as we try to get traction. Gratitude!!!

How I Missed The Exact March 2nd Top By 0.1% Google

Happy Birthday Bull Market. Here Is What Happens Next.

Daily Chart AMarch 9th

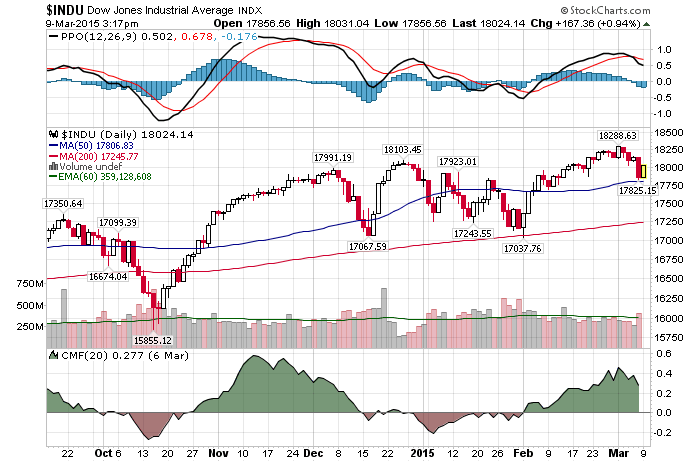
3/9/2015 – A positive day with the Dow Jones up 139 points (+0.78%) and the Nasdaq up 15 points (+0.31%)

The Dow hit an Intraday low of 6,469 on March 6th, 2009. CNBC anchors were freaking out and most analysts were predicting the next great depression and the Dow 1,000. At the same time, a number of incredibly powerful and important TIME cycles were arriving between March 5-9th. Plus, the Dow was completing an important long-term mathematical point (see analysis on this page). In other words, an important bottom was approaching and I was telling everyone who would listen to BUY, BUY, BUY.

Today, the situation is reversed. The stock market is in a bubble territory and my timing work suggests that we should begin our final secular bear market decline shortly. For instance and as I have suggested so many times before, very few bull markets last longer than 5 years.

  • 1914 -1920: Bull Market
  • 1924-1929: Bull Market (followed by a 1929 crash)
  • 1932-1937: Bull Market (followed by a 1937 crash)
  • 1937-1942: Bear Market
  • 1966-1971: Bear Market
  • 1982-1987: Bull Market (followed by a 1987 crash)
  • 1994-2000: Bull Market (followed by a 2000 crash)
  • 2002-2007: Bull Market (followed by a 2007 crash)
  • 2009-2014: Bull Market

In fact, prior to this 6 year run up, the longest 5 year cycle lasted between April of 1924 and September of 1929 (5.5 years). This begs the question…….

Are we in a secular bull market or has this bull cycle been artificially extended by the FED’s intervention and QE?

I don’t believe either explanation would be accurate here. First, I don’t believe that we are in a secular bull market. We are still in a secular bear market that started in 2000 and will only complete in 2017. You can find a more detailed analysis here Why A Bear Market Of 2015-2017 Is Unavoidable

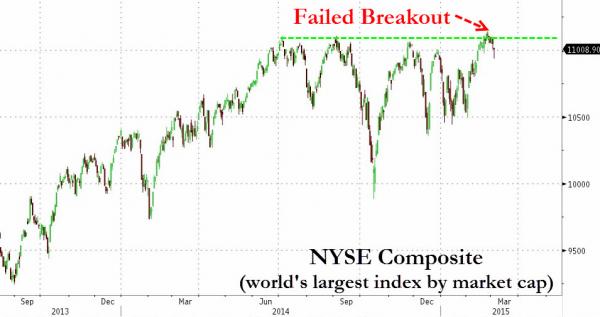
Finally, one can argue that most stocks terminated their bull rallies around July of 2014 (5.5 years). As is evident from the chart below, most stocks have been treading water since then. In other words, it is quite possible that a stealth bear leg has already started.

NYSE

This conclusion is further supported by my mathematical and timing work. It clearly shows a severe bear market between 2014/15-2017. In fact, when it starts it will very quickly retrace most of the gains accrued over the last few years.  If you would be interested in learning when the bear market of 2014/15-2017 will start (to the day) and its internal composition, please CLICK HERE.

(***Please NoteA bear market might have started already, I am simply not disclosing this information. Due to my obligations to my Subscribers I am unable to provide you with more exact forecasts. In fact, I am being “Wishy Washy” at best with my FREE daily updates here. If you would be interested in exact forecasts, dates, times and precise daily coverage, please Click Here). Daily Stock Market Update. March 9th, 2015  InvestWithAlex.com

Did you enjoy this article? If so, please share our blog with your friends as we try to get traction. Gratitude!!!

Happy Birthday Bull Market. Here Is What Happens Next.  Google