InvestWithAlex.com 

Big/Smart Money Is Warning You About The Upcoming Market Collapse. Are You Listening?

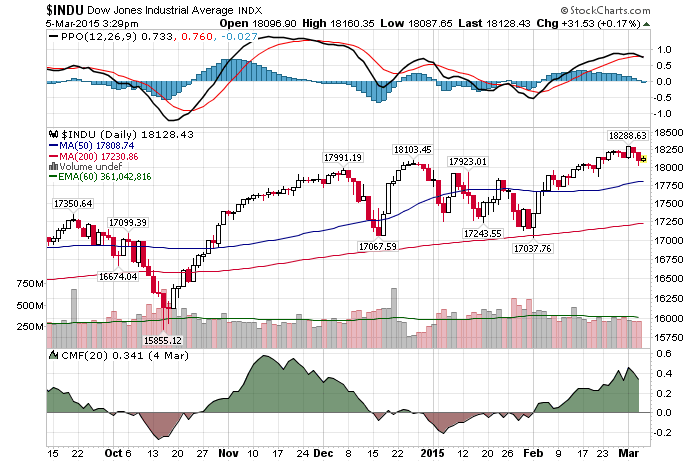
Daily Chart AMarch 6th

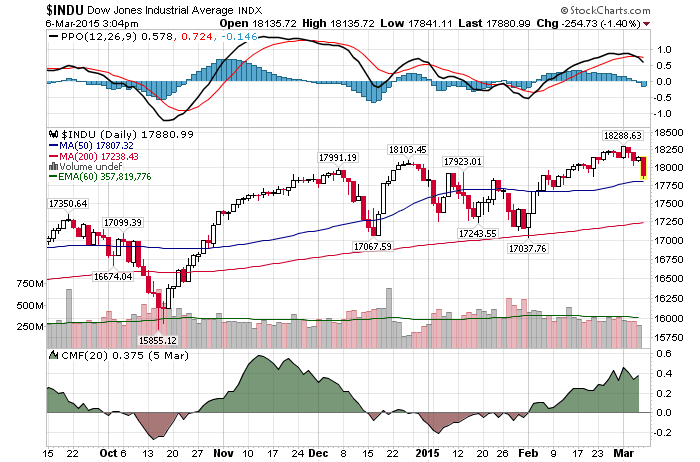
3/6/2015 – A big down day with the Dow Jones down 280 points (-1.54%) and the Nasdaq down 55 points (-1.11%)

I have been warning everyone since last week that low volatility at the time was coming to an end. We are starting to see the evidence of that this week. In fact, the stock market continues to perform exactly as forecasted (for our premium subscribers). If you would like to find out what happens next, please Click Here.  

In the meantime, big/smart money continues to warn investors. As I do.

Ray Dalio, billionaire investor and founder of Bridgewater Associates states,

“It’s the end of the supercycle. It’s the end of the great debt cycle. Central banks have largely lost their power to ease… We now have a situation in which we have largely no spreads and so as a result the transmission mechanism of monetary policy will be less effective. This is a big thing… So I worry on the downside ’cause the downside will come.

Let me put it this way. The only thing that stands between investors and an outright market collapse is misguided faith in the FED. In their ability to control the economy and markets. I wouldn’t want to be in that situation.

“Corporate debt was $3.5 trillion– in 2007, arguably a period and– many would describe as bubbly. It’s 7 trillion now. So it’s gone from 3.5 trillion to 7 trillion. As you know, most of that mix has been in more highly leveraged stuff, Covenant-Lite loans– high yield, that’s where the majority of the rise has been. And if you look at corporations have been using it for, it’s all financial engineering.” -Stan Druckenmiller

Again, this is scary. Borrowing money and then buying your own inflated stock in share buybacks to perpetuate the cycle of speculation is insanity. Yet, that is exactly what most corporates are doing today. In other words, this is just a legal way of getting a Ponzi Scheme going.  There is no other way to describe it. The consequences will be felt and seen as soon as the tide goes out.

“In the past 20 to 30 years, credit has grown to such an extreme globally that debt levels and the ability to service that debt are at risk, relative to the private investment world. Why doesn’t the debt supercycle keep expanding? Because there are limits. The implications are much lower growth, less inflation, lower interest rates, and less profit growth. We brought consumption forward and issued one giant credit card for the past 30 years. Now the bill is coming due. Investors need to get used to low returns, and low growth, inflation, and interest rates for a long time” – Bill Gross

BINGO. I couldn’t agree more. Yes, that probably means that you won’t see the Dow 20K or the S&P 2,500 for quite some time. Perhaps decades. Impossible? Here is a history lesson for you. Between 1897 and 1949, yes a 52 year period of time, the Dow compounded at less than 2% per year and below the rate of inflation. Don’t for a second think that this scenario cannot happen again.

“Notably, equities are not well supported by current valuations, while monetary policy is limited by high debt levels and interest rates that are already close to zero. We are now faced with a geopolitical situation as dangerous as any we have faced since World War II” – Lord Rothschild

Not only are our financial markets in a bubble territory, the current US Administration is hell bent on starting a war with Russia. As a result, invest accordingly.

This conclusion is further supported by my mathematical and timing work. It clearly shows a severe bear market between 2014/15-2017. In fact, when it starts it will very quickly retrace most of the gains accrued over the last few years.  If you would be interested in learning when the bear market of 2014/15-2017 will start (to the day) and its internal composition, please CLICK HERE.

(***Please Note: A bear market might have started already, I am simply not disclosing this information. Due to my obligations to my Subscribers I am unable to provide you with more exact forecasts. In fact, I am being “Wishy Washy” at best with my FREE daily updates here. If you would be interested in exact forecasts, dates, times and precise daily coverage, please Click Here). Daily Stock Market Update. March 6th, 2015  InvestWithAlex.com

Did you enjoy this article? If so, please share our blog with your friends as we try to get traction. Gratitude!!!

Big/Smart Money Is Warning You About Upcoming Market Collapse. Are You Listening? Google

What Most People Don’t Know About Mark Cuban’s Bubble Call

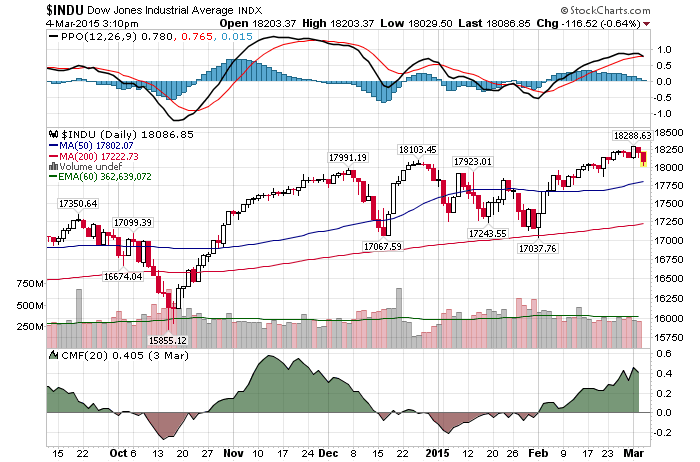
Daily Chart AMarch 5

3/5/2015- A positive day with the Dow Jones up 37 points (+0.20%) and the Nasdaq up 15 points (+0.32%) 

Mark Cuban’s blog post Why This Tech Bubble is Worse Than the Tech Bubble of 2000 is definitely worth 5 minutes of your time.

It is now evident that most market pundits out there are dismissing Mark’s view. And while Mark talks about Angel Investors and illiquidity in that market, his analysis can just as easily be applied to today’s stock market. More about that in a second.

First, here is what most people don’t realize about Mark Cuban. After selling his first business Mark became a heck of a trader and investor in the 1990’s. His returns were so good at the time that Goldman Sachs tried to bring him in order to figure out what he was doing. This same ability helped him unload Broadcast.com for $5.7 Billion to Yahoo right at the top of the tech bubble.

I have absolutely not doubt in my mind that most of these individual Angels and crowd funders are currently under water in their investments. Absolutely none. I say most. The percentage could be higher. Why? Because there is ZERO liquidity for any of those investments. None. Zero. Zip.

So why is this bubble far worse than the tech bubble of 2000 ?

Because the only thing worse than a market with collapsing valuations is a market with no valuations and no liquidity. If stock in a company is worth what somebody will pay for it, what is the stock of a company worth when there is no place to sell it ?

We often talk about the stock market, but we rarely look at this side of the equation. Mark is absolutely right. If you are an Angel Investors, good luck getting your money out. Especially when today’s Silicon Valley’s bubble bursts. Plus, the chances of hitting a good exit in tech are about as good as winning a lottery.

What’s more, the bubble Mark Cuban has identified in the tech industry is the same bubble I see in the stock market. The drivers behind both are the same. The only difference is the amount of liquidity available.

Finally, let me ask you the following question. Who would you rather listen to….a shrewd billionaire investor or some yahoo on CNBC who is predicting the Dow 20K? The choise, as always, is yours.

This conclusion is further supported by my mathematical and timing work. It clearly shows a severe bear market between 2014/15-2017. In fact, when it starts it will very quickly retrace most of the gains accrued over the last few years.  If you would be interested in learning when the bear market of 2014/15-2017 will start (to the day) and its internal composition, please CLICK HERE.

(***Please NoteA bear market might have started already, I am simply not disclosing this information. Due to my obligations to my Subscribers I am unable to provide you with more exact forecasts. In fact, I am being “Wishy Washy” at best with my FREE daily updates here. If you would be interested in exact forecasts, dates, times and precise daily coverage, please Click Here). Daily Stock Market Update. March 4th, 2015  InvestWithAlex.com

Did you enjoy this article? If so, please share our blog with your friends as we try to get traction. Gratitude!!!

What Most People Don’t Know About Mark Cuban’s Bubble Call Google

What You Ought To Know About This Scary Bearish Divergence

Daily Chart AMarch 4

3/4/2015 – Another down day with the Dow Jones down 106 points (-0.58%) and the Nasdaq down 13 points (0.26%). 

The stock market continues to behave as forecasted. If you would like to find out what happens next, please Click Here.  

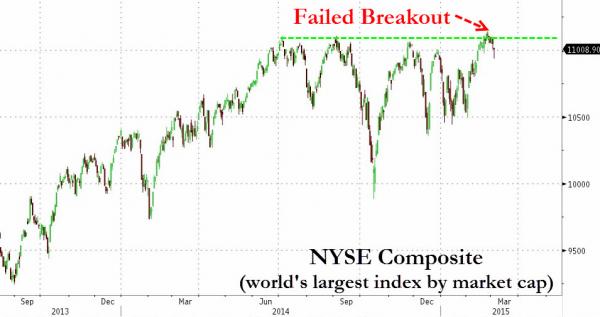
Despite all of the recent bullish hoopla about the Nasdaq 5,000, soon to be witnessed Dow 20K, etc,…..an incredibly important chart below tells a different story. Let’s take a closer look.

Primarily, I want to concentrate on two points.

  1. The majority of the stocks out there have not gone anywhere since about July 17th, 2014 top. As my subscribers know, this was an incredibly important date as per my mathematical and timing work(I am not ready to talk about it on a free forum, but I might explain it in the future). Let’s just say this. It is not a coincidence that NYSE is unable to break above that top. Further, the chart below suggests that the higher highs we have seen on other indices might be nothing more than a beautiful mirage.
  2. As of today, the NYSE has failed in its attempt to break above this resistance line for the 4th time. Again, thus far. Should this failure stand, it becomes an incredibly bearish development for the overall stock market.

In other words, while 95% of market participants are dreaming of an eventual breakout and explosive run up to new highs, you might want to consider another possibility. The possibility of the stock market being in a period of  distribution over the last 8 months, in preparation for an eventual leg down.  If true, now would be a good time to get out instead of increasing your net long exposure. Better yet, it might be a good time to go short.

NYSE

This conclusion is further supported by my mathematical and timing work. It clearly shows a severe bear market between 2014/15-2017. In fact, when it starts it will very quickly retrace most of the gains accrued over the last few years.  If you would be interested in learning when the bear market of 2014/15-2017 will start (to the day) and its internal composition, please CLICK HERE.

(***Please Note: A bear market might have started already, I am simply not disclosing this information. Due to my obligations to my Subscribers I am unable to provide you with more exact forecasts. In fact, I am being “Wishy Washy” at best with my FREE daily updates here. If you would be interested in exact forecasts, dates, times and precise daily coverage, please Click Here). Daily Stock Market Update. March 4th, 2015  InvestWithAlex.com

Did you enjoy this article? If so, please share our blog with your friends as we try to get traction. Gratitude!!!

What You Ought To Know About This Scary Bearish Divergence  Google

NASDAQ Hits 5,000 As Insiders Accelerate Selling

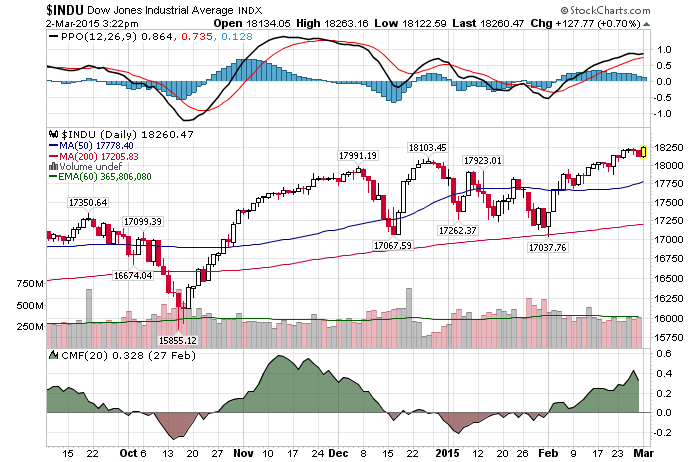
Daily Chart AMarch 2nd

3/2/2015 – An up day with the Dow Jones up 153 points (+0.84%) and the Nasdaq up 45 points (+0.90%). 

The stock market continues to behave as forecasted. If you would like to find out what happens next, please Click Here. 

First, a brief history lesson. The last time the Nasdaq hit 5,000 was in March of 2000. It didn’t stay at that level for very long, a few trading days if I remember correctly. Once the blow off top was set, the index proceeded to collapse 75% in 2 years. Yeah, yeah……I know…..it’s different this time. At least according to the mainstream media, today’s valuation levels are supported by earning (an assumption that I have dismantled here quite a number of times).

With that in mind, 5000 is an important level not only from a psychological point of view, but from a technical one as well. Double tops of such big proportions are incredibly important as they often represent major turning points. Insiders tend to agree.

The first link deserves at least 5 minutes of your time. It presents a fairly good overview of the majority of the things I have covered here over the last few months. Insider selling, overvaluation, excessive bullishness, overbought indicators, speculation, debt fueled buybacks, slowing earnings, weak economic data, etc….

The only remaining question is…….will the Nasdaq break through 5,000 and keep going higher, an outcome most investors anticipate  – OR- will it test this double top, back off and then sell-off? If you have been reading my blog for any length of time, I think you know the answer to that questions.

This conclusion is further supported by my mathematical and timing work. It clearly shows a severe bear market between 2015-2017. In fact, when it starts it will very quickly retrace most of the gains accrued over the last few years.  If you would be interested in learning when the bear market of 2015-2017 will start (to the day) and its internal composition, please CLICK HERE.

(***Please NoteA bear market might have started already, I am simply not disclosing this information. Due to my obligations to my Subscribers I am unable to provide you with more exact forecasts. In fact, I am being “Wishy Washy” at best with my FREE daily updates here. If you would be interested in exact forecasts, dates, times and precise daily coverage, please Click Here). Daily Stock Market Update. March 2nd, 2015  InvestWithAlex.com

Did you enjoy this article? If so, please share our blog with your friends as we try to get traction. Gratitude!!!

NASDAQ Hits 5,000 As Insiders Accelerate Selling Google

Billionaire Investor: The Best Shorting Opportunity Since 2007-09 Is NOW!!!

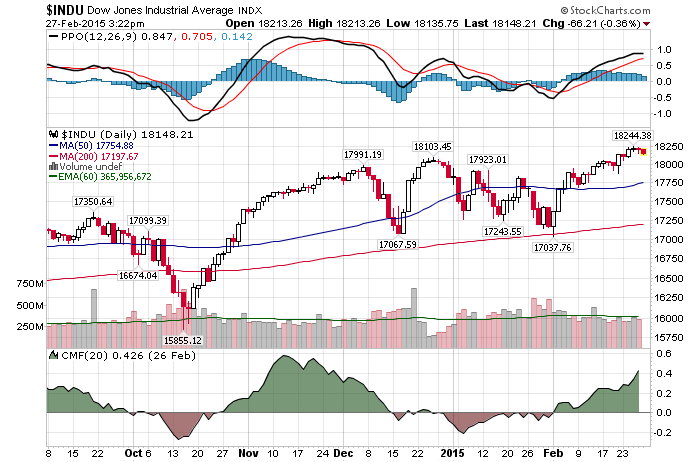
Daily Chart February 27th

2/27/2015- A down day with the Dow Jones down 81 points (-0.45%) and the Nasdaq down 24 points (-0.49%)

The stock market continues to perform as expected. If you would like to find out what happens next, please Click Here. 

Billionaire investor and hedge fund manager Crispin Odey, of Odey Asset Management, recently shared some food for thought.

  • I think equity markets will get devastated. 
  • Major economies are entering a recession that will be remembered in a hundred years. 
  • Bearish opportunity to short stocks looks as great as it was in 2007-2009.

He goes on to say….

We are in the first stage of this downturn. It is too early to see what will happen – a change of this magnitude means the darkness and mist is very great. We will make some mistakes but with our thinking we won’t make the major mistakes. The problem is where you stand – I am amazed to see so many are fully invested given that equities are already fighting the downtrend. Mid and smallcaps have moved into bear markets and much relies on large caps to keep the whole thing going and they are very exposed to international trade.

I mostly agree with Mr. Odey’s economic assessment at this juncture. And while most people would label me as a “perma bear” I would have to disagree with the extent of his bearishness. I know….crazy. Here is why the decline of 2015-2017 will not be as great as the collapse of 2007-2009 and why it is certain that we will not see the crash of 1929-32 nor another great depression. At least for the time being.

This conclusion comes out of my mathematical and timing work. As I have said so many times before, we are now in the final stages of a secular bear market that started in January of 2000. The decline of 2007-2009 was a mid cycle panic. We had the same massive declines in all previous bear markets. For instance, 1907-1908, 1937 crash, 1973-1974.

What does that mean?

It simply means that final secular bear market declines of 1912-1914, 1946-1949 and 1981-1982 are never as violent as mid-cycle panics. That is to say, while the decline of 2015-2017 will be substantial, leading to big losses, it won’t be as violent nor as deep as the decline of 2007-2009.

This conclusion is further supported by my mathematical and timing work. It clearly shows a severe bear market between 2015-2017. In fact, when it starts it will very quickly retrace most of the gains accrued over the last few years.  If you would be interested in learning when the bear market of 2015-2017 will start (to the day) and its internal composition, please CLICK HERE.

(***Please NoteA bear market might have started already, I am simply not disclosing this information. Due to my obligations to my Subscribers I am unable to provide you with more exact forecasts. In fact, I am being “Wishy Washy” at best with my FREE daily updates here. If you would be interested in exact forecasts, dates, times and precise daily coverage, please Click Here). Daily Stock Market Update. February 27th, 2015  InvestWithAlex.com

Did you enjoy this article? If so, please share our blog with your friends as we try to get traction. Gratitude!!!

Billionaire Investor: The Best Shorting Opportunity Since 2007-09 Is NOW!!! Google

Why Bernie Madoff Should Be Our Next FED Chairman

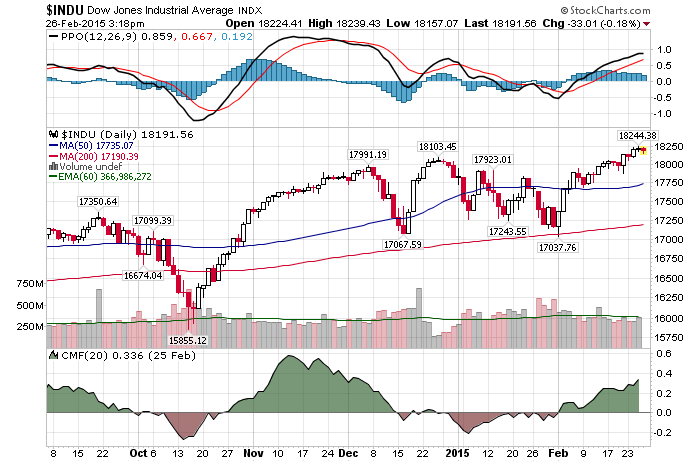
Daily Chart February 26th

2/26/2015 – Another mixed day with the Dow Jones down 10 points (-0.06%) and the Nasdaq up 20 points (+0.42%) 

It is not often that someones comes out and calls like it is. Societe Generale’s notoriously bearish strategist, Albert Edwards, did just that.

The US recovery story is a fraud: SocGen bear

“The downturn in U.S. profits is accelerating and it is not just an energy or U.S. dollar phenomenon – a broad swathe of U.S. economic data has disappointed in February,”

I couldn’t agree more. We have covered this in great detail over the last few months. There is a massive disconnect, for now, between the real US Economy and the stock market.

“The reality is that the vast bulk of economic, as well as earnings, data (even outside the energy sector), has been simply dreadful. The economic cycle will be brought down by asset bubbles bursting long before ‘tight’ policy has any effect. Lessons were learned from the global financial crisis, but not that one.”

Last quarterly report is a perfect illustration on that. Corporates are guiding down in both revenue and earnings. All while the P/E ratios continues to expand due to speculation, buybacks, QE and accounting tricks.  If there was ever a recipe for a disaster, this is it.

“With equity markets galore hitting record highs clearly I must be missing something big!” he said. “I’ve been here before though and know full well how this story ends and it doesn’t involve me being detained in a mental health establishment (usually).”

I have been called all sorts of things in the early 2007 by various market participants. Boy who cried wolf, stupid idiot and my personal favorite, short selling a hole and unbeliever. Yet, the reality remains just as vivid today as it was back then. The stock market is in a massive bubble and it will eventually implode.

In other words, even Bernie Madoff must be amazed at how far the FED took our Ponzi driven economy. Most importantly, that 99.5% of people out there still believe them.

This conclusion is further supported by my mathematical and timing work. It clearly shows a severe bear market between 2015-2017. In fact, when it starts it will very quickly retrace most of the gains accrued over the last few years.  If you would be interested in learning when the bear market of 2015-2017 will start (to the day) and its internal composition, please CLICK HERE.

(***Please NoteA bear market might have started already, I am simply not disclosing this information. Due to my obligations to my Subscribers I am unable to provide you with more exact forecasts. In fact, I am being “Wishy Washy” at best with my FREE daily updates here. If you would be interested in exact forecasts, dates, times and precise daily coverage, please Click Here). Daily Stock Market Update. February 26th, 2015  InvestWithAlex.com

Did you enjoy this article? If so, please share our blog with your friends as we try to get traction. Gratitude!!!

Why Bernie Madoff Should Be Our Next FED Chairman  Google

Russian Tank Division Spotted 300 Meters Away From The Tijuana Border Crossing

US-Russia-Estonia

Let me ask you something. Should the headline above be true, how long would it be before the US Military unleashes an all out war? A few days…..perhaps a few hours? With that in mind, US armor paraded 300m from Russian border Luckily, some in the US Media are starting to say what I have been saying for well over a year now.

The Boston Globe: Putin’s push into Ukraine is rational

The United States, unlike Russia, respects the sovereignty of its neighbors — but only because they are friendly. If Mexico were to invite Russia to build a military base in Tijuana, or if Canada were to allow Chinese missiles to be deployed in Vancouver, the United States would certainly react. We would not wait to be attacked but would preempt the threat — by military means if necessary. This is precisely what Russia is doing in Ukraine. Rather than wait to be encircled, it is acting to defend its security perimeter.

You would imagine that the view above wouldn’t take much logic. Something that most of our politicians clearly lack. Listen, there are only so many times that you can poke a bear with a stick before this bear rips your head off.  And as I have said before, should the US supply lethal weapons to the Ukrainians, that would be the last draw. US mulling lethal aid to Ukraine; Russian response a concern

Here is another thing that most Americans don’t understand. Russian military is not Taliban or depleted Iraqi army. It has the capability to wipe out the entire European NATO force in a few hours. And I am not even talking about the use of nuclear weapons.  Something that American commanders should consider before parading American tanks 300 meters away from the Russian border. By the way, Hitler did the same thing in 1941.

In other words, the American Government should stop acting like a mentally challenged 5 year old playing with matches and a stick of dynamite. Well, unless they are purposely trying to drag us into yet another pointless war.

z32

Russian Tank Division Spotted 300 Meters Away From The Tijuana Border Crossing Google

Why Today’s Stock Market Is More Expensive Than NASDAQ 2000 Bubble

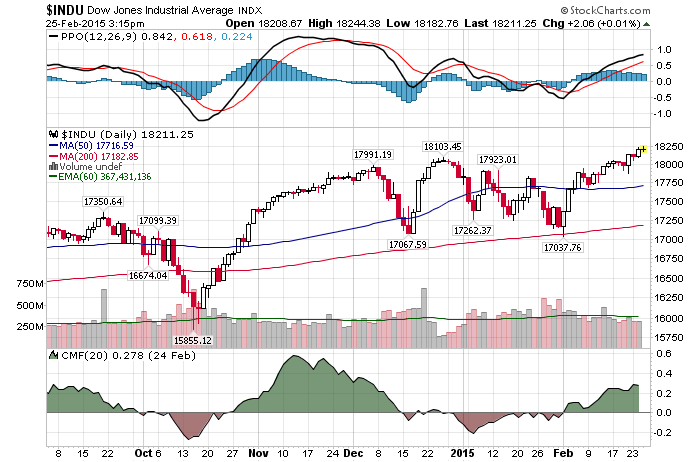
Daily Chart February 25th

2/25/2015 – A mixed day with the Dow Jones up 15 points (+0.08%) and the Nasdaq down 1 point (-0.02%). 

The stock market continues to perform as forecasted. About two weeks ago I have suggested that a period of low volatility is likely to occur. We are witnessing that today. With that in mind, don’t make the mistake of falling asleep here. According to my mathematical and timing work, volatility will be back with the vengeance shortly. If you would like to find out what happens next and when, please Click Here. 

In the meantime, Hillary Clinton paid $300,000 to explain what ails the middle class.  No surprise there as our future presidential candidate proceeded to blame new technology and male chauvinist culture for all of our economic problems.  The real answer, of course, is not as sexy……a massive Ponzi scheme perpetuated by the FED and the US Government. I told you it wouldn’t be as exciting.

Back to our attempt to illustrate just how out of touch with reality the stock market really is.

I have covered the points in the articles above at least a dozen times over the last few months, yet one persistent assumption remains. Most investors out there believe that today’s valuation levels are nowhere near Nasdaq 2000 levels. The articles above dispel some of that.

With that in mind, I am willing to take it even further. Not only are today’s valuation levels on par with Nasdaq 2000 levels, they are much higher. Here is why. The 10-year note was around 6% in March of 2000. It is at 2% today. If we are to plug 6% into today’s valuation models (not 2%), today’s valuation levels go from incredibly expensive to “the most expensive ever”.

Now, one can argue that we are comparing oranges to apples here. I would have to disagree. If we want to compare today’s valuation levels to 2000 levels, we have to use 2000’s discount rate. It is only then that we realize just how out of touch with reality today’s stock market is. That is to say, there is no way in hell this ends well. 

This conclusion is further supported by my mathematical and timing work. It clearly shows a severe bear market between 2014/15-2017. In fact, when it starts it will very quickly retrace most of the gains accrued over the last few years.  If you would be interested in learning when the bear market of 2014/15-2017 will start (to the day) and its internal composition, please CLICK HERE.

(***Please NoteA bear market might have started already, I am simply not disclosing this information. Due to my obligations to my Subscribers I am unable to provide you with more exact forecasts. In fact, I am being “Wishy Washy” at best with my FREE daily updates here. If you would be interested in exact forecasts, dates, times and precise daily coverage, please Click Here). Daily Stock Market Update. February 25th, 2015  InvestWithAlex.com

Did you enjoy this article? If so, please share our blog with your friends as we try to get traction. Gratitude!!!

Why Today’s Stock Market Is More Expensive Than NASDAQ 2000 Bubble Google

Shocking News: There Is Nothing To Invest In

Daily Chart February 2th

2/24/2015 –  A positive day with the Dow Jones up 92 points (+0.51%) and the Nasdaq up 7 points (+0.14%).

The stock market continues to behave as forecasted. If you would like to find out what happens next, please Click Here.

I continue on with my relentless drive to suggest that today’s market environment is about as close to 2000 and 2007 tops as one can get.  And just as back then, very few people are listening or paying attention. Today’s analysis deals with the lack of investment opportunities. (take a look at the article….it is worth 2 minutes of your time).

Managers say they haven’t changed, the market has. The easy money climate of near-zero interest rates engineered by the Federal Reserve has artificially inflated prices of lower-quality U.S. stocks, they say, punishing those who focus on businesses with the best fundamentals. At the same time, the relentless climb of prices across equity markets has left them with few chances to sniff out bargains or show what they can do in more-volatile times.

“In straight-up markets you don’t need active managers,” D’Alelio said in a telephone interview. “If the next five years are the same, there won’t be any active managers left.”

Not only do I agree and sympathize with the sentiment above, I find myself in the same boat. There is nothing to invest in. Now, pay attention. I didn’t say to “speculate in”, I have said “to invest in”.

Proper investing demands initial undervaluation in growth or value as a starting point. With most stock being excessively overvalued, finding a reasonably priced investment opportunity at this juncture is just about as tough as finding an honest politician.

At least at 2000 top most of the money flowed into technology and there were a multitude of cheap and unknown investment opportunities laying by the way side. That is not the case today. Everything, and I mean everything has been driven up to excessive levels. We all know how this ends.

This conclusion is further supported by my mathematical and timing work. It clearly shows a severe bear market between 2014/15-2017. In fact, when it starts it will very quickly retrace most of the gains accrued over the last few years.  If you would be interested in learning when the bear market of 2014/15-2017 will start (to the day) and its internal composition, please CLICK HERE.

(***Please NoteA bear market might have started already, I am simply not disclosing this information. Due to my obligations to my Subscribers I am unable to provide you with more exact forecasts. In fact, I am being “Wishy Washy” at best with my FREE daily updates here. If you would be interested in exact forecasts, dates, times and precise daily coverage, please Click Here). Daily Stock Market Update. February 24th, 2015  InvestWithAlex.com

Did you enjoy this article? If so, please share our blog with your friends as we try to get traction. Gratitude!!!

Shocking News: There Is Nothing To Invest In  Google

Why The FED Is Freaking Out

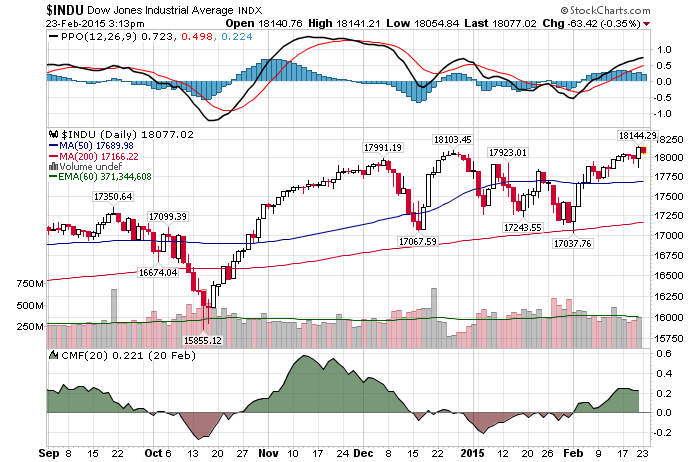
Daily Chart February 23th

2/23/2015 – Another mixed day with the Dow Jones down 24 points (-0.13%) and the Nasdaq up 5 points (+0.10%). 

The stock market continues to behave as forecasted. If you would like to find out when and where the market tops out next, please Click Here.

Two relevant views of the stock market in today’s daily update.

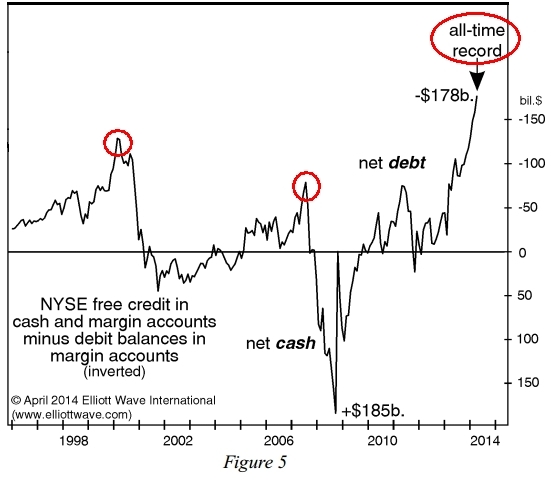
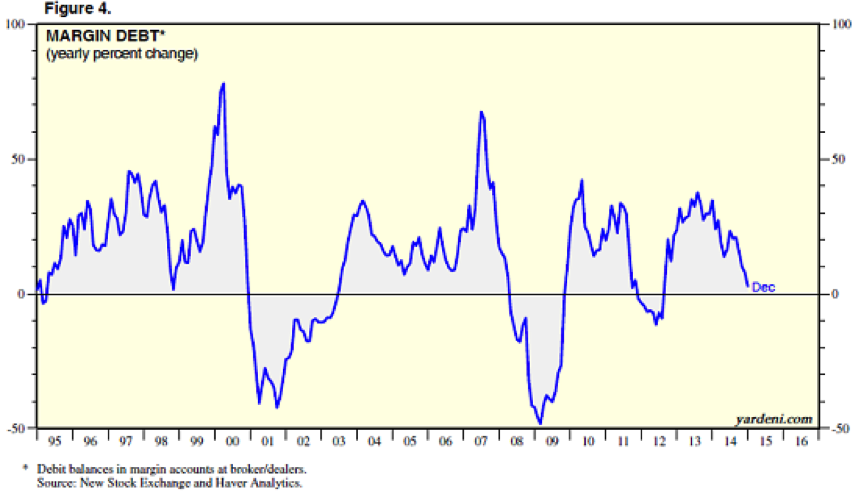
Despite recent higher highs, the market continues to flash a red warning light in various metrics. Today, lets take a quick look at margin debt. As the charts below suggest, long-term margin debt is at an all time high. Higher than at 2000 and 2007 tops. Short-term, margin debt has peaked last year and is now rolling over. That brings into question the validity of today’s rally and the ability of this market to push any higher.

margin debt2 investwithalex

margin debt2

On the flip side, this also raises the question if the liquidity can disappear overnight, just as it did back in 2008. Making the Fed very worried. From January’s FED Minutes.

“Finally, the increased role of bond and loan mutual funds, in conjunction with other factors, may have increased the risk that liquidity pressures could emerge in related markets if investor appetite for such assets wanes.”

Luckily, we do not have to guess here. We just have to look at the most recent sell-off in September-October of 2014. Despite a moderate decline of just 1,500 points on the Dow, the liquidity did dry up at that time. That is to say, should a larger 10-20% sell-off develop over the next few months, it would be wise to anticipate the liquidity to vanish and declines to accelerate. This does not bode well for the overall market.

This conclusion is further supported by my mathematical and timing work. It clearly shows a severe bear market between 2014/15-2017. In fact, when it starts it will very quickly retrace most of the gains accrued over the last few years.  If you would be interested in learning when the bear market of 2014/15-2017 will start (to the day) and its internal composition, please CLICK HERE.

(***Please NoteA bear market might have started already, I am simply not disclosing this information. Due to my obligations to my Subscribers I am unable to provide you with more exact forecasts. In fact, I am being “Wishy Washy” at best with my FREE daily updates here. If you would be interested in exact forecasts, dates, times and precise daily coverage, please Click Here). Daily Stock Market Update. February 23rd, 2015  InvestWithAlex.com

Did you enjoy this article? If so, please share our blog with your friends as we try to get traction. Gratitude!!!

Why The FED Is Freaking Out  Google