InvestWithAlex.com 

The Math Behind Identifying February 2nd Bottom

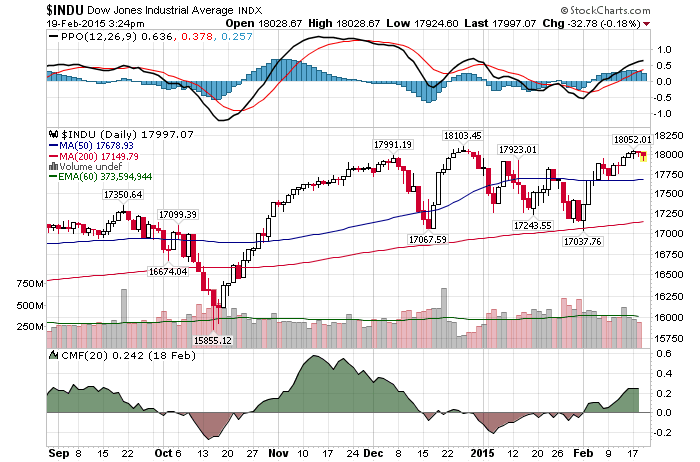
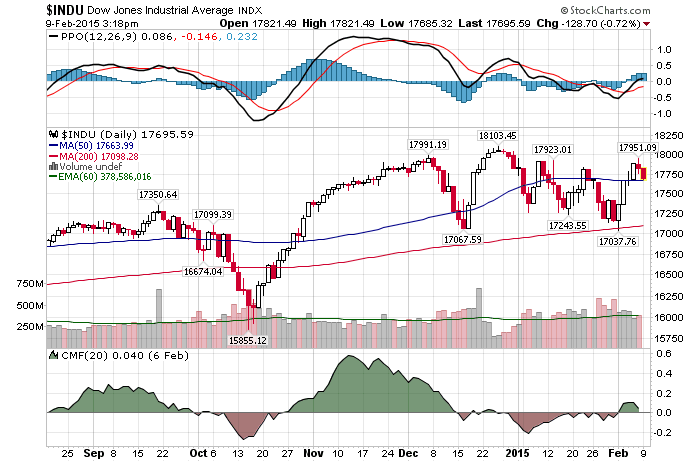
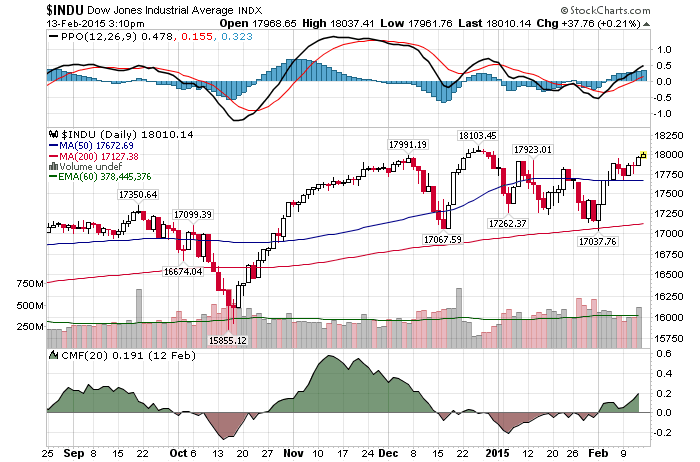
Daily Chart February 20th

2/20/2015 – A positive day with the Dow Jones up 155 points (+0.86%) and the Nasdaq up 31 points (+0.63%).

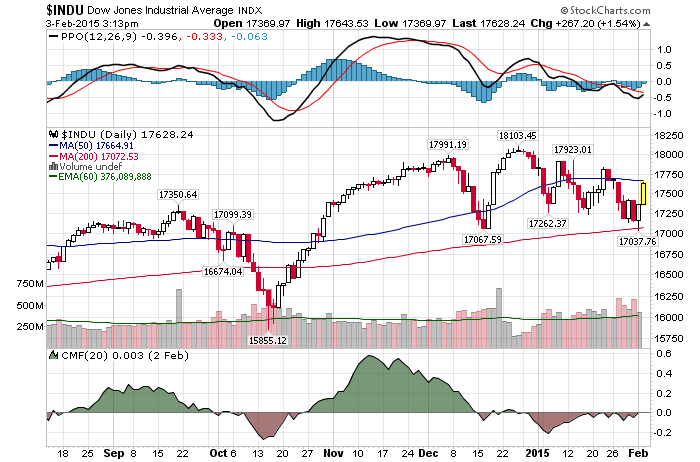
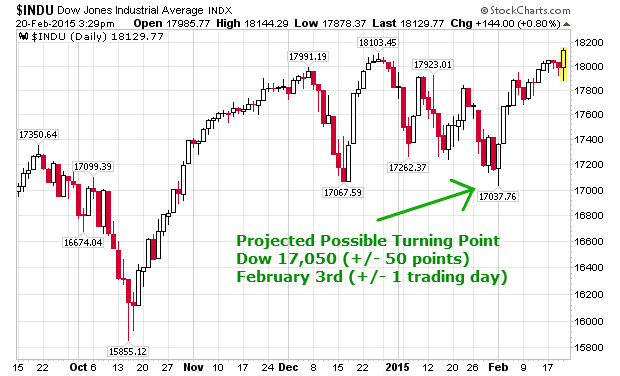
In my weekly update to my premium subscribers on January 31st, 2015 I have identified February 3rd, 2015 (+/- 1 trading day) at the Dow 17,050 (+/- 50 points) as a possible turning point. Further, I suggested that if the Dow is to stop there and reverse, it would be highly likely we experience a substantial bounce. Just as we have.

So, how did I do it? In two steps. 

  1. A number of powerful cycles arrived between February 2nd and 3rd. That meant one of two things. The Dow would either break below 17,000 and accelerate lower -OR- it would turn around and stage a bounce/rally. What cycles? It would be impossible to describe in this short summary, but you can learn more about it in Timed Value.
  2. My multi-dimensional mathematical calculations showed that the move between December 26th top and February 2/3rd bottom, October 16th low and February 2/3rd bottom, etc….(there were many others) would be exactly equal to prior moves. Suggesting a powerful point of force (possible turning point).

The result is now evident. The Dow bottomed on February 2nd at 17,037 before turning around and staging a massive 1,000 + point rally. Thus far. If you would like to find out what happens next, please Click Here. 

Feb 2 2014 bottom

In the meantime, John Hussman believes the stock market is so overpriced at this juncture that your return over the next 10-years will be a big fat ZERO. Hussman: Get Ready for 10 Years of Near-Zero Returns on Stocks

“Equity valuations — on the most historically reliable measures we identify — are now fully 117 percent above their pre-bubble norms, on average”

I would have to agree with John on almost everything but the actual print on the Dow 10 years from now. My mathematical and timing work suggests that we will be a lot higher than 18,000 by 2025. Mostly due to inflation, not fundamentals. The trick is to realize how we get there. For instance, those who expect this bull market to continue for the foreseeable future will be utterly disappointed. So will the bears who expect this market to collapse. The truth, as always, is somewhere in the middle.

This conclusion is further supported by my mathematical and timing work. It clearly shows a severe bear market between 2014/15-2017. In fact, when it starts it will very quickly retrace most of the gains accrued over the last few years.  If you would be interested in learning when the bear market of 2014/15-2017 will start (to the day) and its internal composition, please CLICK HERE.

(***Please NoteA bear market might have started already, I am simply not disclosing this information. Due to my obligations to my Subscribers I am unable to provide you with more exact forecasts. In fact, I am being “Wishy Washy” at best with my FREE daily updates here. If you would be interested in exact forecasts, dates, times and precise daily coverage, please Click Here). Daily Stock Market Update. February 20th, 2015  InvestWithAlex.com

Did you enjoy this article? If so, please share our blog with your friends as we try to get traction. Gratitude!!!

The Math Behind Identifying February 2nd Bottom Google

The Folly Of Following Mainstream Financial Media

Daily Chart February 19th

2/19/2015 – Another mixed day with the Dow Jones down 44 points (-0.28%) and the Nasdaq up 18 points (+0.37%) 

The stock market remains in a tight trading range. Just as anticipated. If you would like to find out when that ends and what happens next, please Click Here.  

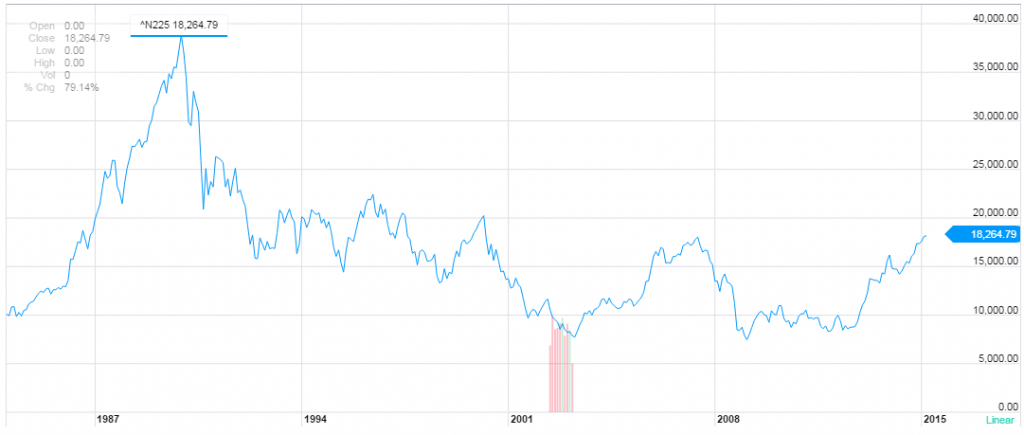
Today’s mainstream financial media is about as useful as a pound of snow at the North Pole. For instance, I had a good chuckle when I saw the following headline. Japan Stocks Rise Toward 15-Year High And while the article perpetuates “all is good in the land of financial bubbles” mindset, the reality is anything but that.

As the chart below suggests, the Nikkea is still down over 50% since its top 25 years ago. Plus, it is approaching an important resistance level. We have covered this topic in greater detail in one of our weekly Podcasts and what that means. In short, given today’s macroeconomic picture, currency wars, Japan’s outright attempts to monetize their economy and a certain technical setup, the likelihood of the Nikkea going much higher here is slim.

Nikkea

Point being, try to ignore financial media when it comes to making your investment decisions. As is evident today, they become increasingly bullish at or near major tops (as today) and incredibly bearish at various bottoms (ex. 2009). Tune them out, do your own research and realize that we are, once again, in a midst of a giant financial bubble.

This conclusion is further supported by my mathematical and timing work. It clearly shows a severe bear market between 2014/15-2017. In fact, when it starts it will very quickly retrace most of the gains accrued over the last few years.  If you would be interested in learning when the bear market of 2014/15-2017 will start (to the day) and its internal composition, please CLICK HERE.

(***Please NoteA bear market might have started already, I am simply not disclosing this information. Due to my obligations to my Subscribers I am unable to provide you with more exact forecasts. In fact, I am being “Wishy Washy” at best with my FREE daily updates here. If you would be interested in exact forecasts, dates, times and precise daily coverage, please Click Here). Daily Stock Market Update. February 19th, 2015  InvestWithAlex.com

Did you enjoy this article? If so, please share our blog with your friends as we try to get traction. Gratitude!!!

The Folly Of Following Mainstream Financial Media. Google

Top Hedge Fund Managers Are Moving Out Of The US Markets. Should You?

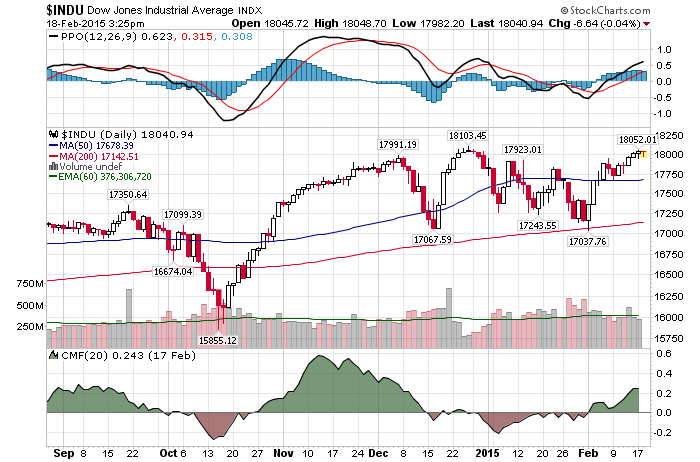
Daily Chart February 18th

2/18/2015 – A mixed day with the Dow Jones down 18 points (-0.10%) and the Nasdaq up 7 points (+0.14%)

The stock market continues to behave as forecasts. There is a reason why it is fairly dead at this stage. If you would like to find out what happens next and when, please Click Here. 

First, the FED Minutes. Not much new to report as there was no change to their stance. Here is a more detailed look and summary Instant View: Federal Reserve minutes suggest slow path to rate hikes

As I have suggested so many times before, the FED finds itself between a rock and a hard place. Should they initiate interest rate hikes they will immediately slam both the US Economy and our capital markets.  On the flip side, should they wait, they will miss an opportunity re-load on recession fighting tools before the next one strikes. Such is the folly of having a patient hooked of the heroin of credit. When the withdrawal hits, and one way or another it will, expect the stock market to crumble. The only question is WHEN?

Speaking of, a number of top hedge fund managers, including Soros, are lightening up on their US exposure. Billionaire Soros Shifts Money to Europe, Asia  And while their reallocation away from the US equity markets might appear marginal and strategic, you might want to read between the lines. What they are saying is….

  1. The US market is either fully valued or overvalued.
  2. Better opportunities elsewhere.

Meaning, don’t expect any worthwhile returns from the US stock market going forward. I will go even further. Anticipate a substantial correction over the next few years. To the likes of 2000-2002 decline on the Dow.

This conclusion is further supported by my mathematical and timing work. It clearly shows a severe bear market between 2014/15-2017. In fact, when it starts it will very quickly retrace most of the gains accrued over the last few years.  If you would be interested in learning when the bear market of 2014/15-2017 will start (to the day) and its internal composition, please CLICK HERE.

(***Please NoteA bear market might have started already, I am simply not disclosing this information. Due to my obligations to my Subscribers I am unable to provide you with more exact forecasts. In fact, I am being “Wishy Washy” at best with my FREE daily updates here. If you would be interested in exact forecasts, dates, times and precise daily coverage, please Click Here). Daily Stock Market Update. February 18th, 2015  InvestWithAlex.com

Did you enjoy this article? If so, please share our blog with your friends as we try to get traction. Gratitude!!!

Top Hedge Fund Managers Are Moving Out Of The US Markets. Should You?Google

Why Higher Salaries Are Nothing But A Pipe Dream

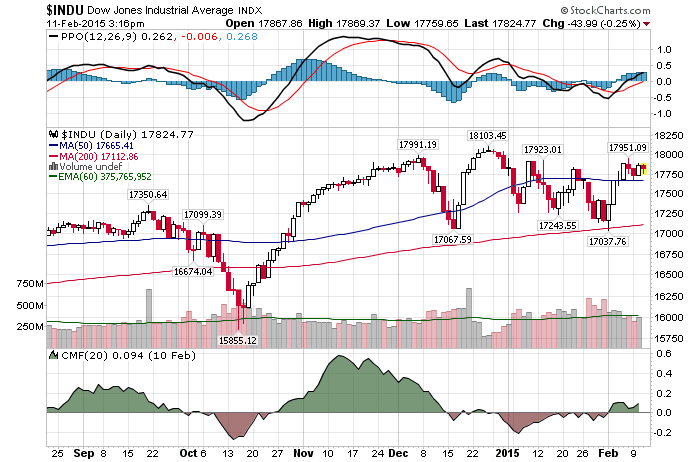
Daily Chart February 11th

2/11/2015 – A mixed day with the Dow Jones down 7 points (-0.04%) and the Nasdaq up 13 points (+0.28%).

Most mainstream economists are extremely exited. According to them the US Economy is booming, the unemployment rate is scraping the bottom, job openings are surging and salaries are about to skyrocket. That in turn will propel the economy forward and today’s “secular bull market” will run for at least another 10 years. A view that can be found here:  Americans Are About to Get a Nice Fat Pay Raise

They have got it all wrong. Here is why……..

  1. The true unemployment/underemployment rate is at least double the official number of 5.7%. Is the Unemployment Rate of 5.7 Percent Just a ‘Big Lie’? That is to say, there is no real pressure for companies to increase wages.
  2. We are at the tail end of this FED and liquidity driven economic recovery cycle. Meaning, the next bear market and recession are just around the corner. Most corporations understand that we are rolling over and won’t hire into a recession.
  3. Most economists have been perplexed as to why CAPEX remained flat over the last few years. Even though the economy surged higher and interest rates remained low. It is because most companies have already optimized their balance sheets and there isn’t that much new to invest in. It’s the same reason very few companies will expand their labor force. There is no need.
  4. Productivity and new technologies. It is a lot cheaper to buy a $40,000 robot that will last for my 5 years than to hire a $40,000 a year complaining and lunch taking human being. We are getting there fast as technology and artificial intelligence improves.

In other words, don’t expect salaries to surge anytime soon. Certainly don’t demand higher pay or quit your job before you have another one lined up.

This conclusion is further supported by my mathematical and timing work. It clearly shows a severe bear market between 2014/15-2017. In fact, when it starts it will very quickly retrace most of the gains accrued over the last few years.  If you would be interested in learning when the bear market of 2014/15-2017 will start (to the day) and its internal composition, please CLICK HERE.

(***Please NoteA bear market might have started already, I am simply not disclosing this information. Due to my obligations to my Subscribers I am unable to provide you with more exact forecasts. In fact, I am being “Wishy Washy” at best with my FREE daily updates here. If you would be interested in exact forecasts, dates, times and precise daily coverage, please Click Here). Daily Stock Market Update. February 11th, 2015  InvestWithAlex.com

Did you enjoy this article? If so, please share our blog with your friends as we try to get traction. Gratitude!!!

Why Higher Salaries Are Nothing But A Pipe Dream  Google

Simple Cycles Analysis Predicts A Severe Bear Market of 2015-2017

Daily Chart February 13th2/13/2015 – An up day with the Dow Jones up 46 points (+0.26%) and the Nasdaq up 36 points (+0.75%). 

Below is a comprehensive longer-term review of the stock market and what the next few years holds. 

In the early January of 2000, the US Economy wa s booming. The Dow was fast approaching 11,800 and the Nasdaq was a stone throws away from its improbable benchmark of 5,000. Everyone was making a ton of money and as far as most people were concerned, the future looked very bright.  So much so, that very few people predicted a bear market of 2000-2002, let alone a secular 2000-2017 bear market that was about to begin.

The only way to do so was to know and to understand the cyclical TIME structure oscillating within the stock market.  For instance, an analyst working with such time cycles would know that the stock market’s 17-18 year cycle was topping out in conjunction with the 5 year cycle that started at 1994 bottom.  The bull market that started at the bottom in August of 1982 was coming to a conclusion. In fact, it would top out exactly 17.5 years after it had started or on January 14th, 2000 at 11,800. The 5 year cycle that started in December of 1994 would top out at exactly the same time; 5 years and 35 trading days after it had started.

What does this have to do with predicting a severe bear market of 2014/15-2017?

Everything.  Based on my work the stock market is a mathematically precise entity. And while there are hundreds of TIME cycles oscillating within the stock market at any one time, I will concentrate on only two to prove my point.  The 17-18 cycle and the 5 year cycles. We will look at these cycles over the last 100+ years and I will prove to you, without a shadow of a doubt, they work.

THE 17-18 YEAR CYCLE IN THE STOCK MARKET:
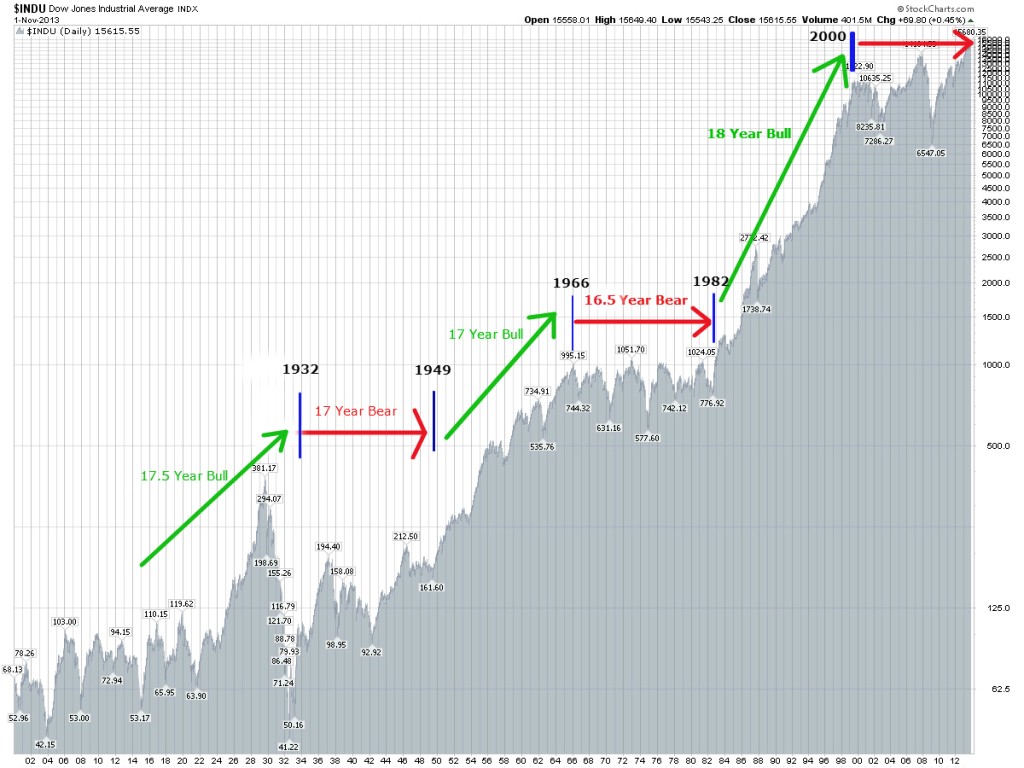
Long Term Dow Structure3

Long-term cycles within the stock market tend to oscillate going all the way back to the first day of trading, in May of 1790.  If you would be inclined, I would encourage you to verify that information for yourself. For our purposes we will start our analysis a little bit later or exactly 100 years ago. As the chart above indicates, the stock market tends to oscillate in clearly defined 17-18 year alternating Bull/Bear market cycles.

  • 17.5 Year Bull Market (1914 bottom to 1932 bottom): The previous bear market terminated in July of 1914. At that time the US stock market shut down for World War 1. The stock market remained closed between August of 1914 and December of 1914 (a very rare occurrence). When the market finally reopened in December of 1914 it immediately began a rally that would not terminate until October of 1929. Followed by a now famous 1929 stock market crash and a massive 90% 3 year decline. The cycle terminated at the bottom in 1932, completing the 17.5 year bull market cycle at that time.

*Note: It is important to address the 1929-1932 bear market and its impact on the overall 1914-1932 Bull Market cycle. It is a complex matter to discuss without sufficient background or understanding, but the final (short-term) structural composition of this Bull Cycle inverted over the last 3 years (1929-1932). Mostly due to a massive rally between 1924-1929 and a number of down cycles converging on this time period at the same time.  Regardless, the overall cycle lasted 17.5 years.

  • 17 Year BEAR Market (1932 bottom to 1949 bottom): The cycle originated at the bottom in July of 1932 and lasted until June of 1949. During this period of time we had a post great depression bounce, 1937 crash and World War 2. Yet, despite the overall upward trajectory, this clearly defined 1949 bottom remained 60% below its 1929 top and well below both its 1937 and 1942 tops.
  • 17 Year BULL Market (1949 bottom to 1966 top): The market surged higher between 1949 bottom and 1966 top. This was the so called “Golden Age” of post war reconstruction and the American industrial boom. During this time the Dow appreciated over 500% in a clearly defined bull market cycle.
  • 16.5 Year BEAR Market (1966 top to 1982 bottom): The market stayed relatively flat during this period of time with a few notable declines of 30-50%. With the 1972-1974 mid cycle decline of 54% being the largest one.  This clearly defined bear market completed in August of 1982. Approximately 25% below its 1966 top.
  • 17.5 Year BULL Market (1982 bottom to 2000 top): A very well known period and a clearly defined bull market. The market surged higher from its August of 1982 bottom to reach its historic top in January of 2000. During this time the Dow appreciated over 1,400% in one of the strongest bull markets in history.
  • 17 Year BEAR Market (2000 top to 2017 bottom): Even though the market is sitting near all time highs (as of this writing in January of 2014) and even though most people have assumed that the new bull market has started, in relative terms the market hasn’t appreciated very much since its top in 2000. The Nasdaq is still down. Plus, with the final down leg of this bear market being ahead of us (based on my mathematical and timing work), the BEAR market of 2000-2017 should complete itself in a negative territory or below its 2000 top.

It is important to note that the small variation (of +/- 1 year) in duration of these cycles is caused by smaller or larger cycles arriving at the same time. As such and based on the cycles above, we are no longer working in an arbitrary fashion when it comes to predicting the stock market.  In other words, if the stock market repeats a clearly defined 17-18 year Bull/Bear cycle over a 220 year period of time (since 1790) and does so without interruption,  it is safe to assume that the future is predictable and not random.

THE 5 YEAR CYCLE IN THE STOCK MARKET

One other easily identifiable cycle within the stock market is the 5 year cycle. These 5 year cycles represent one completed growth pattern or one completed Bull or Bear cycle. Typically, they tend to appear for 5 years, disappear and then reappear at a certain point in the future. While they are not sequential as the 17-18 year cycle above, once their place within the overall stock market is understood, they show up at exactly the right time.  For instance,

  • 1914 -1920: Bull Market
  • 1924-1929: Bull Market (followed by a 1929 crash)
  • 1932-1937: Bull Market (followed by a 1937 crash)
  • 1937-1942: Bear Market
  • 1966-1971: Bear Market
  • 1982-1987: Bull Market (followed by a 1987 crash)
  • 1994-2000: Bull Market (followed by a 2000 crash)
  • 2002-2007: Bull Market (followed by a 2007 crash)
  • 2009-2014: Bull Market

One thing to understand about these 5 Year cycles is that they are exact. They have much lower level variance as compared to their longer counterparts. Essentially, we are NOT talking about 5 years +/- 6 months. We are talking about 5 years +/- a few days. For instance, the 2002-2007cycle started on October 10th, 2002 (at 2002 bottom) and terminated on October 11th, 2007. If you are counting, that is exactly 5 Years and 1 day or scary accurate. I encourage you to study the other cycles outlined above in order to prove to yourself how shockingly accurate they all are.

 CONCLUSION: 

In summary, predicting a bear market of 2015-2017 is rather simple.  All 17-18 year bear cycles end with a 2-3 year bear market. For instance, 1912-1914, 1946-1949 and 1979-1982. And while most believe that the secular bear market ended at 2009 bottom, it is not the case. The secular bear market of 2000-2017 is still in effect and will terminate only when the year 2017 is reached. Although the final price bottom will be higher than the mid-cycle bottom reached in March of 2009.

Further, the 5-Year cycle that started on March 6th, 2009 bottom terminated on July 16th, 2014. Suggesting that the stock market is now ready to initiate its bear leg (despite recent higher highs). When I combine this cyclical analysis with the rest of my mathematical and timing work, the outcome is crystal clear. A severe bear market of 2015-2017 is just around the corner.

This conclusion is further supported by my mathematical and timing work. It clearly shows a severe bear market between 2014/15-2017. In fact, when it starts it will very quickly retrace most of the gains accrued over the last few years.  If you would be interested in learning when the bear market of 2014/15-2017 will start (to the day) and its internal composition, please CLICK HERE.

(***Please NoteA bear market might have started already, I am simply not disclosing this information. Due to my obligations to my Subscribers I am unable to provide you with more exact forecasts. In fact, I am being “Wishy Washy” at best with my FREE daily updates here. If you would be interested in exact forecasts, dates, times and precise daily coverage, please Click Here). Daily Stock Market Update. February 10th, 2015  InvestWithAlex.com

Did you enjoy this article? If so, please share our blog with your friends as we try to get traction. Gratitude!!!

Simple Cycles Analysis Predicts A Severe Bear Market of 2015-2017 Google
The Shocking Truth Behind Today’s Market Psychology

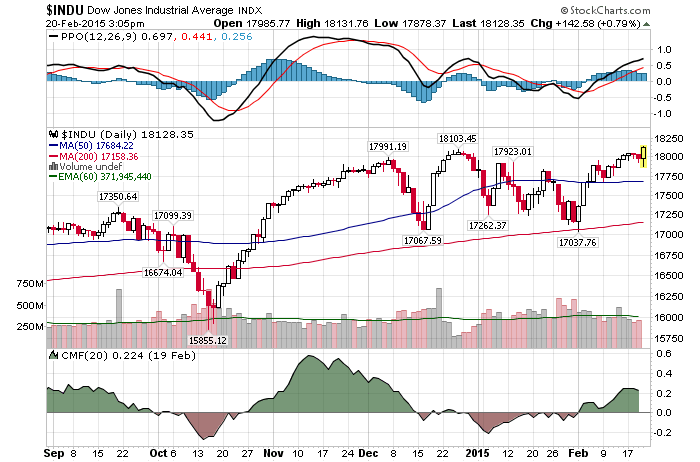
Daily Chart February 9th2/9/2015 – A down day with the Dow Jones down 95 points (-0.53%) and the Nasdaq down 18 points (-0.39%).
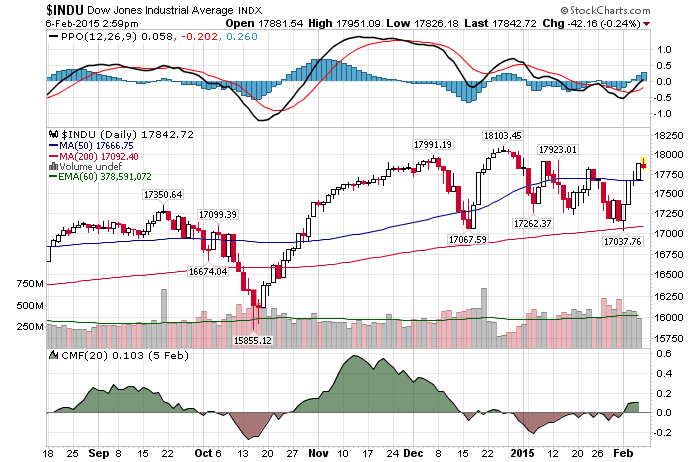
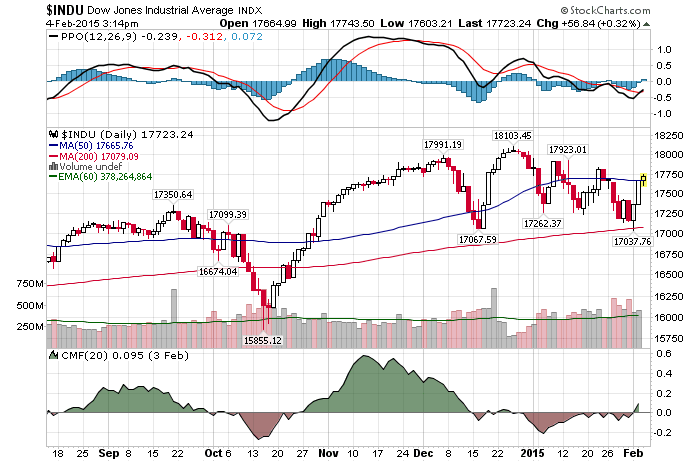
The volatility is certainly back as the market continues to drive both bulls and bears up the wall. Over the last 25 trading days, we had not one, not two, but six massive moves of 600-1,000 points on the Dow.

Why is this important? 

This becomes incredibly important when we begin to consider market psychology. Think about it in the following fashion. At this juncture bulls are incredibly emboldened. Every sell off over the last few months and years has been recovered in record time as the market keeps pushing higher. At least to the bull this market cannot do wrong and every declined is viewed as a buying opportunity. In other words, the bulls are completely unconcerned with today’s trading range or any possibility of a large sell-off.

The situation is completely reversed for the bears. The second remaining bears get excited about a decline the market tends to completely annihilate them. Just as we saw during the 900+ point rally last week.  Forcing most bears to be too afraid to initiate a short position.

So?

Well, this sort of a psychological setup can only play out in the following fashion……99% of bulls will be trapped when the market has a significant breakdown and 99% of bears will fail to initiate a profitable short position.  Or just as it should be.

This conclusion is further supported by my mathematical and timing work. It clearly shows a severe bear market between 2014/15-2017. In fact, when it starts it will very quickly retrace most of the gains accrued over the last few years.  If you would be interested in learning when the bear market of 2014/15-2017 will start (to the day) and its internal composition, please CLICK HERE.

(***Please NoteA bear market might have started already, I am simply not disclosing this information. Due to my obligations to my Subscribers I am unable to provide you with more exact forecasts. In fact, I am being “Wishy Washy” at best with my FREE daily updates here. If you would be interested in exact forecasts, dates, times and precise daily coverage, please Click Here). Daily Stock Market Update. February 9th, 2015  InvestWithAlex.com

Did you enjoy this article? If so, please share our blog with your friends as we try to get traction. Gratitude!!!

The Shocking Truth Behind Today’s Market Psychology  Google

Why Some Very Smart Investors Are Worried About This Market

Daily Chart February 6th

2/6/2015 – A down day with the Dow Jones down 62 points (-0.34%) and the Nasdaq down 20 points (-0.43%). 

It was a big week for the overall market. A near collapse turned into a massive rally and the bulls are, once again, out in force. With that in mind, a number of important red flags remain. We have talked about some of them in Thursday’s update. Here are some warning signs that other “smart” investors are seeing.

John Bogle: The Stock Market Is Ignoring Big Risks

John Bogle, founder of the Vanguard group, spots quite a few risks.

  • The market is nervous.
  • Numerous financial, economic and macro/war risks.
  • We can easily see a 25-30% correction.
  • Keep buying.

The market is ought to be nervous. It has been close to 6 years since the last real bear market correction ended on March 6th, 2009.  And as I so often suggest, bull market runs don’t typically last for more than 5 to 5.5 years. It’s quite strange, but most markets have not moved very much since July 17th, 2014 top (5.5 years). An ominous sign or just another data point to ignore? Click Here to find out.

David Stockman: Didn’t Anyone Notice US Company Profits Are Falling, Not Rising?

The stock market is not cheap. On the contrary, today’s valuation levels are some of highest in history. I have beaten this point to death over the last year. David Stockman tends to agree.

The huge valuation gains in stocks during the current bull market have nothing to do with an honest marketplace, and the cheering on Wall Street is bound to be replaced by tears, according David Stockman, White House budget chief during the Reagan administration.

Stockman estimates fourth-quarter S&P 500 earnings are actually down 5 percent from the year-ago period, but there has been little mention of that fact in media coverage.

“That’s because the talking heads invariably reference ‘adjusted’ or ‘ex-items’ earnings, which, almost by definition, exclude charges for every imaginable business mistake and bonehead executive action — such as soured M&A [merger and acquisition] deals and ‘restructuring’ expense — that could possibly cause earnings to go down.

I couldn’t have said it better myself.  And since REAL earnings are going down, corporates are guiding down and buybacks are slowing, at what point does this speculative P/E expansion snaps back? And what would that mean for the stock market….a 30-40-50% haircut? I think we are about to find out.

This conclusion is further supported by my mathematical and timing work. It clearly shows a severe bear market between 2014/15-2017. In fact, when it starts it will very quickly retrace most of the gains accrued over the last few years.  If you would be interested in learning when the bear market of 2014/15-2017 will start (to the day) and its internal composition, please CLICK HERE.

(***Please NoteA bear market might have started already, I am simply not disclosing this information. Due to my obligations to my Subscribers I am unable to provide you with more exact forecasts. In fact, I am being “Wishy Washy” at best with my FREE daily updates here. If you would be interested in exact forecasts, dates, times and precise daily coverage, pleasClick Here). Daily Stock Market Update. February 6th, 2015  InvestWithAlex.com

Did you enjoy this article? If so, please share our blog with your friends as we try to get traction. Gratitude!!!

Why Some Very Smart Investors Are Worried About This Market  Google

Is King Dollar About To Die?

Daily Chart February 4th

2/4/2015 – A mixed day with the Dow Jones up 8 points (+0.04%) and the Nasdaq down 11 points (-0.23%). 

George Soros likes to look for mass delusions, ride the trend up until it runs out of steam and then take the other side of the trade. When we look at the stock market today, perhaps there is no greater delusion than the FED and its overwhelming believe in the stimulus. Paul Singer states….

Stimulus is an uncertain experiment in market manipulation that, like some cult religion, has otherwise intelligent people believing “mass delusions” After six years of “monetary debasement,” also known as QE, central bankers are trapped.  Stimulus has “not lit the economy on fire,” except among assets that are held by those who have significant equity exposure: high end real estate, luxury goods, artwork and the like.


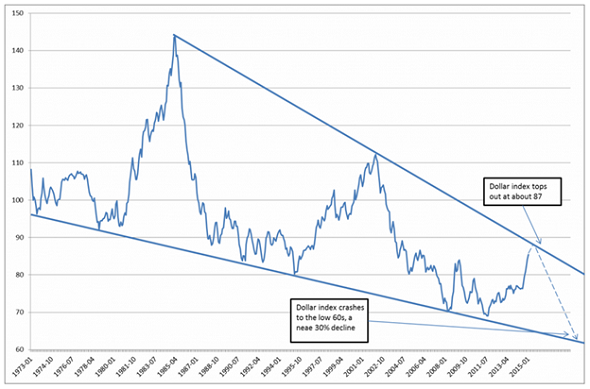
I couldn’t agree more. With that in mind, I don’t believe in the utter destruction of the dollar. If anything, I have been a dollar bull over the last 24 months. As evident here King Dollar.

The tide is now shifting. I have shown the chart below before. The dollar is approaching a powerful resistance line. Give today’s currency war, overall macro economic picture, significantly overvalued stock market, FED’s eventual rate hike reversal and possible additional QE,…….it is highly probable that the dollar is topping out and is getting ready to head lower. To test 2011 lows. Another overcrowded trade that is about to blow up.

dollar-chart

This conclusion is further supported by my mathematical and timing work. It clearly shows a severe bear market between 2014/15-2017. In fact, when it starts it will very quickly retrace most of the gains accrued over the last few years.  If you would be interested in learning when the bear market of 2014/15-2017 will start (to the day) and its internal composition, please CLICK HERE.

(***Please NoteA bear market might have started already, I am simply not disclosing this information. Due to my obligations to my Subscribers I am unable to provide you with more exact forecasts. In fact, I am being “Wishy Washy” at best with my FREE daily updates here. If you would be interested in exact forecasts, dates, times and precise daily coverage, please Click Here). Daily Stock Market Update. February 4th, 2015  InvestWithAlex.com

Did you enjoy this article? If so, please share our blog with your friends as we try to get traction. Gratitude!!!

Is King Dollar About To Die Google

What You Ought To Know About This Rally

Daily Chart February 3rd2/3/2015 – An up day with the Dow Jones up 305 points (+1.76%) and the Nasdaq up 51 points (1.09%).

Most people are scratching their heads while trying to figure out what had caused this massive 600+ point rally on the Dow over the last two days. ECB, FED, Oil, Greece, Australia, The Pope, etc…….no one knows. Well, except for my subscribers. This was posted in my weekly update on Saturday….

If February 3rd (+/- 1 trading day) at 17,050 TIME/PRICE point mentioned above is able to turn this market around, we might have a substantial advance.

If you are paying attention, the Dow bottomed at 17,038. Yet, the primary question remains. Is this yet another “dead cat bounce” or is this a “buying opportunity of a lifetime”. Please Click Here to find out.

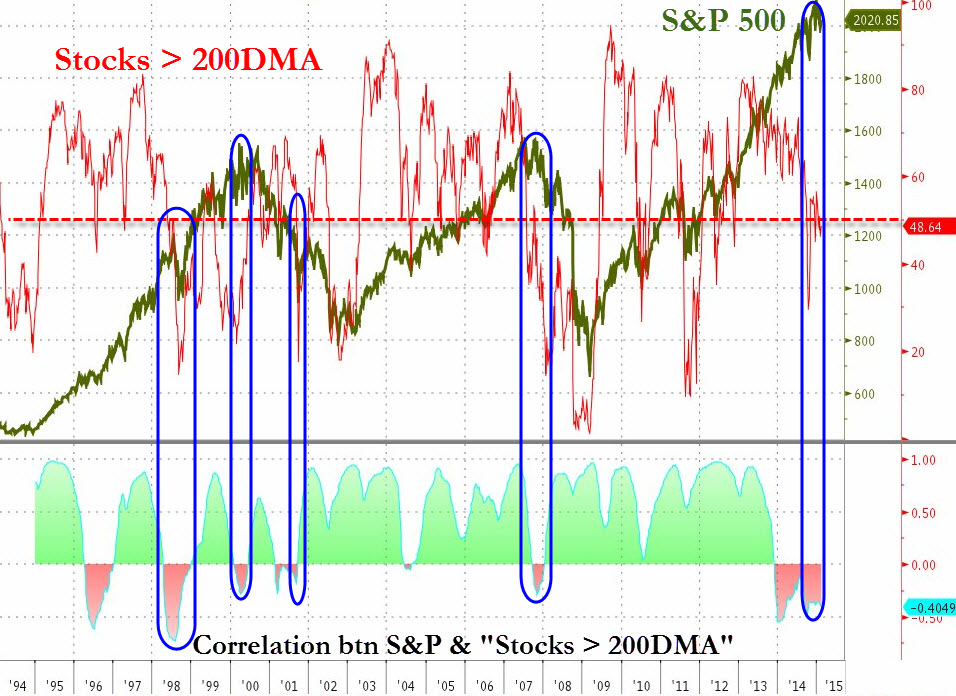
In the meantime and as per chart below, market internals continue to deteriorate. While one of many indicators flashing a red light, the chart below suggests that the overall market must eventually catch up to individual stocks below their 200 day moving average. Just as it did after 2000 and 2007 tops. That’s quite a drop from here.

market internals

This conclusion is further supported by my mathematical and timing work. It clearly shows a severe bear market between 2014/15-2017. In fact, when it starts it will very quickly retrace most of the gains accrued over the last few years.  If you would be interested in learning when the bear market of 2014/15-2017 will start (to the day) and its internal composition, please CLICK HERE.

(***Please Note: A bear market might have started already, I am simply not disclosing this information. Due to my obligations to my Subscribers I am unable to provide you with more exact forecasts. In fact, I am being “Wishy Washy” at best with my FREE daily updates here. If you would be interested in exact forecasts, dates, times and precise daily coverage, please Click Here). Daily Stock Market Update. February 3rd, 2015  InvestWithAlex.com

Did you enjoy this article? If so, please share our blog with your friends as we try to get traction. Gratitude!!!

What You Ought To Know About This Rally  Google

What You Ought To Know About January’s Sell-Off

Daily Chart Feb 2nd

2/2/2015 – An up day with the Dow Jones up 196 points (+1.14%) and the Nasdaq up 41 points (+0.89%). 

After our December 26th top call, the stock market continues to perform just as forecated. If you would like to find out what happens next, a bounce or a big sell-off, please Click Here. 

It is a well known Wall Street adage, “As goes the January so goes the rest of the year”. And while it didn’t work last year, 2015 might just do the trick. After all, it was a significant down month and the volatility is certainly back. Consider the following…..

So, should you be concerned? I believe so. Despite January’s tribulations and bad “omens”, the majority of investors out there remain overwhelmingly bullish. Despite recent evidence to the contrary they continue to believe that we are in a long-term secular bull market and that every dip should be bought.

As I have suggested here so many times before, nothing could be further from the truth. First, a secular bear market that started in 2000 will not complete until 2017. And at a much lower print. Second, the weaknesses we are seeing on multiple levels should not be dismissed as a “buying opportunity”. Finally, the volatility is back. And as I have said so many times before, it will drive both bulls and bears up the wall. January is a good example of what to expect over the next 2-3 years.

This conclusion is further supported by my mathematical and timing work. It clearly shows a severe bear market between 2014/15-2017. In fact, when it starts it will very quickly retrace most of the gains accrued over the last few years.  If you would be interested in learning when the bear market of 2014/15-2017 will start (to the day) and its internal composition, please CLICK HERE.

(***Please NoteA bear market might have started already, I am simply not disclosing this information. Due to my obligations to my Subscribers I am unable to provide you with more exact forecasts. In fact, I am being “Wishy Washy” at best with my FREE daily updates here. If you would be interested in exact forecasts, dates, times and precise daily coverage, please Click Here). Daily Stock Market Update. February 2nd, 2015  InvestWithAlex.com

Did you enjoy this article? If so, please share our blog with your friends as we try to get traction. Gratitude!!!

What You Ought To Know About January’s Sell-Off Google