InvestWithAlex.com 

Simple Cycles Analysis Predicts A Severe Bear Market of 2015-2017

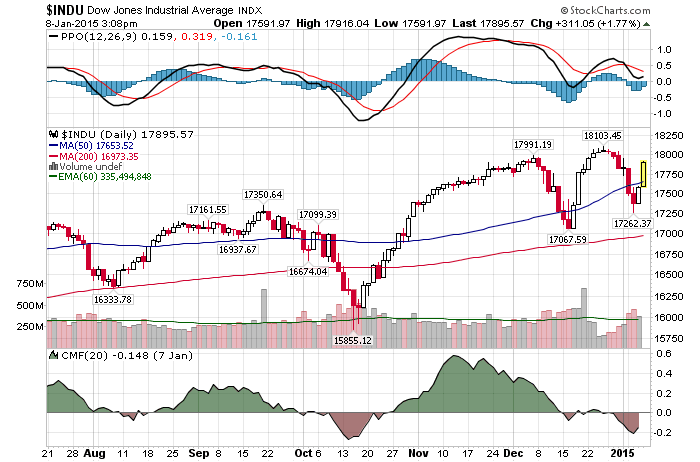
Daily Chart January 8th

1/8/2015 – A strong up day with the Dow Jones up 323 points (+1.84%) and the Nasdaq up 86 points (+1.84%) 

Below is a comprehensive longer-term review of the stock market and what the next few years holds. 

In the early January of 2000, the US Economy wa s booming. The Dow was fast approaching 11,800 and the Nasdaq was a stone throws away from its improbable benchmark of 5,000. Everyone was making a ton of money and as far as most people were concerned, the future looked very bright.  So much so, that very few people predicted a bear market of 2000-2002, let alone a secular 2000-2017 bear market that was about to begin.

The only way to do so was to know and to understand the cyclical TIME structure oscillating within the stock market.  For instance, an analyst working with such time cycles would know that the stock market’s 17-18 year cycle was topping out in conjunction with the 5 year cycle that started at 1994 bottom.  The bull market that started at the bottom in August of 1982 was coming to a conclusion. In fact, it would top out exactly 17.5 years after it had started or on January 14th, 2000 at 11,800. The 5 year cycle that started in December of 1994 would top out at exactly the same time; 5 years and 35 trading days after it had started.

What does this have to do with predicting a severe bear market of 2014/15-2017?

Everything.  Based on my work the stock market is a mathematically precise entity. And while there are hundreds of TIME cycles oscillating within the stock market at any one time, I will concentrate on only two to prove my point.  The 17-18 cycle and the 5 year cycles. We will look at these cycles over the last 100+ years and I will prove to you, without a shadow of a doubt, they work.

THE 17-18 YEAR CYCLE IN THE STOCK MARKET:
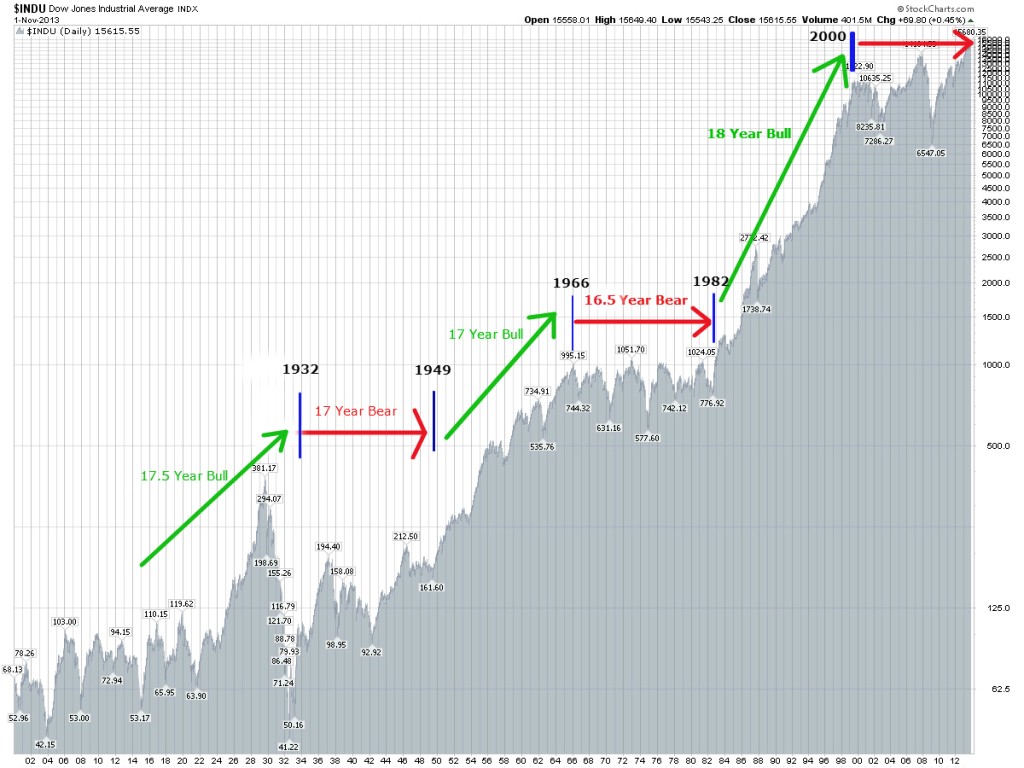
Long Term Dow Structure3

Long-term cycles within the stock market tend to oscillate going all the way back to the first day of trading, in May of 1790.  If you would be inclined, I would encourage you to verify that information for yourself. For our purposes we will start our analysis a little bit later or exactly 100 years ago. As the chart above indicates, the stock market tends to oscillate in clearly defined 17-18 year alternating Bull/Bear market cycles.

  • 17.5 Year Bull Market (1914 bottom to 1932 bottom): The previous bear market terminated in July of 1914. At that time the US stock market shut down for World War 1. The stock market remained closed between August of 1914 and December of 1914 (a very rare occurrence). When the market finally reopened in December of 1914 it immediately began a rally that would not terminate until October of 1929. Followed by a now famous 1929 stock market crash and a massive 90% 3 year decline. The cycle terminated at the bottom in 1932, completing the 17.5 year bull market cycle at that time.

*Note: It is important to address the 1929-1932 bear market and its impact on the overall 1914-1932 Bull Market cycle. It is a complex matter to discuss without sufficient background or understanding, but the final (short-term) structural composition of this Bull Cycle inverted over the last 3 years (1929-1932). Mostly due to a massive rally between 1924-1929 and a number of down cycles converging on this time period at the same time.  Regardless, the overall cycle lasted 17.5 years.

  • 17 Year BEAR Market (1932 bottom to 1949 bottom): The cycle originated at the bottom in July of 1932 and lasted until June of 1949. During this period of time we had a post great depression bounce, 1937 crash and World War 2. Yet, despite the overall upward trajectory, this clearly defined 1949 bottom remained 60% below its 1929 top and well below both its 1937 and 1942 tops.
  • 17 Year BULL Market (1949 bottom to 1966 top): The market surged higher between 1949 bottom and 1966 top. This was the so called “Golden Age” of post war reconstruction and the American industrial boom. During this time the Dow appreciated over 500% in a clearly defined bull market cycle.
  • 16.5 Year BEAR Market (1966 top to 1982 bottom): The market stayed relatively flat during this period of time with a few notable declines of 30-50%. With the 1972-1974 mid cycle decline of 54% being the largest one.  This clearly defined bear market completed in August of 1982. Approximately 25% below its 1966 top.
  • 17.5 Year BULL Market (1982 bottom to 2000 top): A very well known period and a clearly defined bull market. The market surged higher from its August of 1982 bottom to reach its historic top in January of 2000. During this time the Dow appreciated over 1,400% in one of the strongest bull markets in history.
  • 17 Year BEAR Market (2000 top to 2017 bottom): Even though the market is sitting near all time highs (as of this writing in January of 2014) and even though most people have assumed that the new bull market has started, in relative terms the market hasn’t appreciated very much since its top in 2000. The Nasdaq is still down. Plus, with the final down leg of this bear market being ahead of us (based on my mathematical and timing work), the BEAR market of 2000-2017 should complete itself in a negative territory or below its 2000 top.

It is important to note that the small variation (of +/- 1 year) in duration of these cycles is caused by smaller or larger cycles arriving at the same time. As such and based on the cycles above, we are no longer working in an arbitrary fashion when it comes to predicting the stock market.  In other words, if the stock market repeats a clearly defined 17-18 year Bull/Bear cycle over a 220 year period of time (since 1790) and does so without interruption,  it is safe to assume that the future is predictable and not random.

THE 5 YEAR CYCLE IN THE STOCK MARKET

One other easily identifiable cycle within the stock market is the 5 year cycle. These 5 year cycles represent one completed growth pattern or one completed Bull or Bear cycle. Typically, they tend to appear for 5 years, disappear and then reappear at a certain point in the future. While they are not sequential as the 17-18 year cycle above, once their place within the overall stock market is understood, they show up at exactly the right time.  For instance,

  • 1914 -1920: Bull Market
  • 1924-1929: Bull Market (followed by a 1929 crash)
  • 1932-1937: Bull Market (followed by a 1937 crash)
  • 1937-1942: Bear Market
  • 1966-1971: Bear Market
  • 1982-1987: Bull Market (followed by a 1987 crash)
  • 1994-2000: Bull Market (followed by a 2000 crash)
  • 2002-2007: Bull Market (followed by a 2007 crash)
  • 2009-2014: Bull Market

One thing to understand about these 5 Year cycles is that they are exact. They have much lower level variance as compared to their longer counterparts. Essentially, we are NOT talking about 5 years +/- 6 months. We are talking about 5 years +/- a few days. For instance, the 2002-2007cycle started on October 10th, 2002 (at 2002 bottom) and terminated on October 11th, 2007. If you are counting, that is exactly 5 Years and 1 day or scary accurate. I encourage you to study the other cycles outlined above in order to prove to yourself how shockingly accurate they all are.

 CONCLUSION: 

In summary, predicting a bear market of 2015-2017 is rather simple.  All 17-18 year bear cycles end with a 2-3 year bear market. For instance, 1912-1914, 1946-1949 and 1979-1982. And while most believe that the secular bear market ended at 2009 bottom, it is not the case. The secular bear market of 2000-2017 is still in effect and will terminate only when the year 2017 is reached. Although the final price bottom will be higher than the mid-cycle bottom reached in March of 2009.

Further, the 5-Year cycle that started on March 6th, 2009 bottom terminated on July 16th, 2014. Suggesting that the stock market is now ready to initiate its bear leg (despite recent higher highs). When I combine this cyclical analysis with the rest of my mathematical and timing work, the outcome is crystal clear. A severe bear market of 2015-2017 is just around the corner.

This conclusion is further supported by my mathematical and timing work. It clearly shows a severe bear market between 2014/15-2017. In fact, when it starts it will very quickly retrace most of the gains accrued over the last few years.  If you would be interested in learning when the bear market of 2014/15-2017 will start (to the day) and its internal composition, please CLICK HERE.

(***Please Note: A bear market might have started already, I am simply not disclosing this information. Due to my obligations to my Subscribers I am unable to provide you with more exact forecasts. In fact, I am being “Wishy Washy” at best with my FREE daily updates here. If you would be interested in exact forecasts, dates, times and precise daily coverage, please Click Here). Daily Stock Market Update. January 8th, 2015  InvestWithAlex.com

Did you enjoy this article? If so, please share our blog with your friends as we try to get traction. Gratitude!!!

Simple Cycles Analysis Predicts A Severe Bear Market of 2015-2017 Google

Why The FED Is Irrelevant

daily chart ADecember17A 2014

12/17/2014 – An up day with the Dow Jones up 288 points (+1.69%) and the Nasdaq up 96 points (+2.11%)

People tend to analyze and over analyze every word of the FED statement as if it was a new addition to the Old Testament. Trading aside, take a step back and consider the following when it comes to the FED.

First, the Fed is a reactionary force. Just like the rest of us, they “buy at the top and sell at the bottom”. Bernanke’s minutes in Q1 of 2008 that the enconomy was overheating is a clear indication of that. They cannot see market and economic turbulence if it hit them in the face.

Second, the FED wants “normalized” or higher interest rates as soon as possible. They clearly understand that they need to raise rates in time for the next recession. It has been close to 5 years since the last recession ended and they know the next one is not that far behind. Should they fail to raise rates, they will have very little ammunition (outside of another round of QE) to fight the next decline. That is to say, they will raise rates in 2015

Finally, when you put the facts above together you realize the FED will raise interest rates right into a bear market of 2014-2017. No matter what and just as they have done every single time in the past. Even though they shouldn’t.  With that in mind, right about now would be a good time to get out of the stock market.

This conclusion is further supported by my mathematical and timing work. It clearly shows a severe bear market between 2014-2017. In fact, when it starts it will very quickly retrace most of the gains accrued over the last few years.  If you would be interested in learning when the bear market of 2014-2017 will start (to the day) and its internal composition, please CLICK HERE

(***Please Note: Due to my obligations to my Subscribers I am unable to provide you with more exact forecasts. In fact, I am being “Wishy Washy” at best with my FREE daily updates here. If you would be interested in exact forecasts, dates, times and precise daily coverage, please Click Here). Daily Stock Market Update. December 18th, 2014 InvestWithAlex.com

Did you enjoy this article? If so, please share our blog with your friends as we try to get traction. Gratitude!!!

Why FED Is Irrelevant  Google

Subprime Short Bets Big Against Junk Bonds…..Should You Follow.

daily chart ADecember17 2014

12/16/2014 – Another down day with the Dow Jones down 112 points (-0.65%) and the Nasdaq down 57 points (-1.24%) 

Since about the start of this year I have maintained that when a bear market of 2014-2017 kicks in, a number of things will happen. Junk bonds will blow sky high, 10-Year Note will test 1.5% (double bottom) and the stock market will drift lower. Driving both bulls and bears up the wall in the process.

Joshua Birnbaum, the Ex-Goldman trader who correctly shorted subprime mortgages during the financial crisis tends to agree.

Joshua Birnbaum, the ex-Goldman Sachs Group Inc. trader who made bets against subprime mortgages during the financial crisis, now has more than $2 billion in wagers against high-yield bonds at his Tilden Park Capital Management LP hedge-fund firm, according to investor documents

high yield

I believe he is absolute right in his assessment. The situation is not that dissimilar from 2007-2009 period. Except, instead of “subprime” bubble we are currently going though a stock market overvaluation and junk debt bubble. There is just way too much risk in our financial system to warrant today’s valuation levels. Once the tide goes out, you will see junk yields surge. Counterparty risk associated with collapse of Russia (discussed earlier this morning) might get this party going.

This conclusion is further supported by my mathematical and timing work. It clearly shows a severe bear market between 2014-2017. In fact, when it starts it will very quickly retrace most of the gains accrued over the last few years.  If you would be interested in learning when the bear market of 2014-2017 will start (to the day) and its internal composition, please CLICK HERE

(***Please Note: Due to my obligations to my Subscribers I am unable to provide you with more exact forecasts. In fact, I am being “Wishy Washy” at best with my FREE daily updates here. If you would be interested in exact forecasts, dates, times and precise daily coverage, please Click Here). Daily Stock Market Update. December 16th, 2014 InvestWithAlex.com

Did you enjoy this article? If so, please share our blog with your friends as we try to get traction. Gratitude!!!

Subprime Short Bets Big Against Junk Bonds…..Should You Follow.  Google

Bill Gross: No Bond Liquidity. Is Another 2008 Credit Crunch Coming?

daily chart ADecember15 2014

12/15/2014 – Another down day with the Dow Jones down 101 points (-0.58%) and the Nasdaq down 48 points (-1.04%). 

The stock market continues to perform just as anticipated. Not only did InvestWithAlex timed/priced the exact top at 17,991 with appropriate positioning, we have a fairly good idea of what happens next Click Here to find out.

Now, when Bill Gross talks, particularly about the bond market, you better listen. Everyone is trying to squeeze through a very small door. Also, you if haven’t noticed the 10-Year Note continues to sell off and is now quickly approaching October lows. A huge red flag for the stock market considering today’s valuation levels.

“When levered money moves and tries to seek a safe haven, basically you have violent price movements,” Gross said, adding there is “very little liquidity” in the corporate bond markets, especially in high-yield debt. “Everyone is trying to squeeze through a very small door.”

I tend to agree with Bill, when the s&*# finally hits the fan you will see liquidity dry up overnight. Just as it did back in 2008. And that applies not only to the overall corporate bond market, but to the short-side and the stock market in particular. Don’t forget, we are at historic margin debt level highs and everyone is long “Apple”. In other words, when this stock market finally breaks, good luck finding anyone to buy your shares.

This conclusion is further supported by my mathematical and timing work. It clearly shows a severe bear market between 2014-2017. In fact, when it starts it will very quickly retrace most of the gains accrued over the last few years.  If you would be interested in learning when the bear market of 2014-2017 will start (to the day) and its internal composition, please CLICK HERE

(***Please Note: Due to my obligations to my Subscribers I am unable to provide you with more exact forecasts. In fact, I am being “Wishy Washy” at best with my FREE daily updates here. If you would be interested in exact forecasts, dates, times and precise daily coverage, please Click Here). Daily Stock Market Update. December 15th, 2014 InvestWithAlex.com

Did you enjoy this article? If so, please share our blog with your friends as we try to get traction. Gratitude!!!

Bill Gross: No Bond Liquidity. Is Another 2008 Credit Crunch Coming? Google

Wall Street: Dear Santa….Please Make This Market Rally

daily chart ADecember12 2014

12/12/2014 – Another big down day with the Dow Jones down 308 points (-1.75%) and the Nasdaq down 55 points (-1.16%)

The stock market continues to perform as anticipated. Please Click Here to learn what happens next. And while most of Wall Street anticipated a Santa Claus rally, here is what I told my PREMIUM subscribers on December 4th, 2014.  

“With that said, let’s take a closer look at our primary forecasting index, the Dow. As I have suggested over the last few days, my mathematical calculations show a strong point of force located at 18,000 (+/- 50 points). The exact hit would occur at 17,990. Today’s Intraday top of 17,940 was, once again, within the margin of error. It is my feeling that the Dow will push just a little bit higher, to get a more direct hit, before reversing down.”

If you are keeping track, the Dow topped out the following day (thus far) at 17,991. Just ONE point over my optimal target. The Dow is now 700 points lower. Yet, that is beside the point. What happens next is a lot more important.

That is why next week becomes crucial  for the stock market. As I discuss in my weekly update (to my Premium Subscribers), the stock market will either go though a strong bounce or sell off into a certain date in December.

In other words, while the Wall Street might be lucky enough to get their “Santa Rally” into the end of the year, they might also be decimated to the point where the Dow ends in the negative territory for the year. If you would like to find out exactly what happens and the exact DATE of this point next week, please Click Here. 

This conclusion is further supported by my mathematical and timing work. It clearly shows a severe bear market between 2014-2017. In fact, when it starts it will very quickly retrace most of the gains accrued over the last few years.  If you would be interested in learning when the bear market of 2014-2017 will start (to the day) and its internal composition, please CLICK HERE

(***Please Note: Due to my obligations to my Subscribers I am unable to provide you with more exact forecasts. In fact, I am being “Wishy Washy” at best with my FREE daily updates here. If you would be interested in exact forecasts, dates, times and precise daily coverage, please Click Here). Daily Stock Market Update. December 12th, 2014 InvestWithAlex.com

Did you enjoy this article? If so, please share our blog with your friends as we try to get traction. Gratitude!!!

Wall Street: Dear Santa….Please Make This Market Rally Google

Our Total Debt Cannot Possibly Be Repaid…Now What

daily chart ADecember11 2014

12/11/2014 – A positive day with the Dow Jones up 63 points (+0.36%) and the Nasdaq up  24 points (+0.52%). 

An important macro look at the state of total debt and its impact on our financial markets. It’s a quick read and I highly recommend it.  The World on the Verge of Another Financial Crisis.

Most people don’t comprehend that we are living in a protracted debt crisis with no possible solution, because the majority of money (about 98 per cent) in today’s economies in the U.S., the U.K., Canada and Europe is debt-money, primarily generated by private banks when they issue loans. The problem is that the sum total of these debts—which can never be repaid no matter how much the economy grows

I couldn’t agree more. The problem is, this debt has spread though every level and every sector of our economy. Including our financial markets. And there lies the problem. Over the last few decades this debt explosion has been used to propel our economy and markets higher. Unfortunately, the velocity of credit is now slowing down or non existent. With interest rates close to zero, there is very little the FED can do now. QE or not.

That means we are at a point of inflection. We either let this debt collapse and liquidate through a deflationary depression -OR- it will be inflated away. One thing is certain, whichever scenario plays out, it’s not going to be a pretty picture.

This conclusion is further supported by my mathematical and timing work. It clearly shows a severe bear market between 2014-2017. In fact, when it starts it will very quickly retrace most of the gains accrued over the last few years.  If you would be interested in learning when the bear market of 2014-2017 will start (to the day) and its internal composition, please CLICK HERE

(***Please Note: Due to my obligations to my Subscribers I am unable to provide you with more exact forecasts. In fact, I am being “Wishy Washy” at best with my FREE daily updates here. If you would be interested in exact forecasts, dates, times and precise daily coverage, please Click Here). Daily Stock Market Update. December 11th, 2014 InvestWithAlex.com

Did you enjoy this article? If so, please share our blog with your friends as we try to get traction. Gratitude!!!

Our Total Debt Cannot Possibly Be Repaid…Now What Google

How Much Lower Before Santa Claus Rally Hopefuls Begin Panic Selling?

daily chart ADecember10 2014

12/10/2016 – A big down day with the Dow Jones down 267 points  (-1.5%) and the Nasdaq down 82 points (-1.73%). 

If there was one uniform “TRUTH” sold by most of Wall Street throughout all of November and early December it was as follows…..”The Santa Claus rally is in the bag and most markets are likely to finish the year at or near all time highs”.

Perhaps. Yet, seasonality is not a fool proof measure. Sometimes it works and sometimes it backfires…..big time. For instance, Novembers are seasonally net negative and/or one of the worst months to hold stocks. Yet, November of 2014 proved to be net positive. More so, both the S&P and the Dow set multiple all time highs during the month. It is too much to expect that December will be a net negative, despite positive seasonality? I don’t think so.

Here is what I am driving at. As of today’s close the Dow is up YTD just 5.8%. How much lower do the markets have to go from today’s levels before hedge fund and mutual fund managers begin to dump everything in sight in an attempt to lock in annual gains. Any kind of gains to ensure that their 2014 is net positive.

Perhaps another 200 down points on the Dow….. maybe 400. Will there be a short-term panic? I think we are about to find out.

This conclusion is further supported by my mathematical and timing work. It clearly shows a severe bear market between 2014-2017. In fact, when it starts it will very quickly retrace most of the gains accrued over the last few years.  If you would be interested in learning when the bear market of 2014-2017 will start (to the day) and its internal composition, please CLICK HERE

(***Please Note: Due to my obligations to my Subscribers I am unable to provide you with more exact forecasts. In fact, I am being “Wishy Washy” at best with my FREE daily updates here. If you would be interested in exact forecasts, dates, times and precise daily coverage, please Click Here). Daily Stock Market Update. December 10th, 2014 InvestWithAlex.com

Did you enjoy this article? If so, please share our blog with your friends as we try to get traction. Gratitude!!!

How Much Lower Before Santa Claus Rally Hopefuls Begin Panic Selling? Google

Are We Dealing With A Fantasy Market?

daily chart ADecember9 2014

12/9/2014 – A mixed day with the Dow Jones down 52 points (-0.29%) and the Nasdaq up 26 points (+0.54%). 

Another superb MarketWatch article that I highly recommend.  Investors must believe in magic to buy stocks now

Most of the things discussed in the article match my overall view. Primarily, the fact that today’s stock market is priced beyond perfection and the fact that numerous technical/sentiment indicators are flashing a red light. So much so that I will explore this idea and show through valuation work (in about two weeks) that when adjusted for interest rates and QE, we are now at the highest valuation levels ever. Higher than 2000 and 2007 tops.

Of course, that doesn’t mean the stock market can’t push higher. It simply means that anyone who is investing for the long-term at this juncture is playing a very dangerous game of buying at the top.

This conclusion is further supported by my mathematical and timing work. It clearly shows a severe bear market between 2014-2017. In fact, when it starts it will very quickly retrace most of the gains accrued over the last few years.  If you would be interested in learning when the bear market of 2014-2017 will start (to the day) and its internal composition, please CLICK HERE

(***Please Note: Due to my obligations to my Subscribers I am unable to provide you with more exact forecasts. In fact, I am being “Wishy Washy” at best with my FREE daily updates here. If you would be interested in exact forecasts, dates, times and precise daily coverage, please Click Here). Daily Stock Market Update. December 9th, 2014 InvestWithAlex.com

Did you enjoy this article? If so, please share our blog with your friends as we try to get traction. Gratitude!!!

Are We Dealing With A Fantasy Market? Google

Junk Bonds Suggest A Market Sell-Off

daily chart ADecember 8 2014

12/8/2015 – A down day with the Dow Jones down 104 points (-0.58%) and the Nasdaq down 40 points (-0.84%). 

The market continues to perform as anticipated. If you would like to find out what happens next, please Click Here. Believe it or not, today’s marks the first “broad” negative day for the market since October 14th bottom. That’s quite an accomplishment.

With that said, most widely followed markets remains within a few clicks of their all time highs. And while that is certainly the case, the number of divergences AGAINST this market rally continue to pile up.  Perhaps the most important divergence can be witnessed in the Junk Debt market Here’s why some smart investors are worried

In short, while the S&P index continues to surge higher, the junk bond market is not buying it. Leading to a standoff that can only be resolved in one of two ways. Either the junk bounces and follows the market higher or the S&P is in for quite a correction.

junk bonds 3

Which way will we break? Well, with the S&P is pushing against a major resistance line and with the junk bond market approaching a point of technical breakdown, the market Gods are pointing their finger towards a major market correction.

This conclusion is further supported by my mathematical and timing work. It clearly shows a severe bear market between 2014-2017. In fact, when it starts it will very quickly retrace most of the gains accrued over the last few years.  If you would be interested in learning when the bear market of 2014-2017 will start (to the day) and its internal composition, please CLICK HERE

(***Please Note: Due to my obligations to my Subscribers I am unable to provide you with more exact forecasts. In fact, I am being “Wishy Washy” at best with my FREE daily updates here. If you would be interested in exact forecasts, dates, times and precise daily coverage, please Click Here). Daily Stock Market Update. December 8th, 2014 InvestWithAlex.com

Did you enjoy this article? If so, please share our blog with your friends as we try to get traction. Gratitude!!!

Junk Bonds Suggest A Market Sell-Off Google

Whispering Stock Market. Are You Listening?

daily chart ADecember5 2014

12/5/2014 – A positive day with the Dow Jones up 58 points (+0.33%) and the Nasdaq up 11 points (0.24%).  

A fairly good interview with Nouriel Roubini and I encourage you to take a look. As yours truly, Mr. Roubin believes that we are in a massive bubble. And while I agree with most of his views, one thing rubs me the wrong way. According to Nouriel, while we are in a massive bubble, it will not burst until 2016. Why 2016? Well, no real reason was provided and we might as well claim that this bubble will only burst in the year 2158 or tomorrow. Regardless, it is a good overall look at where we are today.

In the meantime, the yield curve continues to compress. Over the last few decades the yield curve has proven to be one of the best indicators of where we are headed. It is now signalling that a severe recession is just around the corner. And while the yield curve is a poor timing indicator, it works well when we combine it with today’s valuation levels. That  is to say, when the yield curve is compressing and you find stocks at historically high/extreme valuation levels, as they are today, it safe to assume that the market is topping out.

Yield Curve as of 2014 - Dec

This conclusion is further supported by my mathematical and timing work. It clearly shows a severe bear market between 2014-2017. In fact, when it starts it will very quickly retrace most of the gains accrued over the last few years.  If you would be interested in learning when the bear market of 2014-2017 will start (to the day) and its internal composition, please CLICK HERE

(***Please Note: Due to my obligations to my Subscribers I am unable to provide you with more exact forecasts. In fact, I am being “Wishy Washy” at best with my FREE daily updates here. If you would be interested in exact forecasts, dates, times and precise daily coverage, please Click Here). Daily Stock Market Update. December 5th, 2014 InvestWithAlex.com

Did you enjoy this article? If so, please share our blog with your friends as we try to get traction. Gratitude!!!

Whispering Stock Market. Are You Listening? Google