InvestWithAlex.com 

Should Investors Be Panicking Right About Now?

Daily Chart AJanuary 20 InvestWithAlex

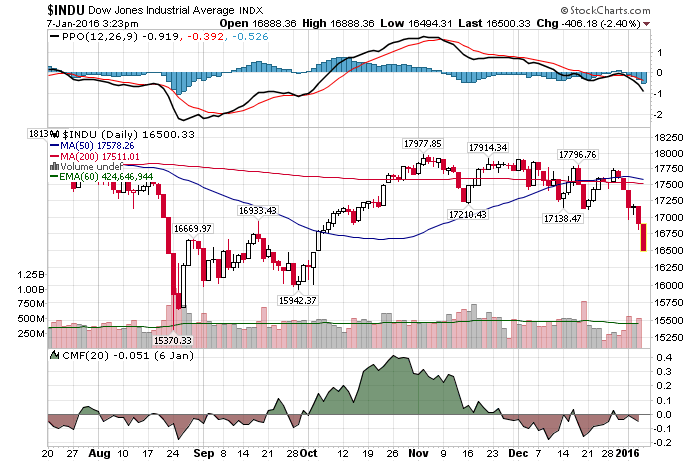
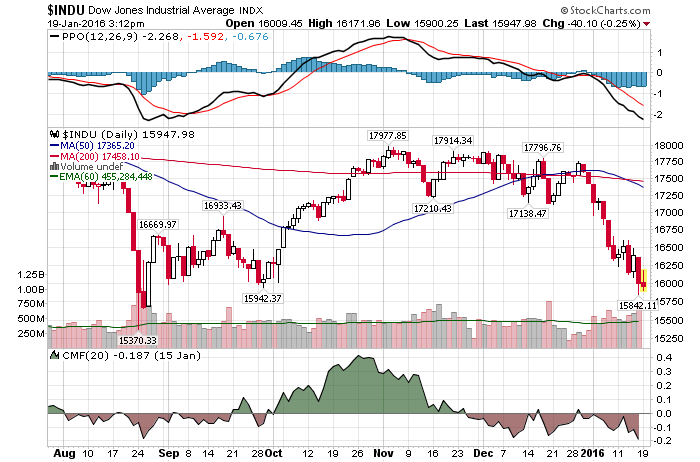
1/20/2016 – A negative day with the Dow Jones down 249 points (-1.55%) and the Nasdaq down 5 points (-0.12%) 

If you are keeping track, and not very many people are by this point, the Dow has lost 10% since the beginning of the year while the Nasdaq has lost 11%. And while most bulls were expecting a blow off rally to new highs just a few short-weeks ago, such dreams no longer exist in today’s market environment.

But investors must remember, financial markets don’t travel in straight lines. And given today’s extremely oversold conditions and technical indicators, some sort of a bounce is imminent. Or is it?

Let’s quickly look at two charts. First, today’s S&P…..s&p chart long-term

As you can see, it broke below an important technical support level earlier today. Quite by a considerable margin. Suggesting that the break was real.  Something similar had happened in 1987. At least structurally or sentiment wise.

s&p 1987Once the S&P broke below prior support in 1987, it proceeded to collapse in now infamous crash.

Are we dealing with something similar here and should investors be panicking right about now? 

Yes and no. Yes, in a sense that we are operating under very similar technical and sentiment conditions. As my earlier blog post suggested, investor sentiment has turned violently bearish. Plus, the market is heavily oversold, by most traditional measures. Again, similar conditions existed right before the 1987 crash.

At the same time, we are in a completely different cyclical environment. At least according to my mathematical and timing work. An environment that doesn’t necessarily call for a crash.

That is to say, while conditions for a crash certainly exist, it is just as likely that we will experience a monster short covering rally or a bounce.

So, which way will the market swing?

While our long-term forecast is crystal clear, short-term it is incredibly complex. But if you are still interested, please Click Here to find out.

This conclusion is further supported by my mathematical and timing work. It clearly shows a severe bear market between 2015-2017. In fact, when it starts it will very quickly retrace most of the gains accrued over the last few years.  If you would be interested in learning when the bear market of 2015-2017 will start (to the day) and its internal composition, please CLICK HERE.

(***Please Note: A bear market might have started already, I am simply not disclosing this information. Due to my obligations to my Subscribers I am unable to provide you with more exact forecasts. In fact, I am being “Wishy Washy” at best with my FREE daily updates here. If you would be interested in exact forecasts, dates, times and precise daily coverage, please Click Here). Daily Stock Market Update.January 20th, 2016  InvestWithAlex.com

Did you enjoy this article? If so, please share our blog with your friends as we try to get traction. Gratitude!!!

Should Investors Be Panicking Right About Now? Google

Is The FED To Blame For This Market Sell-Off?

Daily Chart AJanuary 19 InvestWithAlex

1/19/2016 – A mixed day with the Dow Jones up 28 points (+0.18%) and the Nasdaq down 11 points (-0.26%) 

In a sense, absolutely. Here is a fairly good summary of what is going on. This video is definitely worth a few minutes of your time. 

I would have to agree with Peter Schiff here. I have been saying the same thing for over a year now. The FED will be unable to raise interest rates in any meaningful way. A 25 bps raise we have seen so far is laughable. Yet, the 10%+ sell-off it has triggered is not. And while we are likely to get another bump at the next meeting, I am doubtful that they will raise again.

As a result of this FED induced disastrous bubble, we will see a number of important structural themes play out over the next few years as the FED blinks and attempts to flood the market with liquidity again.

  • The stock market will have a sizable sell-off into 2017 bottom. At least according to my mathematical and timing work. Click Here to learn more.
  • Interest rates…-10 Year Note should see a double bottom at around 1.4-1.5% over the next 2 years. 10-Year Note: All Systems Are A Go For A Double Bottom
  • The US Dollar should decline. Don’t forget, commercials have a substantial short position against the dollar.

Now, mind you, all of the above is counter to what most investors today expect or believe. That should not come as a surprise.

This conclusion is further supported by my mathematical and timing work. It clearly shows a severe bear market between 2015-2017. In fact, when it starts it will very quickly retrace most of the gains accrued over the last few years.  If you would be interested in learning when the bear market of 2015-2017 will start (to the day) and its internal composition, please CLICK HERE.

(***Please Note: A bear market might have started already, I am simply not disclosing this information. Due to my obligations to my Subscribers I am unable to provide you with more exact forecasts. In fact, I am being “Wishy Washy” at best with my FREE daily updates here. If you would be interested in exact forecasts, dates, times and precise daily coverage, please Click Here). Daily Stock Market Update.January 19th, 2016  InvestWithAlex.com

Did you enjoy this article? If so, please share our blog with your friends as we try to get traction. Gratitude!!!

Is The FED To Blame For This Market Sell-Off?  Google

A Bear Market Is Being Confirmed. Here Is What Happens Next

Daily Chart AJanuary 13 InvestWithAlex

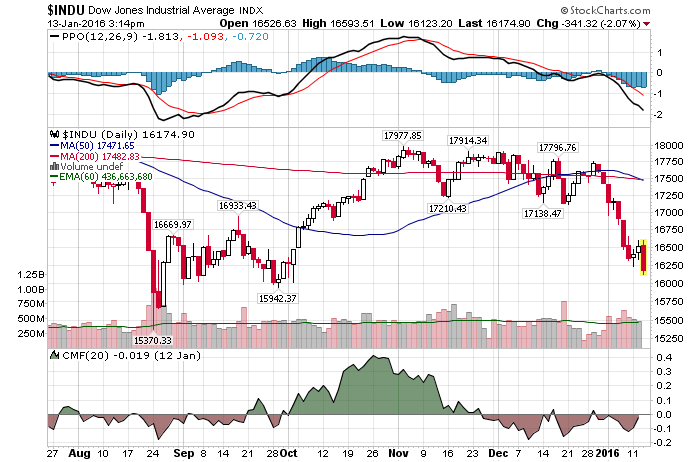
1/13/2016 – A negative day with the Dow Jones down 365 points (-2.21%) and the Nasdaq down 160 points (-3.61%) 

As the Dow Jones pushed into May 19th, 2015 Intraday high of 18,351 my subscribers knew that we were approaching an incredibly important long-term TIME/PRICE turning point. And while the clowns on CNBC were falling all over each other predicting the Dow 20K by the end of 2015, I was going 100% short. How We Nailed May 19th, 2015 Top -To The Day. A very difficult thing to do in an apparent “never ending bull market” cycle at the time.

And when the market staged a massive rally off of August 24th and September 29th lows, I have suggested that a number of charts or indices were not confirming this surge higher. Let’s take a look at some of these charts again and see what they are saying today.

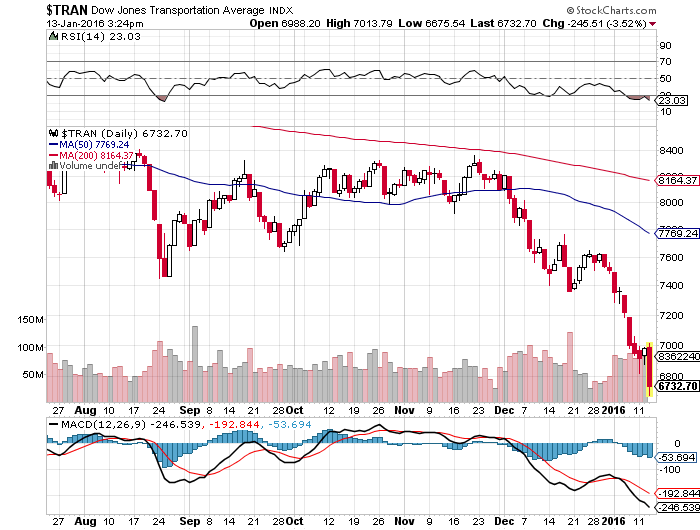
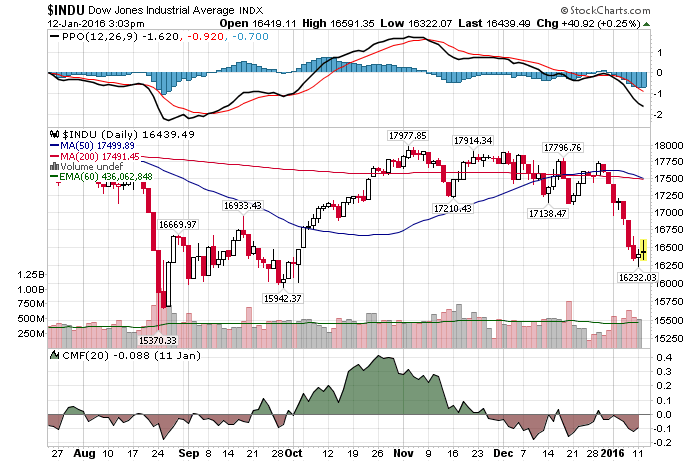
Dow Transports: Is now in a clear bear pattern. The index has failed to rally off of August 24th low. What’s more, it is now confirming the Dow Theory bear market reversal. As does the Dow Jones. In other words, the Dow Theory is now saying that we are in a bear market.

dow transports6

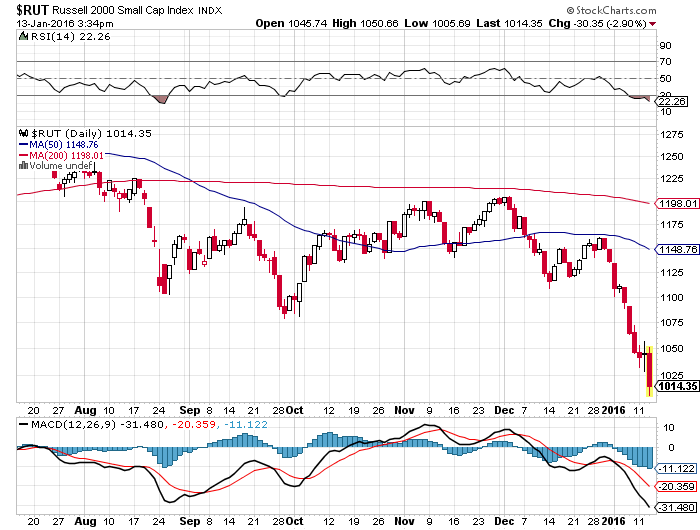
Biotech and Small Caps: Highly speculative Biotech Index (IBB) and small caps represented by the Russell 2000 failed to confirm the rally off of August 24th low. That was not a good sign. As I have suggested on numerous occasions on this blog over the last few months.

IBB Index

russell 2000 index

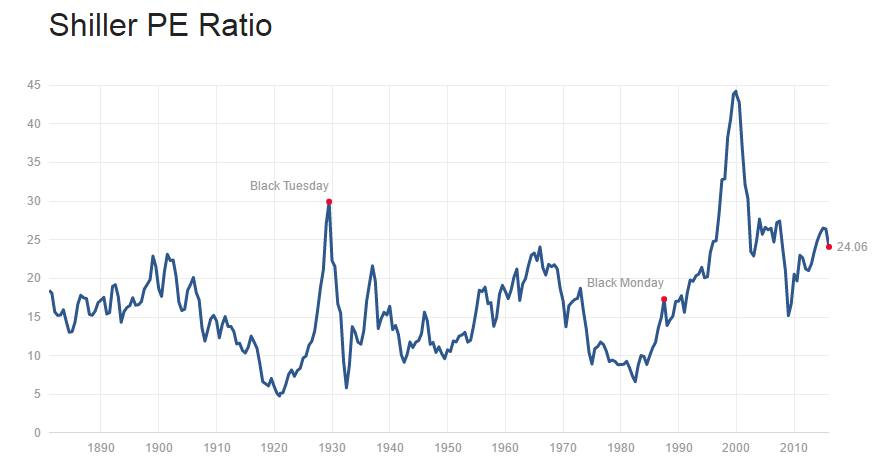
Shiller’s P/E Ratio: Hey, take a look at that. Despite the recent sell-off, the stock market is still massively overpriced. Now at 4th highest valuation level in its history. Right behind 1929, 2000 and 2007 tops. And that’s before a massive earnings slow down the US Corporates are about to experience.

shillers pe ratio

Charts don’t lie, unlike “CNBC experts”, and what they are saying is hard to swallow. Make no mistake, we will have quite a few short-covering rallies in the near future. Yet, the long-term tide might have shifted into something most investors are not prepared for. As the charts above suggest.

This conclusion is further supported by my mathematical and timing work. It clearly shows a severe bear market between 2015-2017. In fact, when it starts it will very quickly retrace most of the gains accrued over the last few years.  If you would be interested in learning when the bear market of 2015-2017 will start (to the day) and its internal composition, please CLICK HERE.

(***Please NoteA bear market might have started already, I am simply not disclosing this information. Due to my obligations to my Subscribers I am unable to provide you with more exact forecasts. In fact, I am being “Wishy Washy” at best with my FREE daily updates here. If you would be interested in exact forecasts, dates, times and precise daily coverage, please Click Here). Daily Stock Market Update.January 13th, 2016  InvestWithAlex.com

Did you enjoy this article? If so, please share our blog with your friends as we try to get traction. Gratitude!!!
Bear Market Is Being Confirmed. Here Is What Happens Next  Google

Jim Rogers: I Am Shorting US Markets & Junk

Daily Chart AJanuary 12 InvestWithAlex

1/12/2015 – A positive day with the Dow Jones up 118 points (+0.72%) and the Nasdaq up 48 points (+1.03%). 

When legendary money manager Jim Rogers speaks, you better pay attention. Or not, at your own detriment. I don’t think he can be any more clearer here and I found myself agreeing with most of the things he had to say. If you participate in financial markets, this 5 minute video below is a must watch.

This conclusion is further supported by my mathematical and timing work. It clearly shows a severe bear market between 2015-2017. In fact, when it starts it will very quickly retrace most of the gains accrued over the last few years.  If you would be interested in learning when the bear market of 2015-2017 will start (to the day) and its internal composition, please CLICK HERE.

(***Please Note: A bear market might have started already, I am simply not disclosing this information. Due to my obligations to my Subscribers I am unable to provide you with more exact forecasts. In fact, I am being “Wishy Washy” at best with my FREE daily updates here. If you would be interested in exact forecasts, dates, times and precise daily coverage, please Click Here). Daily Stock Market Update.January 12th, 2016  InvestWithAlex.com

Did you enjoy this article? If so, please share our blog with your friends as we try to get traction. Gratitude!!!
Jim Rogers: I Am Shorting US Markets & Junk  Google

Is It Time To Buy Russia (RSX)?

Daily Chart AJanuary 11 InvestWithAlex

1/11/2015 – A mixed day with the Dow Jones up 52 points (+0.32%) and the Nasdaq down 6 points (-0.12%)

While the US stock market is massively overpriced, Russian market is being sold at give away valuations. Here is another way to look at it, the capitalization of the entire Russian Stock Market is equal to that of Apple (AAPL). Both are at around $540 Billion.

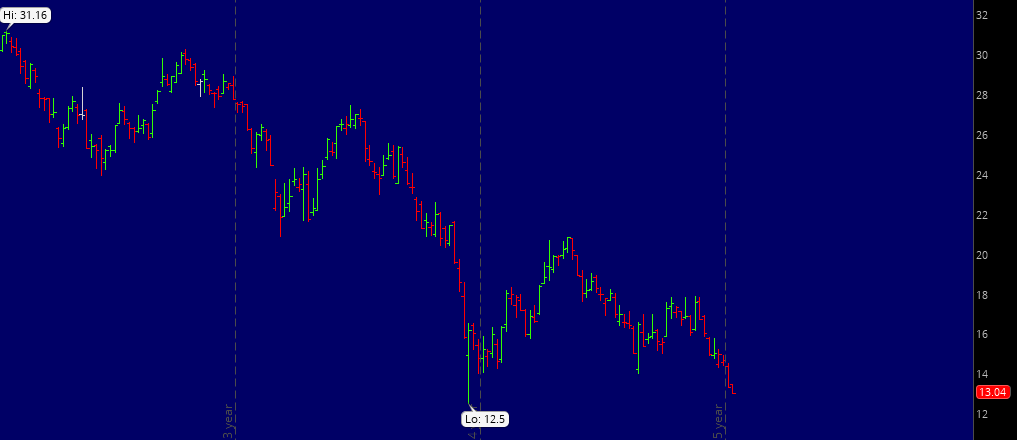
I continue to maintain that Russia is the most undervalued market in the world. Let’s take a closer look at their 3 year chart – represented by (RSX)

Russia - RSX - InvestWithAlex

A number of things become immediately apparent.

  1. RSX remains in a clear long-term technical downtrend. There is nothing to suggest that the market has shifted gears into a bull leg.
  2. RSX might be putting in an important double bottom. And if this double bottom holds, RSX might soon start its Bull Market.
  3. The RTS collapsed 75% during the financial crisis and the bear market of 2007-09. Our mathematical and timing work indicates that the US will have a severe bear market between 2015-2017. If so, Russian market is likely to continue with its downtrend. 

Which interpretation is correct? 

It is too soon to tell. Yet, if you are long-term investor (3-10 years) I believe Russia represents an amazing buying opportunity. On valuation basis alone. It can’t go to zero and sooner or later this market will recover.  And considering today’s valuation levels any such recovery will be spectacular. Most likely at 10X or more.

Further and if I may, I would like to suggest a possible trigger point for the Russian bull market to start. Last week I wrote Endgame In Sight: Putin Declares War On Saudi Arabia. Will The US Respond?

If Mr.Putin is able to bring “The House of Saud” down, plunging Saudi Arabia into the chaos it deserves, the price of oil should immediately recover. Stabilizing the Russian Economy and giving RSX the pretext it needs to start a multi-year rally.

For now, it might be a little too early to invest in the Russian market. However, this investment opportunity should definitely be on your radar screen. Even in your portfolio if you are a long-term investor.

Fun fact: the Russian market is still up 2,600% from its 1998 crisis bottom.

This conclusion is further supported by my mathematical and timing work. It clearly shows a severe bear market between 2015-2017. In fact, when it starts it will very quickly retrace most of the gains accrued over the last few years.  If you would be interested in learning when the bear market of 2015-2017 will start (to the day) and its internal composition, please CLICK HERE.

(***Please Note: A bear market might have started already, I am simply not disclosing this information. Due to my obligations to my Subscribers I am unable to provide you with more exact forecasts. In fact, I am being “Wishy Washy” at best with my FREE daily updates here. If you would be interested in exact forecasts, dates, times and precise daily coverage, please Click Here). Daily Stock Market Update.January 11th, 2016  InvestWithAlex.com

Did you enjoy this article? If so, please share our blog with your friends as we try to get traction. Gratitude!!!
Google

Icahn, Soros, Rogers, Faber, Druckenmiller All Warned…..No One Paid Attention

Daily Chart AJanuary 7 InvestWithAlex

1/7/2016 – Another big down day with the Dow Jones down 392 points (-2.32%) and the Nasdaq down 146 points (-3.03%) 

Over the last few months I have consistently shared with you a view held by some of the best money managers in the world. A view that I very much agree with. Unfortunately, most investors have tuned them out. Just as they did at 2000 and 2007 tops. It might be time to revisit that view one more time.

What do Carl Icahn, Marc Faber and Stanley Druckenmiller have in common? The were all dead on in terms of predicting 2000 and 2007 disasters. Here is what they have to say today.

Carl Icahn warns of a Fed ‘minefield’ ahead

“There are going to be real problems. We’re walking into a minefield of what’s going on with the Fed,” Icahn said. “I could go on and on here, but I think we have problems.”

Druckenmiller: Here’s how Fed ‘bubble’ will end

“All you do when you’re doing this is you’re pulling demand forward to today,” Druckenmiller said Tuesday at the annual DealBook conference. “This is not some permanent boost you get. You’re borrowing from the future. I think there’s been such a misallocation of resources that this has gone on so long and unnecessarily (and) the chickens will come home to roost.”

Dr. Doom calls bubble, adding to gloomy calls

“The Fed has basically created with their colleagues in Japan and at the European Central Bank (ECB) and the Bank of England (BOE), they’ve created a colossal asset bubble. And the returns going forward will be disappointing.”

The question you have to ask yourself as an investor is……Have these successful money managers lost their minds -OR- maybe, just maybe, they are once again seeing things that other investors do not. Things that will lead to an outright bloodbath in stocks in not so distant future. Read all of the above links and decide for yourself.

Now, Soros Fund has a large short position. Just a few weeks ago, Jim Rogers said the following Jim Rogers: Major Correction Ahead…Central Banks To Panic. Now, Carl Icahn is warning people that we are once again at 2000 and 2007 tops.

“What is better…..making 1-2% or losing 30% as people did in 2008? Right now is extremely dangerous.”

Forget about my line of thinking here for a second. Who else do you need to tell you that we are in a massive bubble and that a big correction is coming. Warren Buffett? Actually,WSJ ‘Buffett Indicator’ Flashes Warning for Stocks

Anyway, if you are sick and tired of your typical Wall Street analysis…… “We are in the early stages of a secular bull market and right now is a buying opportunity of a lifetime”, do yourself a favor and watch the videos below.

This conclusion is further supported by my mathematical and timing work. It clearly shows a severe bear market between 2015-2017. In fact, when it starts it will very quickly retrace most of the gains accrued over the last few years.  If you would be interested in learning when the bear market of 2015-2017 will start (to the day) and its internal composition, please CLICK HERE.

(***Please Note: A bear market might have started already, I am simply not disclosing this information. Due to my obligations to my Subscribers I am unable to provide you with more exact forecasts. In fact, I am being “Wishy Washy” at best with my FREE daily updates here. If you would be interested in exact forecasts, dates, times and precise daily coverage, please Click Here). Daily Stock Market Update.January 7th, 2016  InvestWithAlex.com

Did you enjoy this article? If so, please share our blog with your friends as we try to get traction. Gratitude!!!
Is The Stock Market Finally Waking Up To A Nightmarish Reality???

Daily Chart AJanuary 6 InvestWithAlex

1/6/2015 – Another down day with the Dow Jones down 252 points (-1.47%) and the Nasdaq down 56 points (-1.14%). 

It is popular to drag a bear on a TV show in order to explain recent market declines. As is the case with Marc Faber today. He has been appearing on most major networks over the last few days. Marc Faber: We Have Colossal Credit Bubble in China

  • Bernanke/Yellen will go down in history as colossal failures for waiting too long. It is too late now.
  • We are already in a severe global recession.
  • The stock market likely topped out in May of 2015. 20-40% drop is likely.
  • Massive disconnect between economic reality and bubble level valuations.

I couldn’t agree more with Marc’s view. I have been saying the exact same thing for close to a year now. In terms of the market, be careful. Just because the wheels are finally coming off doesn’t mean we can’t have a rally/bounce. Take a look at the video below (and the link above). It is definitely worth a few minutes of your time.  His view is my own.

This conclusion is further supported by my mathematical and timing work. It clearly shows a severe bear market between 2015-2017. In fact, when it starts it will very quickly retrace most of the gains accrued over the last few years.  If you would be interested in learning when the bear market of 2015-2017 will start (to the day) and its internal composition, please CLICK HERE.

(***Please NoteA bear market might have started already, I am simply not disclosing this information. Due to my obligations to my Subscribers I am unable to provide you with more exact forecasts. In fact, I am being “Wishy Washy” at best with my FREE daily updates here. If you would be interested in exact forecasts, dates, times and precise daily coverage, please Click Here). Daily Stock Market Update.January 6th, 2016  InvestWithAlex.com

Did you enjoy this article? If so, please share our blog with your friends as we try to get traction. Gratitude!!!
Is The Stock Market Finally Waking Up To A Nightmarish Reality??? Google

Are We Still In A Bull Market?

Daily Chart AJanuary 5 InvestWithAlex

1/5/2015 – A mixed day with the Dow Jones up 10 points (+0.06%) and the Nasdaq down 12 points (-0.24%) 

Until the recent “China driven” sell-off, mainstream financial media was bursting at the seams with all sorts of bullish articles. Here is one of them.

“It’s not old age, it’s excesses. And we’re not seeing excesses, we’re not overspending, we’re not over buying, we’re not over borrowing, we’re not over leveraged, and we’re not overvalued,” added White on why the bull market will not die in 2016.

I strongly disagree with all of the above, but let’s save it for another time. Basically the bulls are playing the game of musical chairs by expecting a clear blow off top at even more ridiculous valuation levels. Yet, no one is asking the most important question.

What if the music is no longer playing?

I remember shorting stocks into May 19th, 2015 top on the Dow/S&P.  Let me assure you, it sure the hell felt like a blow off top to me. Not that much dissimilar from 2000 and 2007 tops. You couldn’t find a bear if your life depended on it (except yours truly). Even prominent bears like Marc Faber and Peter Schiff were throwing in the towel. And when the Nasdaq was putting in a top on July 20th, I posted the following sentiment picture on this blog.

investment grin of the day 73 investwithaelx

So, let me ask you again, is it possible that most bulls are waiting for a top that has already arrived?

That is exactly what I discuss in my last weekly update to my premium subscribers Click Here. And as you can very well understand, the right answer can make all the difference between being trapped in another massive leg down or moving harmoniously with the overall market.

This conclusion is further supported by my mathematical and timing work. It clearly shows a severe bear market between 2015-2017. In fact, when it starts it will very quickly retrace most of the gains accrued over the last few years.  If you would be interested in learning when the bear market of 2015-2017 will start (to the day) and its internal composition, please CLICK HERE.

(***Please Note: A bear market might have started already, I am simply not disclosing this information. Due to my obligations to mSubscribers I am unable to provide you with more exact forecasts. In fact, I am being “Wishy Washy” at best with my FREE daily updates here. If you would be interested in exact forecasts, dates, times and precise daily coverage, please Click Here). Daily Stock Market Update.January 5th, 2016  InvestWithAlex.com

Did you enjoy this article? If so, please share our blog with your friends as we try to get traction. Gratitude!!!
Are We Still In A Bull Market? Google

Someone Is Spectacularly Wrong….But Who?

Daily Chart ANovember 17 InvestWithAlex

11/17/2015 – A positive day with the Dow Jones up 6 points (+0.03%) and the Nasdaq up 1 point (+0.03%) 

Today, you can easily find very smart people on both sides of the market. And while some suggest that a new secular bull market is just starting up, others see nothing but trouble ahead. Let’s explore.

“We’re actually kind of early or still maybe in the middle innings of a bull market, and we’re not near the end as many think,” she said. Where we think investors want to go now are dividend growth stocks,” she said. “These are companies that might not have the highest yields around, but they have the best potential to grow their yields.”

Well, that’s kind of exciting….isn’t it?  According to both analysts the stock market is about to surge higher. And while one suggests a bull market will continue for many years to come, the other implies it will terminate soon, but only after a blow off top is put in place.

In other words, load up on call options.

I am just a little confused as to why it would start now if this bull leg initiated at 2009 bottom. Also, I find it curious that everyone is awaiting some sort of a blow off top. First, the market rarely repeats itself and/or gives investors what they want. And second, couldn’t we all be friends and consider May 19th top on the S&P/Dow and June 20th on the Nasdaq as blow off tops? I was there and they definitely felt like “blow off” tops to me. At least at the time and if you were shorting the market. On the flip side……

I would encourage you to check out the last article. It has quite a bit more substance than your average “buy the dip, asset allocation, bull market never ends, etc…” nonsense.

Given two widely different view points from equally intelligent people, who is right? 

I think we have to concentrate on the fundamentals to ascertain what happens next. Here is all you need to know.

  • Shiller’s S&P P/E Ratio is at 26. Third highest level in history. Right behind 1929 and 2000 tops. That measure alone suggests we are in a massive bubble.
  • Forward guidance in Q-3 was down 2%. Biggest drop since 2008. That suggests economic and earnings slowdown. Something I have covered here extensively.
  • Multiple technical patterns suggest the market is ready for another bear leg. For instance, the NYSE (largest index by capitalization) has been in distribution for 1.5 years.
  • Etc..

Point being, I don’t think one has to be a genius to figure out what happens next.

This conclusion is further supported by my mathematical and timing work. It clearly shows a severe bear market between 2015-2017. In fact, when it starts it will very quickly retrace most of the gains accrued over the last few years.  If you would be interested in learning when the bear market of 2015-2017 will start (to the day) and its internal composition, please CLICK HERE.

(***Please NoteA bear market might have started already, I am simply not disclosing this information. Due to my obligations to my Subscribers I am unable to provide you with more exact forecasts. In fact, I am being “Wishy Washy” at best with my FREE daily updates here. If you would be interested in exact forecasts, dates, times and precise daily coverage, please Click Here). Daily Stock Market Update. Noveber 17th, 2015  InvestWithAlex.com

Did you enjoy this article? If so, please share our blog with your friends as we try to get traction. Gratitude!!!
Someone Is Spectacularly Wrong Google

COT Reports & Weekly Market Calendar – November 16th, 2015

Daily Chart ANovember 16 InvestWithAlex

11/16/2015 – A positive day with the Dow Jones up 238 points (+1.37%) and the Nasdaq up 56 points (+1.15%) 

COT Reports: If you are not familiar, the Commitments of Traders (COT) reports provide a breakdown of each Tuesday’s open interest for markets in which 20 or more traders hold positions. In other words, it gives us a preview of what commercial interests are buying or selling. As the theory goes, we want to be on the same side of the trade as the big guys.

While not a good timing tool, currencies, commodities and the stock market (to a lesser extent) tend to move in the direction of the bets made by the commercial players. Not always, but often enough.

Latest data, as of November 11th, 2015

Currencies: 

  • USD:  3K Long Vs. 58K Short – No changes. Substantial short interest remains.
  • Canadian Dollar: 43K Long Vs. 14K Short – Slight decrease in short interest. Significant long interest remains.
  • British Pound: 76K Long Vs. 6K Short – Slight decrease in net short interest. British pound remains bullish.
  • Japanese Yen: 135K Long Vs. 6K Short – Slight increase in net long exposure. Japanese Yen is now very bullish.
  • Euro: 127K Long Vs. 30K Short – Slight decrease in net short exposure. Euro is now bullish.
  • Australian Dollar: 115K Long Vs. 3K Short – Slight increase in net long exposure. Significant long position remains.

Conclusion: Based on the information above, commercial interests expect the US Dollar to decline while Canadian Dollar, British Pound, Euro Japanese Yen and Australian Dollar rally. This is consistent with our view that the FED won’t raise rates. 

Markets/Commodities/Volatility: 

  • E-Mini S&P 500: 529K Long Vs. 377K Short – Net neutral position remains.
  • Nasdaq 100-Mini: 26K Long Vs. 220K Short – Sizable short position. Slight increase in net short position.
  • VIX: 58K Long Vs. 64K Short – Slight decrease in net short exposure. Neutral
  • Gold: 62 Long Vs. 64K Short – Descrease in net short exposure. Gold is back to being neutral.

Conclusion: Based on the information above, commercial interests are now net neutral the S&P, VIX and gold. We have also witnessed a decline in net short exposure in VIX. At the same time, commercials now have a very large short position on the Nasdaq. That is important. 

Next Week’s Market Calendar: 

  • Q-3 Earnings
  • Tuesday: CPI Index
  • Wednesday: FOMC Minutes

Z30

COT Reports & Weekly Market Calendar – November 16th, 2015 Google