InvestWithAlex.com 

Earnings Excuse Galore

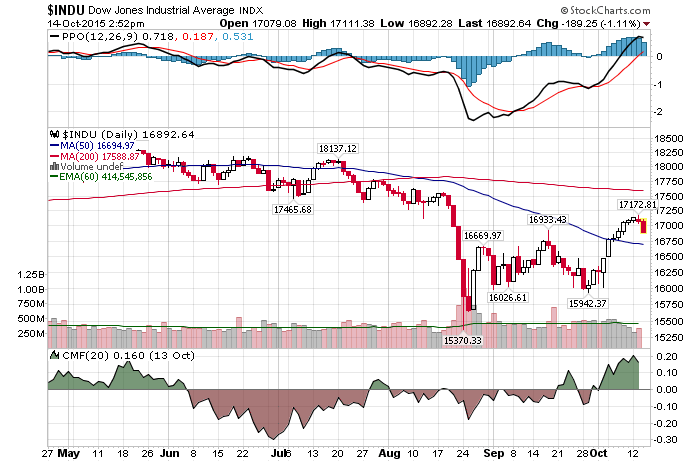
Daily Chart October 14 InvestWithAlex

10/14/2015 – A negative day with the Dow Jones down 158 points (-0.92%) and the Nasdaq down 14 points (-0.29%) 

What will your favorite company blame for its earnings shortfall?

There are so many good choices. Interest rates, strong dollar, Mr. Putin, higher labor and insurance costs, slowing economy, slow down in share buybacks, inability to push accounting principals any further, etc…

As was indicated earlier, Q-3 earnings season is not off to a good start. And while Apple may sell a zillion iPhones, destroying the next generation of young narcissists in the process, few other companies can match their popularity at the present moment.

Just earlier today WalMart slashed forward earnings guidance, blaming wage hikes and all sort of other nonsense for their shortcomings. Thus far, Mr. Market has rewarded WalMart with a 10% beating.

Listen, the reality is a little bit different. I think a high percentage of companies will guide lower or miss earnings.  Now that that the QE and zero interest rates have worked their way though our financial system, the US Economy is rolling over into a severe recession. And there is nothing anyone can do to stop it. Given today’s overvaluation levels, that is not a good sign for the overall stock market.

But hey, what do I know....Bill Miller: Now is perfect time to buy US stocks

“But we also want people to take money out of stocks because they hate them, so they’re cheap,” he said in a ” Squawk Box ” interview. “That’s exactly the environment we have today.”

I especially love it when they all laugh at 1% treasury yields, followed by an always convenient, “Where else are you going to put your money?”

What these Bozos don’t get, as both Carl Icahn and I have outlined a number of times before……it is a hell of a lot better to earn 1% than to take a 30-50% haircut on your capital. Just as people found out 2000-2002 and then again in 2007-2009. I guess some people never learn.

This conclusion is further supported by my mathematical and timing work. It clearly shows a severe bear market between 2015-2017. In fact, when it starts it will very quickly retrace most of the gains accrued over the last few years.  If you would be interested in learning when the bear market of 2015-2017 will start (to the day) and its internal composition, please CLICK HERE.

(***Please NoteA bear market might have started already, I am simply not disclosing this information. Due to my obligations to my Subscribers I am unable to provide you with more exact forecasts. In fact, I am being “Wishy Washy” at best with my FREE daily updates here. If you would be interested in exact forecasts, dates, times and precise daily coverage, please Click Here). Daily Stock Market Update. October 14th, 2015  InvestWithAlex.com

Did you enjoy this article? If so, please share our blog with your friends as we try to get traction. Gratitude!!!

Earnings Excuse Galore Google

Will The Next Leg Down Be Contained By Emerging Markets & Commodities?

Daily Chart October 13 InvestWithAlex

10/13/2015 – A down day with the Dow Jones down 50 points (-0.30%) and the Nasdaq down 42 points (-0.87%) 

As you very well know, commodities and emerging markets have really taken a beating over the last few years. One can even argue that countries like Brazil and Russia are selling at give away valuations. And to a certain extent they are.

But that’s not the issue here. This is GOLDMAN: Welcome to the ‘3rd wave’ of the financial crisis

In the article above Goldman Sachs implies that we are currently going through a 3rd financial correction, but this correction will be mostly confined to emerging markets and commodities. Hence, not much impact will be felt in our capital markets.

I tend to disagree with their assessment, but not for the reason you might think. Yes, we can talk about the fundamentals, just how overpriced the stock market is and that we are in a bubble. We all know that.

The reason I don’t believe the “3rd wave down” will be contained has to do with my cyclical analysis and today’s market structure.

If I had to compare today’s stock market to any other period, in terms of its cyclical composition, it would have to be either 1899-1914 or 1966-1982 bear markets. These periods match our current market conditions nearly perfectly.

Take 2007-2009 mid cycle panic for instance (7-9 years in – half point). We have witnessed identical moves in 1907-1908 and 1972-1974. Their respective half-way points.

Here is what I driving at. We are still in a secular bear market that will only terminate in 2017. The problem is, all secular bear markets tend to end in fairly steep 2-3 year bear markets. And while we are unlikely to see 2009 lows, the US Equity markets won’t be able to escape this financial correction. No way and no matter what Goldman believes.

This conclusion is further supported by my mathematical and timing work. It clearly shows a severe bear market between 2015-2017. In fact, when it starts it will very quickly retrace most of the gains accrued over the last few years.  If you would be interested in learning when the bear market of 2015-2017 will start (to the day) and its internal composition, please CLICK HERE.

(***Please NoteA bear market might have started already, I am simply not disclosing this information. Due to my obligations to my Subscribers I am unable to provide you with more exact forecasts. In fact, I am being “Wishy Washy” at best with my FREE daily updates here. If you would be interested in exact forecasts, dates, times and precise daily coverage, please Click Here). Daily Stock Market Update. October 13th, 2015  InvestWithAlex.com

Did you enjoy this article? If so, please share our blog with your friends as we try to get traction. Gratitude!!!

Will The Next Leg Down Be Contained By Emerging Markets & Commodities?  Google

Is A Bull Trap Now In Place?

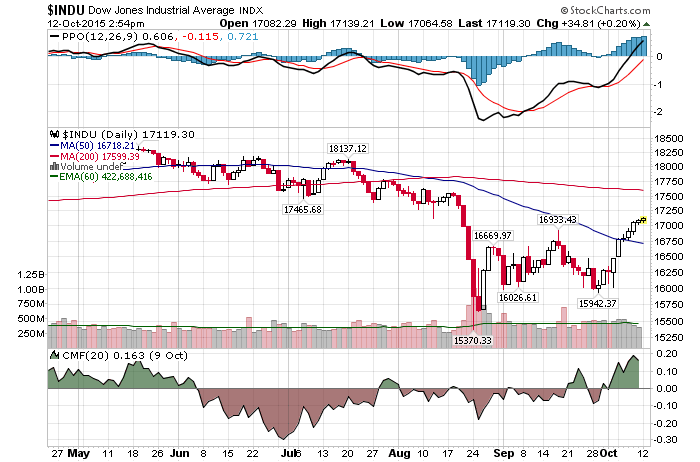
Daily Chart October 12 InvestWithAlex

10/12/2015 – A positive day with the Dow Jones up 48 points (+0.28%) and the Nasdaq up 8 points (+0.17%) 

That depends on whom you ask. As far as I can tell there are two primary views out there. First, the stock market just had a correction, not that dissimilar to what had happened in 2011, and we are now primed to go higher. Much higher, as a secular bull market is just getting started.

The other side of the coin suggests that the market is now shifting into what could be a massive leg down. That entails the market is not yet done with a secular bear market that started in 2000.

Who is right? 

That is exactly what this very important article discusses The Stock Market Is Poised for a Huge Selloff — Don’t Be Fooled by the Recent Rally

Let’s take a closer look. My comments are in green, but I encourage you to read it in full.

1. History tells us that 5%-8% rallies in five to eight days, like the one we’ve just seen, are about three times more common during bear markets.

Exactly. These moves are designed to deliver the maximum amount of pain to the shorts, while bulls tend to declare a reversal and a “new” bull market. 

2. The sharpest rises on record are often bear bounces to lower highs, which define a bear market: lower highs and lower lows!

This has been the case thus far.

3. Bull markets take money from bears and give it to bulls, while bear markets take money from bulls and bears.

How true. It is incredibly hard to pass through these monster short-covering rallies and/or bounces. Most shorts can’t handle it and get out right at the bounce top. That is why most investors would be better off with a longer-term short approach. 

4. Bulls markets begin slowly, with melt-ups coming in the middle, as investors seek pleasure from prices that have already been rising. The final rally comes on weaker breadth, lighter volume and waning momentum, as cash and margin are already fully deployed, and the crowd assumes it’s different this time, continuing to buy without regard for potential pain.

That was, indeed, the case in the first half of 2015. 

5. Bear markets end in meltdowns, as investors attempt to avoid pain from prices that have already been falling. The final crash arrives after the meltdown is nearly over, as some news items arrive that the selling can be blamed upon.

Very true. Either that or a very long base building process. With that in mind, consider August 24th bottom. It was far from a typical wash out “bottom”. First, it was untradable. Second, most bulls didn’t even care or pay attention. 

6. When the market struggles to reach back above previously broken 50- and/or 200- day moving averages, that’s a warning of exhaustion.

Indeed. 

7. Bulls markets create arrogance. Novice investors believe they are smarter than industry professionals. Retail investors generally buy stocks they know and like if those stocks are already rising, betting that there will always be a “greater fool” willing to pay an even higher price later.

I always operate under the presumption that I am dumbest guy in the room. 

8. Bear markets create evidence that professionals are no smarter than novices.

Unless they timed the exact top and held short for the duration of a bear market. 

That is to say, while Citigroup is telling their clients to be “Brave” and buy stocks here, today’s valuation levels and historic market patterns are still flashing a red light. And instead of going long, investors might consider the possibility of a strong sell-off in the near future.

This conclusion is further supported by my mathematical and timing work. It clearly shows a severe bear market between 2015-2017. In fact, when it starts it will very quickly retrace most of the gains accrued over the last few years.  If you would be interested in learning when the bear market of 2015-2017 will start (to the day) and its internal composition, please CLICK HERE.

(***Please Note: A bear market might have started already, I am simply not disclosing this information. Due to my obligations to my Subscribers I am unable to provide you with more exact forecasts. In fact, I am being “Wishy Washy” at best with my FREE daily updates here. If you would be interested in exact forecasts, dates, times and precise daily coverage, please Click Here). Daily Stock Market Update. October 9th, 2015  InvestWithAlex.com

Did you enjoy this article? If so, please share our blog with your friends as we try to get traction. Gratitude!!!
Is A Bull Trap Now In Place?  Google

What Most Investors Don’t Understand About Today’s Stock Market

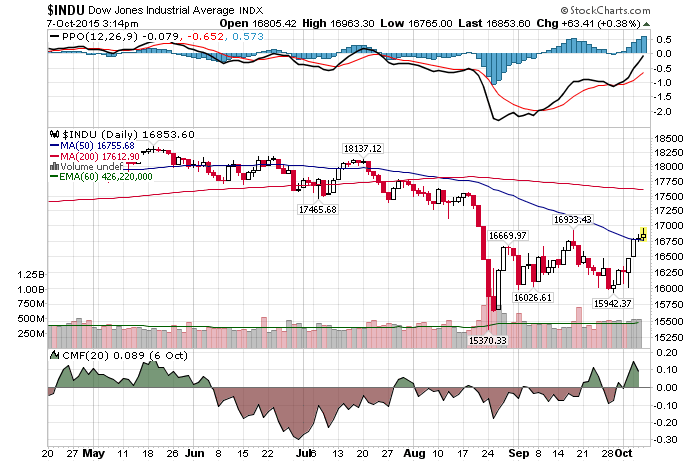
Daily Chart October 7 InvestWithAlex

10/7/2015 – A positive day with the Dow Jones up 122 points (+0.73%)  and the Nasdaq up 43 points (+0.90%) 

I have said it, and so did Rogers, Soros, Faber, Icahn and even Buffett. Either way you twist it, the stock market is incredibly and historically overpriced. To justify today’s valuations, the US Economy must be growing at a rate of 5%+ and not close to zero.

Which brings me to my next point. Market history is calling, and it’s saying stock performance will be crappy for another ~10 years

Because stocks are still fantastically expensive relative to most of recorded history.

And in the past, when stocks have been this expensive — or close to this expensive — performance over the next decade has been lousy.

Long-term valuation analysis suggests that we are still working through aftermath of the highest level of stock-market valuation in history — the peak of the tech bubble in 2000 — and that this workout process will take at least another 5-10 years.

The article above is definitely worth a few minutes of your time. It almost looks identical to my longer-term analysis found here. The Real Reason Behind Stock Market’s Recent Trouble

And while their conclusion is correct, they did get their cyclic composition wrong. What most people don’t realize is that it is not unusual to find the stock market selling at a P/E of 5-10 at the bottom of bear markets. As a result, today’s adjusted S&P P/E of 25 should send chills down your spine. And that is before earnings collapse.

Point being, there is quite a bit of discrepancy between today’s economic reality and market projections. The only remaining question is, how fast will this correction occur and what form will it take. Slow and steady or an outright collapse. We might find out soon enough.

This conclusion is further supported by my mathematical and timing work. It clearly shows a severe bear market between 2015-2017. In fact, when it starts it will very quickly retrace most of the gains accrued over the last few years.  If you would be interested in learning when the bear market of 2015-2017 will start (to the day) and its internal composition, please CLICK HERE.

(***Please NoteA bear market might have started already, I am simply not disclosing this information. Due to my obligations to my Subscribers I am unable to provide you with more exact forecasts. In fact, I am being “Wishy Washy” at best with my FREE daily updates here. If you would be interested in exact forecasts, dates, times and precise daily coverage, please Click Here). Daily Stock Market Update. October 7th, 2015  InvestWithAlex.com

Did you enjoy this article? If so, please share our blog with your friends as we try to get traction. Gratitude!!!
What Most Investors Don’t Understand About Today’s Stock Market  Google


How To Lose 100% Of Your Capital

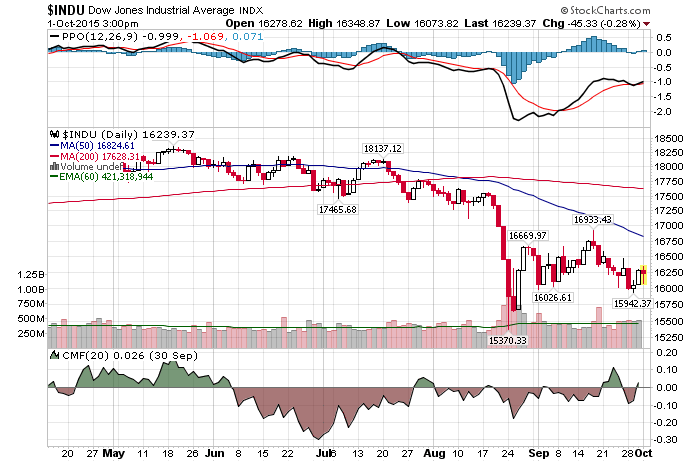
Daily Chart October 1 InvestWithAlex

10/1/2015 – A mixed day with the Dow Jones down 13 points (-0.08%) and the Nasdaq up 7 points (+0.15%) 

One thing is certain. If you read about any given trade in the mainstream financial medial outlet, chances are, it would be foolish to go ahead and execute on it. But here you go….How to make 7 times your money in Apple: Goldman

In other words, load up on Apple (AAPL) call options and wait for the stock to rally +50% over the next few months. It is as simple as that. It appears Goldman believes that the people on the other side of the trade are outright fools. Well, either that or guess who is writing those +700% calls to retail investors right about now.

As for me, I continue to maintain the view expressed here Shocking: The Real Story Behind Apple’s (AAPL) Decline

But wait, there is more good newsGood news: No one expects much from stocks

Expectations for stocks over the next six months have dropped along with the indexes. The fresh weekly survey by the American Association of Individual Investors showed those expecting lower prices jumped 11.2 percentage points to 39.9%, while those anticipating gains fell to 28.1%.

This is close to a multi-year high in bearishness, though 40% were bearish on July 30 right before the market tanked, so this is far from a reliable contrarian indicator on its own.

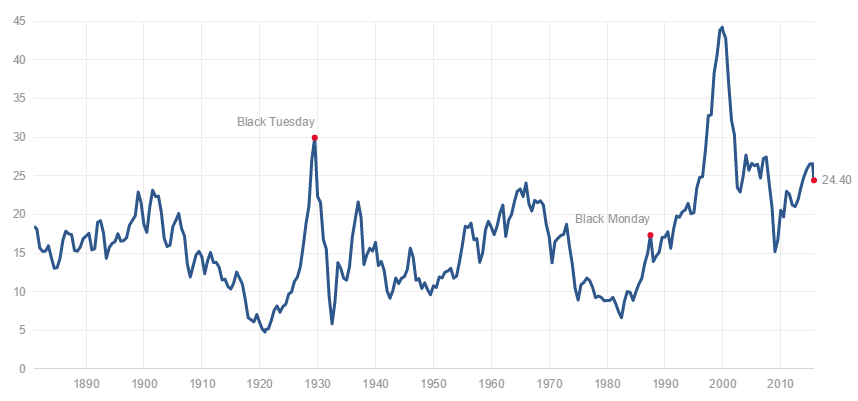
Seriously? Here is the only indicator you need. Shiller Adjusted S&P P/E Ratio.

shiller pe with rates investwithalex

As you can see, recent decline barely made a dent. And that is on top of today’s slowing economy, deteriorating earnings and freeze up in stimulus. Valuations have been higher on only two occasions. At 1929 and 2000 tops. You very well know what happened shortly thereafter.

In summary, just to reach its historic mean P/E of 16.6, the S&P would have to fall over 35% here. And that is the only sentiment indicator you should need. Everything else is just short-term noise no one can trade.

This conclusion is further supported by my mathematical and timing work. It clearly shows a severe bear market between 2015-2017. In fact, when it starts it will very quickly retrace most of the gains accrued over the last few years.  If you would be interested in learning when the bear market of 2015-2017 will start (to the day) and its internal composition, please CLICK HERE.

(***Please Note: A bear market might have started already, I am simply not disclosing this information. Due to my obligations to my Subscribers I am unable to provide you with more exact forecasts. In fact, I am being “Wishy Washy” at best with my FREE daily updates here. If you would be interested in exact forecasts, dates, times and precise daily coverage, please Click Here). Daily Stock Market Update. October 1st, 2015  InvestWithAlex.com

Did you enjoy this article? If so, please share our blog with your friends as we try to get traction. Gratitude!!!
How To Lose 100% Of Your Capital Google

Is Facebook (FB) Cooking “Likes”…..Again?

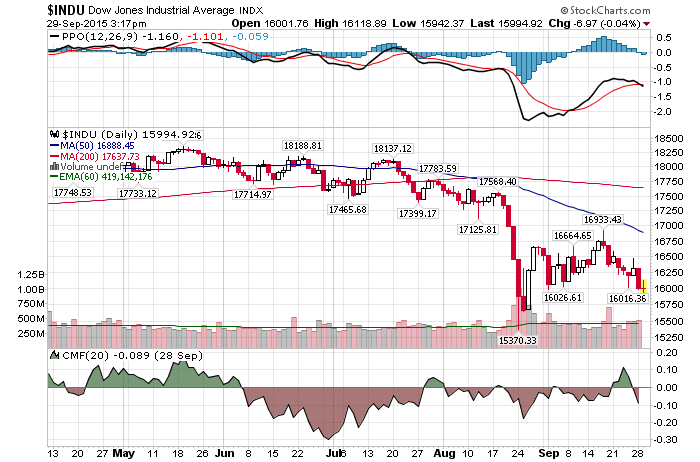
Daily Chart September 29 InvestWithAlex

9/29/2015 – A mixed day with the Dow Jones up 46 points (+0.29%) and the Nasdaq down 26 points (-0.59%) 

The stock market is not doing very much, so let’s talk about what I believe to be one of the best long-term short opportunities out there today. Facebook (FB). You can learn more about it here. Why Short Sellers Should Drool All Over Facebook (Published 2 months ago when Facebook was selling close to $100).

About two months ago I told you about a discrepancy that I have noticed right before and after Facebook’s Q-2 end.

Particularly, I have two old business pages on Facebook that I haven’t really used in about two years. When they were active,  I have probably spent a grand total of around $500 advertising both pages on FB. Just testing things out. Since stopping, those pages went dead.

Until about July of this year. Around that time, one of the pages got 5 likes while the other got 7. Plus, around 20 people followed the pages in question over the last few weeks. Curiously, these pages got no action, literally ZERO, in both respects over the last two years.  The content is old and whatever content is there is marginal at best. Point being, they shouldn’t be attracting attention.

I am now seeing this trend reappear at the end of September.

The question is…..why or what is going on?

While the story above is anecdotal at best and even though I cannot prove this, I believe Facebook is turning to artificial “click or like farming” to squeeze more revenue growth out of their business. Not a good sign at a P/E ratio of 88 to 95.

Point being, Facebook growth is slowing down. If they are indeed doing “Click Farming”, it must be slowing down substantially. And soon as investors get a whiff of that, they will send this thing down to $20 a share, where it belongs, and as my previous analysis suggests. At the very least, it should re-test $72.  You can thank me later.

This conclusion is further supported by my mathematical and timing work. It clearly shows a severe bear market between 2015-2017. In fact, when it starts it will very quickly retrace most of the gains accrued over the last few years.  If you would be interested in learning when the bear market of 2015-2017 will start (to the day) and its internal composition, please CLICK HERE.

(***Please Note: A bear market might have started already, I am simply not disclosing this information. Due to my obligations to my Subscribers I am unable to provide you with more exact forecasts. In fact, I am being “Wishy Washy” at best with my FREE daily updates here. If you would be interested in exact forecasts, dates, times and precise daily coverage, please Click Here). Daily Stock Market Update. September 29th, 2015  InvestWithAlex.com

Did you enjoy this article? If so, please share our blog with your friends as we try to get traction. Gratitude!!!
Is Facebook (FB) Cooking “Likes”…..Again? Google

What You Ought To Know About Everyone Being Too Bearish.

Daily Chart September 28 InvestWithAlex

9/28/2015 – A negative day with the Dow Jones down 313 points (-1.92%) and the Nasdaq down 141 points (-3.01%) 

I remember May19th, 2015, the Dow’s actual top, very well. While we were anticipating a top and were shorting, there were no bearish articles to be found. None, zero, zilch. In fact, you couldn’t open a financial terminal without seeing the Dow 20K, 25K, etc…by the end of the year article staring you in the face.

Today, the opposite is true. For instance…..

This is definitely something to pay attention to. Here is what else has me worried.

Most technicians I know, including Elliott Wave followers, expect a double bottom around August 24th low. That would resolve the “untradable” bottom issue I have covered here before, as well as replicate the 2011 sell-off and subsequent bounce structure.

Thereafter, everyone I know expects a massive rally. Either to new all time highs or into a substantial A-B-C bounce (if you are an Elliott Wave follower). And while that sounds good on paper, my problem is precisely that. The market rarely does what everyone expects it to do.

As a result, I have quite a few questions. What if the rally starts sooner? What if we slice through August 24th low and keep going lower. What if the bounce everyone expects doesn’t materialize at all? What if we sit in this trading range for the next 2 years? What if we crash? What if……

Impossible? Right. Just as that Pets.com stock was worth every penny in March of 2000.

This conclusion is further supported by my mathematical and timing work. It clearly shows a severe bear market between 2015-2017. In fact, when it starts it will very quickly retrace most of the gains accrued over the last few years.  If you would be interested in learning when the bear market of 2015-2017 will start (to the day) and its internal composition, please CLICK HERE.

(***Please Note: A bear market might have started already, I am simply not disclosing this information. Due to my obligations to my Subscribers I am unable to provide you with more exact forecasts. In fact, I am being “Wishy Washy” at best with my FREE daily updates here. If you would be interested in exact forecasts, dates, times and precise daily coverage, please Click Here). Daily Stock Market Update. September 28th, 2015  InvestWithAlex.com

Did you enjoy this article? If so, please share our blog with your friends as we try to get traction. Gratitude!!!
What You Ought To Know About Everyone Being Too Bearish. Google

Let’s Talk About FED Baby

Daily Chart September 24 InvestWithAlex

9/24/2015 – Another down day with the Dow Jones down 78 points (-0.48%) and the Nasdaq down 18 points (-0.38%) 

If you think I have been bearish, consider what Societe Generale’s Albert Edwards has to say. ALBERT EDWARDS WARNS: The next US recession will surprise investors, and a desperate Fed’s next move will be unprecedented

The next US recession will probably arrive a lot sooner than most investors expect and will likely see more desperate monetary experimentation from the Fed. Bob [Janjuah of Nomura] and I thought that this time we would see deeply negative interest rates in the US (and Europe). Sweden has led the way, dipping their toe below the water line with their current -0.35% policy rates but there will be more, much more along these lines. For if -0.35% is possible, why not – 3.5% or less? It goes without saying that deeply negative interest rates would be accompanied by a massively expanded QE4 in the US. The last seven years of exploding central bank balance sheets will seem like Bundesbank monetary austerity compared to what is to come.

Well, if -3.5% is possible, than why the hell not -50%?

I’ll tell you why. First, that would equal outright monetization. If that actually happens, my investment advice would be very simple. Invest in guns, ammo and canned food. Is the FED that stupid and irresponsible? They have brought us thus far, but that would definitely be something else.

As I have mentioned here many times before, the FED is unlikely to raise rates anytime soon. Which brings me to my point #2. Negative interest rates and QE  4, …5….6….. will have no impact on our capital markets and the overall economy.

Why? 

There is nothing to invest in. Notice, I didn’t say to speculate in. It is as simple as that. The stock market is in a massive bubble, by all traditional measures. The US Economy has plenty of spare capacity as is evident from the negative wage growth (inflation adjusted). Deflationary forces are re-appearing again, etc….

Point being, while the FED can literally drop money for a helicopter, they won’t be able to steer that money towards anything productive or good. Yes, some of it will go towards speculation, share buybacks, wars, etc…., but that will just create an even bigger bubble down the road.

In other words, the FED has already lost this game. It’s just that most investors don’t realize it yet.

This conclusion is further supported by my mathematical and timing work. It clearly shows a severe bear market between 2015-2017. In fact, when it starts it will very quickly retrace most of the gains accrued over the last few years.  If you would be interested in learning when the bear market of 2015-2017 will start (to the day) and its internal composition, please CLICK HERE.

(***Please Note: A bear market might have started already, I am simply not disclosing this information. Due to my obligations to my Subscribers I am unable to provide you with more exact forecasts. In fact, I am being “Wishy Washy” at best with my FREE daily updates here. If you would be interested in exact forecasts, dates, times and precise daily coverage, please Click Here). Daily Stock Market Update. September 24th, 2015  InvestWithAlex.com

Did you enjoy this article? If so, please share our blog with your friends as we try to get traction. Gratitude!!!

Let’s Talk About FED Baby Google

What Investors Ought To Know About Today’s Stock Market

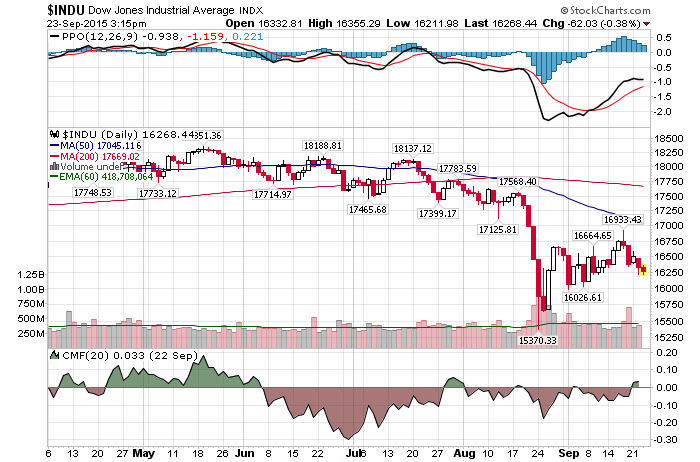
Daily Chart September 23 InvestWithAlex

9/23/2015 – Another down day with the Dow Jones down 51 points (-0.31%) and the Nasdaq down 4 points (-0.08%) 

The stock market is confused and so are most traders. From one vantage point, we are sitting on a buying opportunity of a lifetime. For instance, S&P 500: What’s on Tap for the Rest of 2015? 6 Reasons to Expect a Rally. From another, this apparent bear market is just starting. Stocks Will Slide Much More — Here’s How to Avoid the Pain of 2008

To complicate matters even more, most traders and Elliot Wave technicians I know expect the re-test of August’s lows before any sort of a rally materializes. Only if it was that easy.

Who is right? 

Even if I knew I wouldn’t tell you, but let’s take a closer look at those 6 reasons to be bullish. My comments are in greed.

1. History: Panic declines, like in August, tend to be followed by a period of testing and another low or at least a test of the initial panic low.

That is absolutely correct. However, how is that bullish is lost on me. 

2. Historical evidence: There have been 21 panic drops similar to the August one. 10 of them tested or broke the initial panic low before going higher. Five of them were a v-shaped recovery. Even three of the six instances that rolled over into a new bear market saw sizeable rallies after breaking the initial panic low.

Fair enough. We have rallied 1560 points on the Dow off of August 24th low or 10.2%. NDX was up 17.5%. Is that not sizeable enough? Just as a reference point, in 1929 the bounce was 12-13%. That was followed by a 50% drop. Again, I am failing to see how this is bullish. 

3. Seasonality: Late September to early October is one of the worst times for the S&P 500 in terms of seasonality (view S&P 500 seasonality chart).

Actually, it is October-November. I am staring to think that this article is written by a bear. 

4. Statistically: The S&P 500 ended August with a loss of more than 5%. This has happened 13 times since 1928. The September thereafter was positive only 4 out of 13 times.

OK, another worthless data point, but good to know. 

5. Post-Triple-Witching weakness: Since 1991, there have been 33 Triple-Witching Friday’s that ended in the red (like last Friday). Some 24 were followed by a weekly loss.

OK, another worthless data point. This is not indicative of anything. 

6. Elliott Wave Theory: According to Elliott Wave Theory, stocks move in segments of either three or five waves (this is a highly simplified explanation). Thus far, the S&P 500 has fallen in three waves. The current bounce looks like a wave 4 retracement, to be followed by another wave down (wave 5 — see labels on chart). Alternatively, the decline could only be three waves and lead to new all-time highs without prior new low.

Again, if it was this simple all Elliott Wave practitioners and/or followers would be billionaires by now. Plus, I am still confused about how this is bullish for stocks. 

All of the above is just noise. In reality, one must look at the long-term structure and the fundamentals. The stock market is incredibly overpriced, by most traditional measures. I have beaten this point to death on this blog over the last few years. Technically, the market did a quite of a bit of damage on the downside in August. Suggesting that a bear market might have already started. And that should be your primary concern.

This conclusion is further supported by my mathematical and timing work. It clearly shows a severe bear market between 2015-2017. In fact, when it starts it will very quickly retrace most of the gains accrued over the last few years.  If you would be interested in learning when the bear market of 2015-2017 will start (to the day) and its internal composition, please CLICK HERE.

(***Please Note: A bear market might have started already, I am simply not disclosing this information. Due to my obligations to my Subscribers I am unable to provide you with more exact forecasts. In fact, I am being “Wishy Washy” at best with my FREE daily updates here. If you would be interested in exact forecasts, dates, times and precise daily coverage, please Click Here). Daily Stock Market Update. September 23rd, 2015  InvestWithAlex.com

Did you enjoy this article? If so, please share our blog with your friends as we try to get traction. Gratitude!!!

What Investors Ought To Know About Today’s Stock Market  Google

Why The Stock Market Should Be 50% Lower

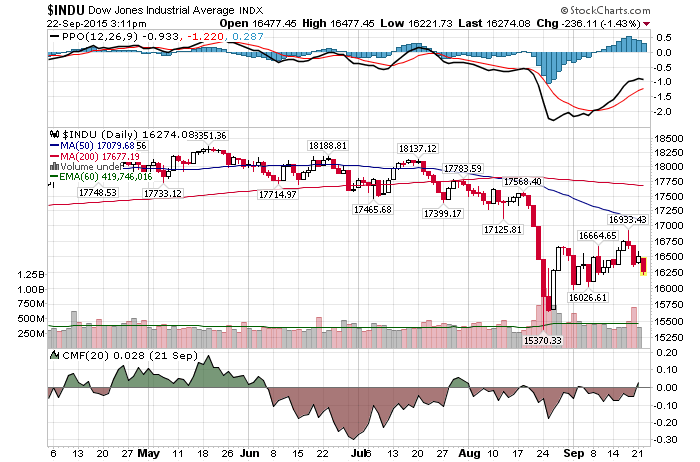
Daily Chart September 22 InvestWithAlex

9/22/2015 – A down day with the Dow Jones down 182 points (-1.10%) and the Nasdaq down 72 points (-1.50%) 

I couldn’t agree more with Mark Spitznagel here. Apparently he made over a Billion (at least Intraday) during August’s market drop. It appears that our fundamental and market views match up to about 95%. So, instead of me yapping about this for the 100th time, I will let Mark tell you what he thinks.

“If August was scary for people, they ain’t seen nothin’ yet.”

If you participate in financial markets, this interview is definitely worth a few minutes of your time.

This conclusion is further supported by my mathematical and timing work. It clearly shows a severe bear market between 2015-2017. In fact, when it starts it will very quickly retrace most of the gains accrued over the last few years.  If you would be interested in learning when the bear market of 2015-2017 will start (to the day) and its internal composition, please CLICK HERE.

(***Please Note: A bear market might have started already, I am simply not disclosing this information. Due to my obligations to my Subscribers I am unable to provide you with more exact forecasts. In fact, I am being “Wishy Washy” at best with my FREE daily updates here. If you would be interested in exact forecasts, dates, times and precise daily coverage, please Click Here). Daily Stock Market Update. September 22nd, 2015  InvestWithAlex.com

Did you enjoy this article? If so, please share our blog with your friends as we try to get traction. Gratitude!!!
Why The Stock Market Should Be 50% Lower  Google