Shocking: Advance Mathematical Work Shows 30 Years Of No Capital Gains Ahead

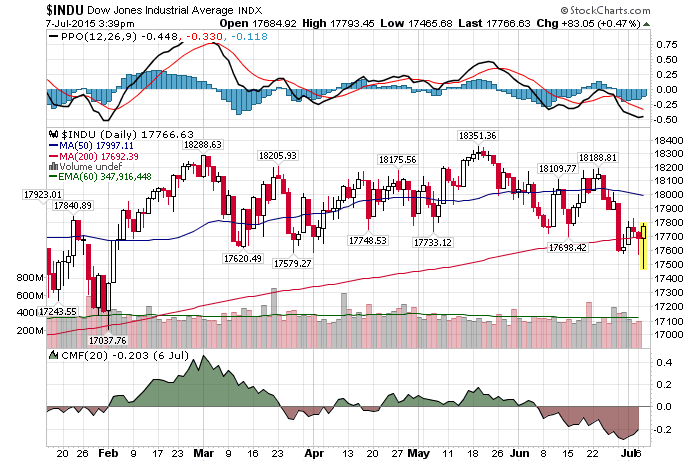
Daily Chart Uly 9 InvestWithAlex

7/9/2015 – A positive day with the Dow Jones up 32 points (+0.19%) and the Nasdaq up 12 points (+0.26%)

Impossible?

Not only is it possible, it is highly probable. At least based on my long-term mathematical work. Also, John Hussman certainly thinks so as well, although not to the extent: Get Ready for Zero Stock Returns Over Next 10 Years

I don’t know why people find this so shocking. I often mention two extended periods of time when stocks showed ZERO appreciation. From 1790 to 1860 (70 years) and 1899 to 1949 (50 year) periods of time. But we don’t have to go that far.

The stock market hasn’t gone anywhere over the last 15.5 years. The chart below shows an inflation adjusted S&P. As you can see, the index hasn’t gone anywhere. The Dow finds itself in the same boat, while the Nasdaq is still 10-15% lower (inflation adjusted).
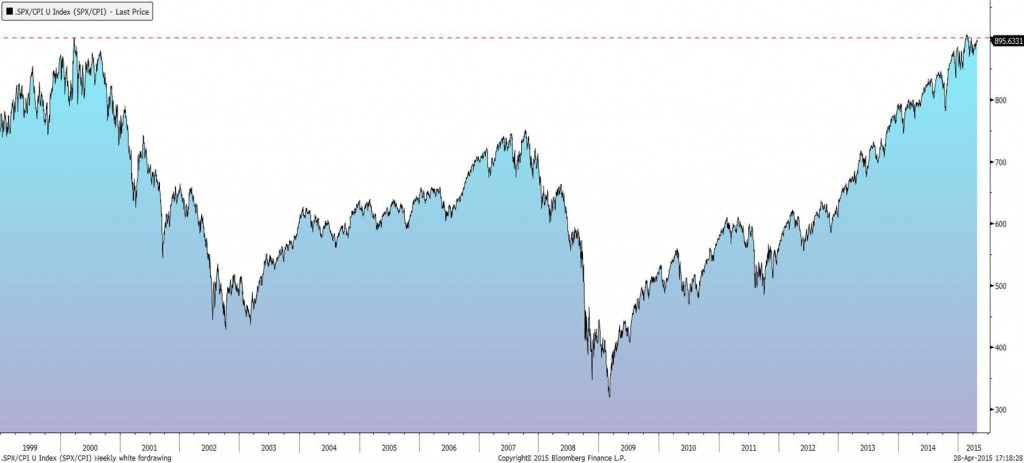
S&P inflation adjusted

What’s worse, we are currently in an overvaluation bubble and on a verge of a substantial bear market. In fact, my mathematical work shows that once the market rolls over, we won’t see today’s levels again until the year 2021 at the earliest. Plus, once the next bull market completes in the early 2030’s we are likely to re-test these levels again.

And if you believe that is insane, it’s obvious that you haven’t studied the market long, far or hard enough.

Here is the point I am driving at. Long-term or buy/hold investors will be incredibly frustrated over the next 15-20 years. Just as they have been over the last 15 years. And only those who are willing and are able to shift into a bear market positioning, as my earlier post today suggested, should be able to benefit substantially. Everyone else will be sitting on zero gains. What’s worse, they are set to experience yet another severe bear market over the next few years.

So, a preemptive rotation into a bear market positioning or into cash is the key here.

This conclusion is further supported by my mathematical and timing work. It clearly shows a severe bear market between 2015-2017. In fact, when it starts it will very quickly retrace most of the gains accrued over the last few years.  If you would be interested in learning when the bear market of 2015-2017 will start (to the day) and its internal composition, please CLICK HERE.

(***Please NoteA bear market might have started already, I am simply not disclosing this information. Due to my obligations to my Subscribers I am unable to provide you with more exact forecasts. In fact, I am being “Wishy Washy” at best with my FREE daily updates here. If you would be interested in exact forecasts, dates, times and precise daily coverage, please Click Here). Daily Stock Market Update. July 9th, 2015  InvestWithAlex.com

Did you enjoy this article? If so, please share our blog with your friends as we try to get traction. Gratitude!!!

Shocking: Advance Mathematical Work Shows 30 Years Of No Capital Gains Ahead Google

The S&P Would Have To Drop 80% To….

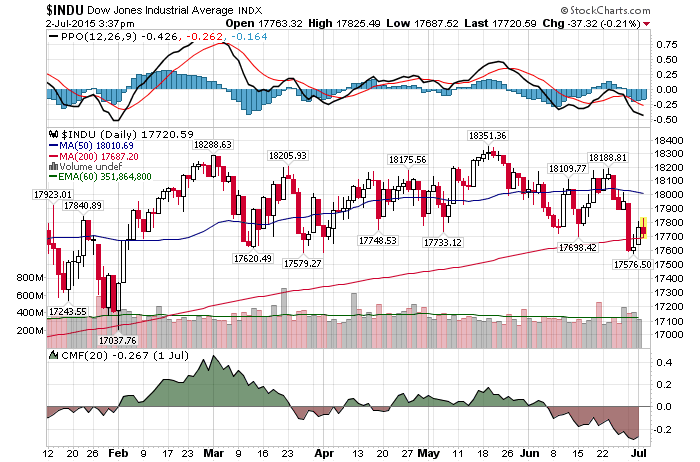
Daily Chart Uly 7 InvestWithAlex

7/7/2015 – A positive day with the Dow Jones up 95 points (+0.54%) and the Nasdaq up 5 points (+0.11%).

The S&P would have to drop 80% to re-recreate an environment when interest rates were this low last time.

Most bulls (most investors today) will argue that today’s high valuations are very well justified. Due to low interest rates. For instance….

Stocks aren’t expensive: Fidelity

In fact, because interest rates are so close to zero, some people believe that stocks deserve infinite valuations. This premise is also know as, “this time is different”.

This chart brings that assumption into question.

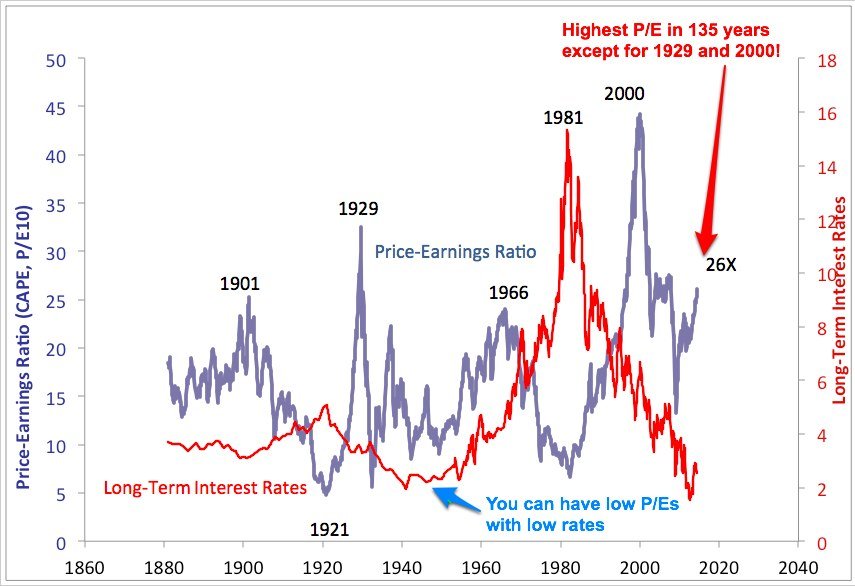
shiller pe with rates investwithalex

Simply put, just because interest rates are low, doesn’t mean P/E multiple cannot go down. For instance, in 1941 interest rates were at around 2% (exactly where they are today) while the P/E ratio rested at 8.

If such an environment was to repeat itself today, the S&P would have to take a 66% haircut.

But wait, it gets even worse. In 1941 we were at the bottom of that particular economic cycle. The earnings have already contracted and stocks were selling at a massive discount. In fact, they were about to stage a 5 year WW2 rally.

Today, the situation is reversed. Earnings expansion is at its peak (thanks to the FED and their little QE liquidity party) and the P/E ratio has only been higher on two other occasions (1929 and 2000). In other words, for the S&P to reach 1941 levels it would have to fall 80%.

Let me put it this way.  Anyone who believes that this stock market rally will continue hasn’t studied history nor appropriate market valuation metrics. Plus and just FYI, “this time is different” is a terrible investment strategy.

This conclusion is further supported by my mathematical and timing work. It clearly shows a severe bear market between 2015-2017. In fact, when it starts it will very quickly retrace most of the gains accrued over the last few years.  If you would be interested in learning when the bear market of 2015-2017 will start (to the day) and its internal composition, please CLICK HERE.

(***Please Note: A bear market might have started already, I am simply not disclosing this information. Due to my obligations to my Subscribers I am unable to provide you with more exact forecasts. In fact, I am being “Wishy Washy” at best with my FREE daily updates here. If you would be interested in exact forecasts, dates, times and precise daily coverage, please Click Here). Daily Stock Market Update. July 7th, 2015  InvestWithAlex.com

Did you enjoy this article? If so, please share our blog with your friends as we try to get traction. Gratitude!!!

The S&P Would Have To Drop 80% To…..Google

The Worst Case Scenario For The FED Is Becoming A Reality

Daily Chart Uly 2 InvestWithAlex

7/6/2015 – A down day with the Dow Jones down 44 points (-0.25%) and the Nasdaq down 17 points (-0.34%). 

A massive and rather rapid stock market decline is coming later on this year. And while we won’t have a crash, considering the amount of margin debt out there, quite a few people will get wiped out. If you would like to find out exactly when this move will develop, to the day, please Click Here. 

What is the worst case scenario for the FED? 

Imagine the following setup.

  1. Interest rates remain at zero or below 1%.
  2. The stock marker rolls over and initiates a decline. A decline that has the capability of turning into a flash crash later in the year.
  3. The US Economy “officially” goes negative as corporate earnings collapse.
  4. The FED introduces QE 4 to stabilize the market/economy.
  5. Bond market reacts in a negative fashion as yields surge.
  6. Negative self sustaining loop is now in place.
  7. Checkmate and game over!!!

Impossible?

Far from it. I would argue that points 1-4 are already baked in and will fire off over the next 6-12 months. The only thing I am not as confident about is the bond market. In such a case, yields can react in either direction and it is a little bit more difficult to predict at this time.

That is to say, the FED has already missed their opportunity to reload. When the next crisis hits, soon, there is very little that the FED will be able to do. Well, they will be able to watch the market meltdown, but they won’t be able to do anything about it. I am afraid that their nightmare is about to become a reality.

This conclusion is further supported by my mathematical and timing work. It clearly shows a severe bear market between 2015-2017. In fact, when it starts it will very quickly retrace most of the gains accrued over the last few years.  If you would be interested in learning when the bear market of 2015-2017 will start (to the day) and its internal composition, please CLICK HERE.

(***Please NoteA bear market might have started already, I am simply not disclosing this information. Due to my obligations to my Subscribers I am unable to provide you with more exact forecasts. In fact, I am being “Wishy Washy” at best with my FREE daily updates here. If you would be interested in exact forecasts, dates, times and precise daily coverage, please Click Here). Daily Stock Market Update. July 1st, 2015  InvestWithAlex.com

Did you enjoy this article? If so, please share our blog with your friends as we try to get traction. Gratitude!!!

The Worst Case Scenario For The FED Is Becoming A Reality Google

Is Today’s “Real” Stock Market P/E Ratio Above 30?

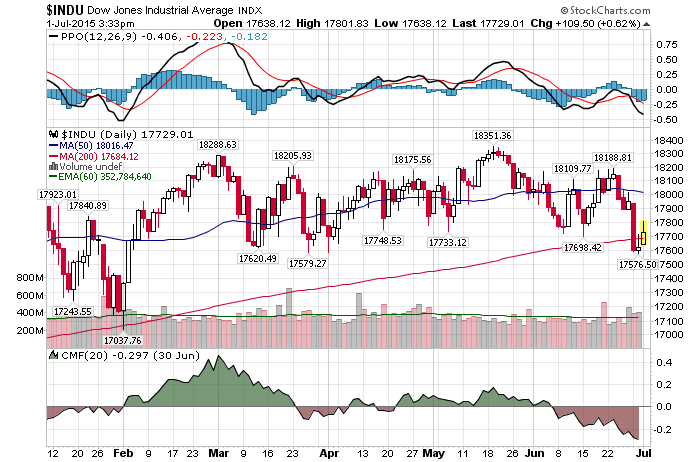
Daily Chart Uly 1 InvestWithAlex

7/1/2015- A positive day with the Dow Jones up 158 points (+0.90%) and the Nasdaq up 26 points (+0.53%)

A massive and rather rapid stock market decline is coming later on this year. And while we won’t have a crash, considering the amount of margin debt out there, quite a few people will get wiped out. If you would like to find out exactly when this move will develop, to the day, please Click Here. 

A number of quite important opinions about today’s stock market. Let’s take a look.

As the stock market climbs ever higher, professional investors are warning that companies are presenting misleading versions of their results that ignore a wide variety of normal costs of running a business to make it seem like they’re doing better than they really are.

We have talked about this before. BlackRock: Most Of Corporate Earnings Growth (If Any) Is Accounting Driven

I have said it before and I will say it again. Today’s distortions are so great that the FED’s Ponzi Finance makes Bernie Madoff look like a boy scout. But its more than that. Everyone is playing the same accounting game. Whether it is through low interest rates, share buybacks or outright accounting gimmicks.

While impossible to calculate, I would say that a more normalized environment would add 5 to 10 points to today’s P/E ratios. By the way, Shiller’s Adjusted P/E Ratio is already at 27. Turning an already expensive market into “are you freaking kidding me overpriced accident” waiting to happen.

Never before has a rally in the U.S. stock market gone on this long without a Federal Reserve interest-rate increase. Expecting valuations to keep rising once one comes is asking too much, if history is any guide.

As I have suggested before,  the FED finds itself in an impossible situation. It is stuck in the corner. With all of the misallocations over the last 15-20 years about to come crashing down on them. They best they can hope for at this stage is debt monetization and run away inflation. But with bond prices possibly collapsing, they might not even have that option.

Interesting times ahead, that’s for sure.

This conclusion is further supported by my mathematical and timing work. It clearly shows a severe bear market between 2015-2017. In fact, when it starts it will very quickly retrace most of the gains accrued over the last few years.  If you would be interested in learning when the bear market of 2015-2017 will start (to the day) and its internal composition, please CLICK HERE.

(***Please NoteA bear market might have started already, I am simply not disclosing this information. Due to my obligations to my Subscribers I am unable to provide you with more exact forecasts. In fact, I am being “Wishy Washy” at best with my FREE daily updates here. If you would be interested in exact forecasts, dates, times and precise daily coverage, please Click Here). Daily Stock Market Update. July 1st, 2015  InvestWithAlex.com

Did you enjoy this article? If so, please share our blog with your friends as we try to get traction. Gratitude!!!

Is Today’s Real Stock Market P/E Ratio Above 30?  Google

Shocking: Buy The Dip Mentality Can Lead To A Crash

Daily Chart June 30 InvestWithAlex

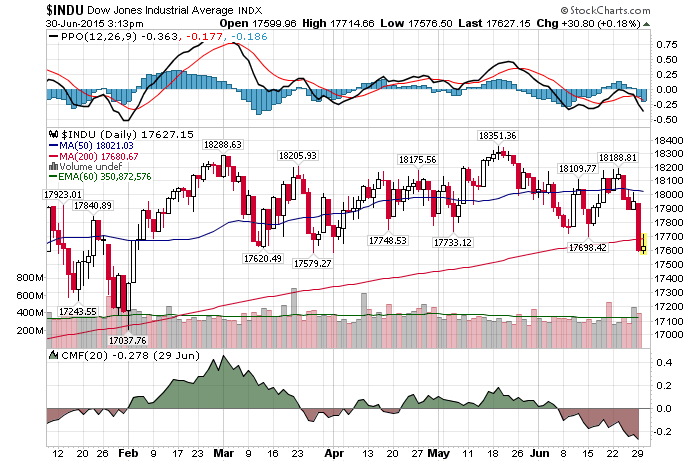
6/30/2015 – A positive day with the Dow Jones up 21 points (+0.12%) and the Nasdaq up 28 points (+0.57%)

Well, that was fast. Just as predicted here yesterday, any small bounce would surely bring out perma bulls with the “this market is bulletproof and buy the dip” mentality. Mr. Cramer delivers.

Cramer: Amazing world chaos-resistant stocks

 “I say you buy some very special biotechs that have refused to come down until now. That’s right, I think you use this marketwide selloff as an opportunity to pick up the speculative development stage biotech names that haven’t had a price break in ages,” the “Mad Money” host said.

Seriously….Biotech??? Biotech is the most speculative sector within the stock market. It is equivalent to where the Internet stocks were right before the 2000 crash.  And while the market will bounce to at least close Monday’s gap, I wouldn’t necessarily be loading up on Biotech here.

Anyway, we are all free to make our own decision. With that in mind, I would rather listen to Bill Gross. Make sure you read his recently published statement in full.

Current concerns in the financial markets center around the absence of liquidity and the effect it might have on future market prices. In 2008/2009, markets experienced not only a Minsky moment but a liquidity implosion, as levered investors were forced to delever. Ultimately the purge threatened even the safest and most liquid of investments. Several money market funds appeared to ‘break the buck’ which in turn threatened the $4 trillion overnight repo market – the center core of our current finance-based economy.”

But shadow banking structures — unlike cash securities — require counterparty relationships that require more and more margin if prices should decline. That is why PIMCO’s safe haven claim of their use of derivatives is so counterintuitive. While private equity and hedge funds have built-in “gates” to prevent an overnight exit, mutual funds and ETFs do not. That an ETF can satisfy redemption with underlying bonds or shares, only raises the nightmare possibility of a disillusioned and uninformed public throwing in the towel once again after they receive thousands of individual odd lot pieces under such circumstances. But even in milder “left tail scenarios” it is price that makes the difference to mutual fund and ETF holders alike, and when liquidity is scarce, prices usually go down not up, given a Minsky moment. Long used to the inevitability of capital gains, investors and markets have not been tested during a stretch of time when prices go down and policymakers’ hands are tied to perform their historical function of buyer of last resort. It’s then that liquidity will be tested.

In other words and as I tend to visualize it, we are sitting on top of a 40ft containter full of TNT, with a lit fuse disappearing inside of it. We have talked about disappearing liquidity before. Plus, given today’s overvaluation levels, there is just way too much risk in our financial system.

We have faced a similar environment pre 1987 crash. That is to say, should the market correct 10-15% in a rather rapid fashion, we might have a subsequent flash crash scenario that will take us down another 25-40%.   Carl Icahn, Jim Rogers and now Bill Gross are warning about this. Who else do you need?

This conclusion is further supported by my mathematical and timing work. It clearly shows a severe bear market between 2015-2017. In fact, when it starts it will very quickly retrace most of the gains accrued over the last few years.  If you would be interested in learning when the bear market of 2015-2017 will start (to the day) and its internal composition, please CLICK HERE.

(***Please Note: A bear market might have started already, I am simply not disclosing this information. Due to my obligations to my Subscribers I am unable to provide you with more exact forecasts. In fact, I am being “Wishy Washy” at best with my FREE daily updates here. If you would be interested in exact forecasts, dates, times and precise daily coverage, please Click Here). Daily Stock Market Update. June 30th 2015  InvestWithAlex.com

Did you enjoy this article? If so, please share our blog with your friends as we try to get traction. Gratitude!!!

Shocking: Buy The Dip Mentality Can Lead To A Crash Google

Just How Much Risk Is In The Stock Market?

Daily Chart June 29 InvestWithAlex

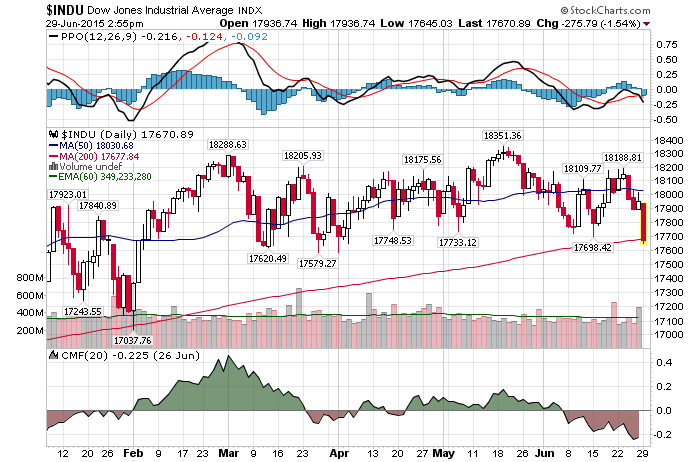
6/29/2015 – A big down day with the Dow Jones down 349 points (-1.94%) and the Nasdaq down 122 points (-2.40%)

Over the last few weeks I have warned that the market was accumulating energy for a big move ahead. Yet, today’s move is nothing in comparison to what is still to come. If you would like to find out what happens next, the direction of the said move and most importantly, WHEN, please Click Here.

It is highly probable that today’s perma bulls will look at today’s market action and laugh. After all, Greece is on a verge of default and the Dow could barely move down 350 points. Plus, today’s down gap is likely to be closed. In other words, quite a few investors will see this market as literally bulletproof. And perhaps it is.

With that in mind, just how much risk is out there? Let’s take a closer look.

  • Shiller’s S&P P/E ratio is at 27. The third highest in the history of the stock market. Only 1929 and 2000 tops where more expensive (not by much). We all know what happened thereafter.
  • Today, Americans have 41 percent of their financial assets in stocks, matching the high in 2007 and trailing only the Internet bubble.
  • Americans already own a lot more stocks than they usually do. At 57 percent, the current holdings relative to bonds and cash are far from their peak at 66 percent in 2000, but they’re approaching levels that have coincided with market peaks in the past. The low was hit in 1982 at 27 percent.
  • America’s 95 million investors are at huge risk. Remember the $10 trillion losses in the crash and recession of 2007-2009? The $8 trillion lost after the dot-com technology crash and recession of 2000-2003? This is the third big recession of the century. Yes, America will lose trillions again.
  • With interest rates at zero, the FED will be powerless to backstop the next bear market leg. Even the next round of QE can backfire in a major way. Depending on how the bond market reacts.

I am not sure how most people view this, but for me, the points above represent a tremendous amount of risk in today’s financial system. A risk that is currently not being properly priced in.

This conclusion is further supported by my mathematical and timing work. It clearly shows a severe bear market between 2015-2017. In fact, when it starts it will very quickly retrace most of the gains accrued over the last few years.  If you would be interested in learning when the bear market of 2015-2017 will start (to the day) and its internal composition, please CLICK HERE.

(***Please Note: A bear market might have started already, I am simply not disclosing this information. Due to my obligations to my Subscribers I am unable to provide you with more exact forecasts. In fact, I am being “Wishy Washy” at best with my FREE daily updates here. If you would be interested in exact forecasts, dates, times and precise daily coverage, please Click Here). Daily Stock Market Update. June 29th 2015  InvestWithAlex.com

Did you enjoy this article? If so, please share our blog with your friends as we try to get traction. Gratitude!!!

Just How Much Risk Is In The Stock Market Google

Stock Market Crash Impossibility

Daily Chart June 25 InvestWithAlex

6/25/2015 – Another negative day with the Dow Jones down 75 points (-0.42%) and the Nasdaq down 10 points (-0.20%) 

A massive and rather rapid stock market decline is coming soon. And while we won’t have a crash, considering the amount of margin debt out there, quite a few people will get wiped out. If you would like to find out exactly when this move will develop, to the day, pleaseClick Here. 

Is the stock market crash even possible in today’s market environment? 

I discussed just that with a money manager friend of mine over the weekend. He was adamant that any sort of a large scale crash or sell-off is impossible today. Why? To keep it short, the markets are much bigger and more liquid, the FED will be fast to act and corporate America is doing just fine.

Fair enough, but John Hussman is not buying the argument: Get Ready for Stock Crash Along Lines of 1929, 2000 & 2007

Who is right? 

No one expects a crash and most people believe they are impossible, that’s why they happen. We are most certainly setup for one today. Shiller’s S&P P/E is at 27, third highest ever, right behind 1929 and 2000 tops. We all know what happened thereafter.

Plus, the liquidity situations today is almost identical to what had transpired right before the 1987 crash. We talked about that yesterday in Goldman Warns: Liquidity Can Quickly Become A Big Problem. So, indeed, we might be in an environment where a crash is not only likely, but is highly probable.

Speaking of 1929 crash, predicting it and John D. Rockeffeller. Let me tell you a cool story.

The Dow set a secondary bottom in early May of 1924 and then went on a rampage bull market that terminated on September 3rd, 1929 (exact top). Thereafter, the Dow distributed for 6 weeks before initiating its crash sequence on October 24, 1929. By November 13th, 1929 the Dow was down 49%. A devastating collapse.

Now, I know what you are thinking. “People were kind of dumb back then. The market was clearly in a speculative bubble and even a monkey with half a brain could have seen the 1929 crash coming from a mile away”.  WRONG. Human nature never changes. Case and point, I present to you probably the smartest and the wealthiest businessman who ever lived, Mr. John D. Rockeffeller (his net worth was over $200 Billion in today’s money).

October  30, 1929: The Dow Jones Industrial Average has one of its best days ever, rocketing up 29 points, or 12.3%, to 258 as John D. Rockefeller, Sr. announces: “There is nothing in the business situation to warrant the destruction of values that has taken place on the exchanges during the past week. My son and I have for some days been purchasing sound common stocks.” The Dow goes on to lose 84.1% more of its value before bottoming out on July 8, 1932.

I think his quote speaks for itself.  Just as in 1929, 99.99% of people today are not aware of where we are. Back to 2015.  I have already beaten the fundamental/economic/market horse and today’s stock market overvaluation/speculation levels to death. Both, in my daily blog and in my weekly updates. The only remaining question is, are you ready for a big market sell-off when it comes? If you would like to find out when that happens, pleaseClick Here

This conclusion is further supported by my mathematical and timing work. It clearly shows a severe bear market between 2015-2017. In fact, when it starts it will very quickly retrace most of the gains accrued over the last few years.  If you would be interested in learning when the bear market of 2015-2017 will start (to the day) and its internal composition, please CLICK HERE.

(***Please NoteA bear market might have started already, I am simply not disclosing this information. Due to my obligations to my Subscribers I am unable to provide you with more exact forecasts. In fact, I am being “Wishy Washy” at best with my FREE daily updates here. If you would be interested in exact forecasts, dates, times and precise daily coverage, please Click Here). Daily Stock Market Update. June 25th 2015  InvestWithAlex.com

Did you enjoy this article? If so, please share our blog with your friends as we try to get traction. Gratitude!!!

Stock Market Crash Impossibility  Google

Not That We Need Another Bearish Sign, But…..

Daily Chart June 23 InvestWithAlex

6/23/2015 – A positive day with the Dow Jones up 25 points (+0.14%) and the Nasdaq up 6 points (+0.12%).

A massive and rather rapid stock market decline is coming soon. And while we won’t have a crash, considering the amount of margin debt out there, quite a few people will get wiped out. If you would like to find out exactly when this move will develop, to the day, please Click Here. 

We all know that the largest stock index by capitalization, the NYSE, hasn’t moved an inch in 11.5 months. Now, Mark Hurbert brings out an important point

Here’s one bear market sign you’ve never seen before

That’s because the degree to which stocks move together in unison is a function of the market cycle. In bear markets the vast majority of stocks do so, whereas in bull markets stocks tend to march to the beat of their own drummer. It’s at market tops, therefore, when stocks’ moves in step with the overall market tend to be at the lowest point.

Such as it is now. Last week, even as the broad market averages rose to within shouting distance of their all-time highs and some secondary averages actually did so, just 7.2% of stocks on the New York Stock Exchange hit new 52-week highs. A slightly greater percentage of stocks — 7.3% — hit new 52-week lows.

That is excellent and precisely correct. It is only a “stock pickers market” until, as Mike Tyson puts in, a bear market punches you in the mouth.

Here is something to consider. During a typical bear market about 60-70% of all stocks decline, 15% stay flat and about 15% advance. When we have severe bear market sell-offs, as we did in 2007-2009, about 80% of all stocks decline, 10% stay flat and about 10% exhibit some sort of an advance.

Point being, it is pointless to pick stocks at market tops. Particularly today. Everything is overvalued and the chances of you finding that winning stock is 1 in 10. And even if you do, it is unlikely to go up very much. Stocks should be picked at the bottom of the market cycle, not the top. That’s when you find future 10 Baggers at giveaway prices.

At the top, everything should be sold and moved into cash. Better yet, invested in bear funds with a proven track record. The fact that today’s investment advisers promote stock picking is yet another sign that the top might be near.

This conclusion is further supported by my mathematical and timing work. It clearly shows a severe bear market between 2015-2017. In fact, when it starts it will very quickly retrace most of the gains accrued over the last few years.  If you would be interested in learning when the bear market of 2015-2017 will start (to the day) and its internal composition, please CLICK HERE.

(***Please NoteA bear market might have started already, I am simply not disclosing this information. Due to my obligations to mSubscribers I am unable to provide you with more exact forecasts. In fact, I am being “Wishy Washy” at best with my FREE daily updates here. If you would be interested in exact forecasts, dates, times and precise daily coverage, please Click Here). Daily Stock Market Update. June 23rd 2015  InvestWithAlex.com

Did you enjoy this article? If so, please share our blog with your friends as we try to get traction. Gratitude!!!

Not That We Need Another Bearish Sign, But….. Google

Shocking: No Capital Gains Over The Next 50 Years?

Daily Chart June 22 InvestWithAlex

6/22/2015 – A positive day with the Dow Jones up 107 points (+0.59%) and the Nasdaq up 37 points (0.72%). 

Let me ask you a question. If someone from the future approached you on October 10th, 2007 and outlined the next 7-8 years within the stock market, what would you do? Would you….

  1. Completely ignore the 2007-2009 sell-off because the market would eventually make up all of the losses and then push higher within the next 7 years -OR-
  2. Pawn your left kidney, sell your firstborn and then buy every put option you could afford in anticipation of a 2007-2009 decline. Only to repeat the process at 2009 bottom with call options.

Well, I don’t think there a doubt that most people would go ahead with option B. Unless they have few screws missing and/or too lazy to get their broker on the phone.

Why am I bringing this up? 

I am beginning to see quite a few “What’s The Big Deal” Or “What’s the Worst Case Scenario” articles being propagated by the mainstream financial media. For instance, The worst case if you invest in a hot stock market

Worst case scenario: In nearly 90 years of market history, if you bought stocks on the absolute worst day, the average time to make your money back was 3 years. That’s less time than it takes most people to get through high school or college. It’s doable. It shouldn’t make you shy away from investing in stocks.

“Obviously, to live through that is painful,” says Valeri, an investment strategist. “But when you think about what you’re investing for — and for most people it’s at least 10 or 20 years out — you will get past that.”

They all come to the same conclusion. Even though the stock market is overvalued, do not worry and keep buying, your investment will eventually appreciate. Perhaps.

Just 90 years? I have the Dow chart going all the way back to the first day of trading. May 19th, 1790 or 225 year. Let me tell you something. There have been quite a few periods of 50 years or more when stocks haven’t gone anywhere.

For example, the stock market hasn’t really gone anywhere between 1790 and 1860. A 70 year period of time. Sure, there were bull and bear markets, but no net capital gains. Then, if you went long in 1899, you didn’t see any “net inflation adjusted” gains until 1951.

So, what is the risk going long today, at the 3rd highest level of valuations in the history of the market (behind 1929 and 2000 tops)? Umm, I don’t know, but I would imagine there is quite a bit of risk associated with such a stupid proposition.

This conclusion is further supported by my mathematical and timing work. It clearly shows a severe bear market between 2015-2017. In fact, when it starts it will very quickly retrace most of the gains accrued over the last few years.  If you would be interested in learning when the bear market of 2015-2017 will start (to the day) and its internal composition, please CLICK HERE.

(***Please Note: A bear market might have started already, I am simply not disclosing this information. Due to my obligations to my Subscribers I am unable to provide you with more exact forecasts. In fact, I am being “Wishy Washy” at best with my FREE daily updates here. If you would be interested in exact forecasts, dates, times and precise daily coverage, please Click Here). Daily Stock Market Update. June 22nd, 2015  InvestWithAlex.com

Did you enjoy this article? If so, please share our blog with your friends as we try to get traction. Gratitude!!!

Shocking: No Capital Gains Over The Next 50 Years? Google

Earth To Bulls: No Capital Gains Over The Last 12 Months.

Daily Chart June 19 InvestWithAlex

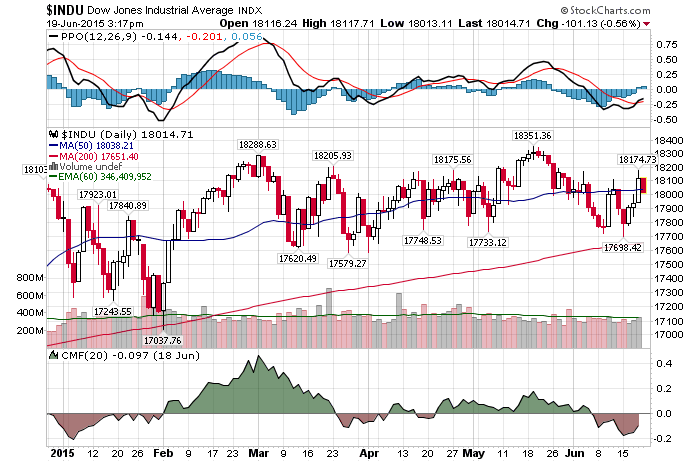
6/19/2015 – A negative day with the Dow Jones down 103 points (-0.57%) and the Nasdaq down 16 points (-0.31%) 

In two weeks time, the NYSE (largest composite by capitalization) will mark a 1-year trading range anniversary. In other words, while there have been some net positive sectors(mostly specs), the overall stock market hasn’t gone anywhere in close to a year. And quite a few sectors are selling off.

Further, with VIX/VXX being where they are, most traders and investors find themselves in a very deep slumber. At exactly the wrong time. As I have mentioned here before, the market is accumulating energy, and once released, most investors will be caught with their pants down. As always. That is to say, a massive amount of volatility will come back into the market at some point this year. If you would like to find out exactly when that will happen, to the day, please Click Here.  

Now, let’s see what’s trending.

Traders channel Bill Murray on Greece, China: ‘It just doesn’t matter’

As was mentioned above, don’t confuse today’s strength with the market’s resilience or being able to avoid a potentially explosive situation. It is all about timing and sequencing. As my subscribers very well know, the market is in the process of completing a certain structure. When that period of low volatility ends, things will turn on a dime.

And no matter what the fundamental situation is at the time. We will see if these same traders will be able to say “It just doesn’t matter” then. For now, we wait.

It’s a bond market exodus

We have beaten this topic to death over the last few months, but it is important to keep it in the back of your mind.

“High grade credit funds suffered their biggest outflow this year, and double the previous week (and also the biggest since June 2013). High yield outflows also jumped to $1.1bn, the biggest since the start of the year. However, government bond funds suffered the most amid the recent spike in volatility, with outflows surging to the highest weekly number on record ($2.7bn). This brings the total outflow from fixed income funds to almost $6bn over the last week, the highest since the Taper Tantrum and the third highest outflow ever.”

There are two things to consider here. First, if the FED if unwilling to raise rates, the bond market might do it for them. Either way, it’s bad news for the stock market.

Second, there is very little liquidity in both the bond market and the stock market. I am hearing it directly from friends who have large individual stock positions. It is taking them a long time to liquidate their stakes without impacting the price. Meaning, should the market accelerate to the downside, let’s say a 10-15% move down, we are likely to see panic and acceleration. Be aware of that.

This conclusion is further supported by my mathematical and timing work. It clearly shows a severe bear market between 2015-2017. In fact, when it starts it will very quickly retrace most of the gains accrued over the last few years.  If you would be interested in learning when the bear market of 2015-2017 will start (to the day) and its internal composition, please CLICK HERE.

(***Please NoteA bear market might have started already, I am simply not disclosing this information. Due to my obligations to my Subscribers I am unable to provide you with more exact forecasts. In fact, I am being “Wishy Washy” at best with my FREE daily updates here. If you would be interested in exact forecasts, dates, times and precise daily coverage, please Click Here). Daily Stock Market Update. June 18th, 2015  InvestWithAlex.com

Did you enjoy this article? If so, please share our blog with your friends as we try to get traction. Gratitude!!!

Earth To Bulls: No Capital Gains Over The Last 12 Months.  Google