Stock Market Update. InvestWithAlex.com January 27th, 2014

Daily Chart January 27 2014

Summary: Continue to maintain a LONG/HOLD position. 

1/27/2014 – Another down day for the market with the DOW being down 41 points or (-0.26%). The NASDAQ was down 44.5 points or (-1.08%) as it played catch up closing the divergence gap mentioned here last week.

Overall, the short term trend is down, while the long term picture remains bullish. We did identify December 31st, 2013 as the major turning point and the beginning of the bear market that should take us into the 2017 lows.  Yet, we must first wait for a technical confirmation before reversing our long/hold position and going short.

Short term, the market could experience further weakness, before reversing and closing before mentioned gaps in the 16,400 range.  

Did you enjoy this article? If so, please share our blog with your friends as we try to get traction. Gratitude!!!

What Is The Fastest Way To Get Rich? Diversification or Concentration

InvestWithAlex Wisdom 16


Today’s 5 Minute Podcast Covers The Following Topics:

Reader’s Question: “What would you recommend if I would like to maximize my investment returns while minimizing risk? Diversification or concentration…” – Justin White

    • Find out which strategy is a clear winner.
    • The proper way to execute this unique approach.
    • Major problems associated and how to avoid them.
    • What you should do next to start accumulating large profits.   

Please tweet me your questions @investwithalex

Did you enjoy this podcast? If so, please review it on iTunes and share it with your friends as we try to get traction. Gratitude!!!

Can Japan’s Economic Miracle Help The US Economy?

Yahoo Finance Writes: This could signal the next leg down for stocks

nikkea 5 year

Things are precarious in Japan, and that could mean trouble for US markets.

Once the hottest trade on Earth, the Nikkei is off by 7% this year, compared to the 3% decline in the S&P 500. The culprit is a rising yen, as investors have shunned risk and flocked to safe haven currencies.

Over the past several months, the Japanese government under the leadership of Prime Minister Shinzo Abe has been trying to weaken the yen in an effort to boost its economy. Japan’s version of quantitative easing is roughly the same size as America’s but, given that Japan’s economy is one-third the size of the US, it’s had a bigger impact.

Read The Rest Of The Article Here

I don’t think Japan will have any impact on the US Financial markets. Historically speaking there has been no correlation, nor should there be one. It is simply idiotic to think otherwise.

The reason I am bringing Japan to your attention is due to pure stupidity of their economic policies. Japan has been stuck in the economic funk for over 24 years now. The Nikkei is still down a little over 60% since its top in the 1990. The Japanese (just like their American counterparts) have tried everything under the sun to get their economy going while fighting deflation. Well, everything that is easy and stupid.

What they should have done, default on bad debts while following sound macroeconomic principals, was never done. Instead, they have tried to combat deflation by lowing interest rates and debasing their currency.

I am still waiting for a good explanation from one of those Nobel Prize winning economists of how any economy can prosper through debasement of their currency. It is no different from robbing Peter to pay Paul. Yet, for most countries it is the new solution to all of their economic problems. That is until the currency overshoots and collapses, leading to economic chaos. India and Turkey are the prime examples of this over the last few months.

Yes, Nikkei is up close to 100% over the last year and a half. Yet, a distinction must be made between true market growth and speculative growth driven by insane monetary policy. The latter leads to an eventual economic collapse and pain. I will let you decide in which category Japan falls into.  

Did you enjoy this article? If so, please share our blog with your friends as we try to get traction. Gratitude!!!

Can Japan’s Economic Miracle Help The US Economy? 

Is It Possible To Predict The Stock Market? YES

InvestWithAlex Wisdom 15

Today’s 5 Minute Podcast Covers The Following Topics:

Reader’s Question: Why are you so confident that we have hit the top? As far as I know no one can predict the markets. Please explain your approach…” – Roger Strand  

    • Is it possible to predict the market? 
    • The secret behind timing and/or predicting the market? 
    • What does it tell us about the future? 
    • What to do in case my timing work is incorrect. 

Did you enjoy this podcast? If so, please review it on iTunes and share it with your friends as we try to get traction. Gratitude!!!


Who Else Wants To Buy At The Top?

advisors


Business Week Writes Investment Advisers Go All In on Stocks

Advisers surveyed weekly by the National Association of Active Investment Managers have 98.3 percent of their clients’ portfolios allocated to stocks. Exposure to equities averaged 72 percent during 2013.

What a shocker!!!  Just as always and exactly at the wrong time.

This is nothing new when one sees the market from the vintage point of human psychology. Most investors make the same mistake. When speculation and advancing market psychology grips investors psyche, there only one thing left to do. BUY. BUY. BUY. Why? Well, because everyone else is doing it and just like the retail market participants, financial advisors and money managers don’t want to be left behind.

Yet, as per my article yesterday, “MARKET TOP” the markets just topped out. As always, instead of getting out or going short most investment advisors are rushing into stocks. Just like they were rushing OUT of stock in March of 2009, when they should have been buying everything under the sun.

Sometimes human nature never changes. 

Did you enjoy this article? If so, please share our blog with your friends as we try to get traction. Gratitude!!! 

Stock Market Update, InvestWithAlex.com, January 24, 2014

Daily Chart January 24 2014


Summary: Continue to maintain a LONG/HOLD position. 

1/24/2014 – A horrific day in the market today with the DOW being down -318 points or (-1.96%). While not the end of the world, it got people to pay attention. 

This type of a move is consistent with the beginning of a bear market. In my earlier blog post today, MARKET TOP, I have indicated that it is highly probable that the market topped out on December 31st, 2013. Both my mathematical and my cycle work confirm the conclusion. Now, the market gapped down again leaving another 100 point hole in the structure of the market. This indicates (at least to me) that while the long-term bull market has topped out, the market is likely to bounce into the 16,400 category to close the gaps before any sustained bear market move can take place. While I do anticipate further downside over the short-term, the market should bounce in order to give us a technical indication that the bear market is indeed here. 

I will have more details on this in my weekly update tomorrow. 

Did you enjoy this article? If so, please share our blog with your friends as we try to get traction. Gratitude!!!  

Why The Market Top Is In And What You Should Do Next

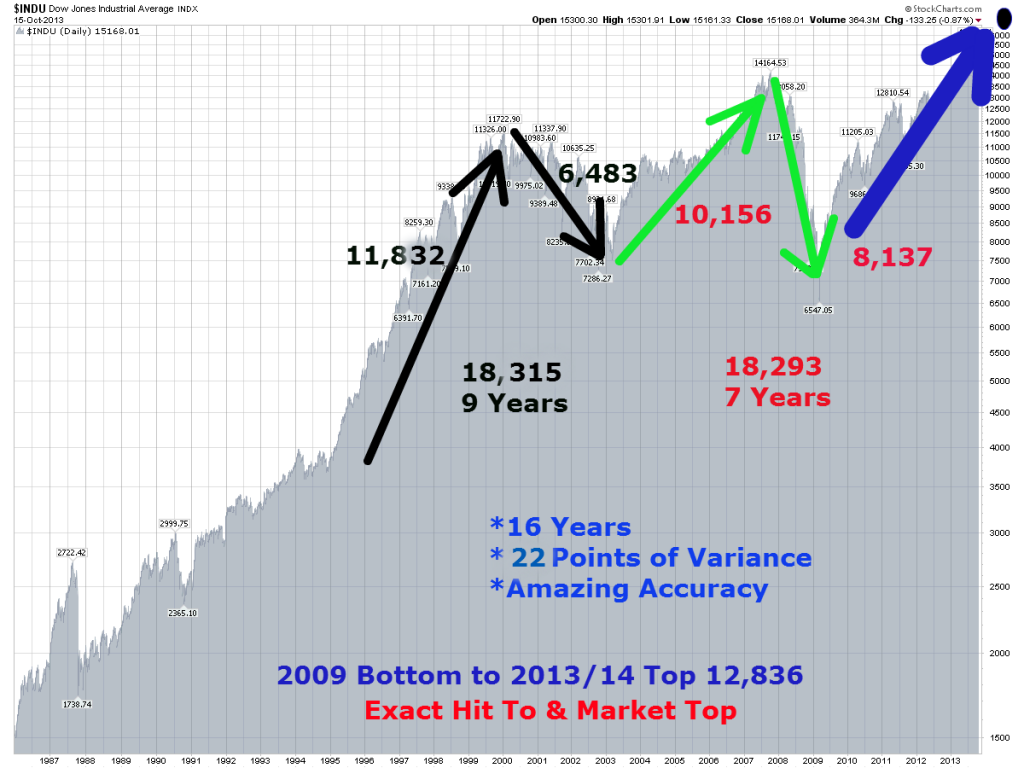
Long Term Dow Structure35


In my earlier blog posts I have mentioned that we had a cluster of very important turning points showing up around December 31st, 2013 and January 1st of 2014 (based on my cycle work). Indicating a significant turning point. 

Yet, my mathematical work at the time didn’t confirm. That is until Tuesday of this week. You can blame a simple brain fart or a lack of sleep on my part.  

I have shown the chart above before. To prove to you that the stock market is not random, but quite the opposite, it is exact. Showing you that there was only a 22 point variance over a 16 year period of time. Further, when we take the values on the chart above and do a few simple calculations we get a value of 12,935.

So what? 

Based on my calculations, the move between March 2009 bottom to December 31st, 2013 top on the DOW was exactly 12,836. That is an exact hit with 0.7% variance. With cycle work and mathematical confirmations coming together, I have no choice but to call for a market TOP.  

(***What calculation? Please get my book titled Timed Value coming out this Monday for further explanation. It would take too long to explain here). 

Now, even though the market top is in, we have to wait for a technical confirmation before taking our short position. Based on my previous experience that is a prudent thing to do. 

What should you do next?

Option #1: If you are in stocks, start getting out and going into cash. Earning 2-5% annually is heck of a lot better than losing 30-40% over the next 3 years (the length of upcoming bear market). Plus, you will have money when the bottom comes to buy some wonderful companies at give away prices. 

Option #2: Profit on the short side. At the same, this will be a very difficult thing to do. The upcoming bear market is unlikely to be directional. My work shows that it will closely resemble the 2000-2003 bear market with a lot of ups and downs. As such, it will be difficult to make money on the short side.

The best advice I can give you is this. Protect and accumulate cash. Once we hit bottom in 2017, the market will start its 18 year bull market.  

Did you enjoy this article? If so, please share our blog with your friends as we try to get traction. Gratitude!!! 

Why The Market Top Is In And What You Should Do Next 

Stock Market Update, January 23rd, 2014.

Daily Chart January 23 2014


Summary: Continue to maintain a LONG/HOLD position.   

1/23/2014 – An ugly day in the market today with the Dow being down -176 points or (-1.07%) and NASDAQ down -24.13 points or (-0.57%). Please note that the divergence between the DOW and Nasdaq as it continues to increase. 

Also, note that the DOW gapped down at the open to the tune of 100 points. That “hole” is still open. If you follow my blog you know what I am going to say next. This opening must be closed before the market can gather up a sustained bear move. The market always closes its gaps. For the time being, this doesn’t change our overall market position. Even thought the DOW most likely topped on December 31st, 2013, technically speaking, the overall market trend is still up. As such, we must wait for a trading confirmation before taking a short position. 

Tomorrow I will have a much longer explanation on why my work shows the market has topped out and what you should do about it. 

Did you enjoy this article? If so, please share our blog with your friends as we try to get traction. Gratitude!!! 

Stock Market Update, January 23rd, 2014.

Warning: Did The Bear Market Already Start? Find Out Here

bear is coming


Today’s 5 Minute Podcast Covers The Following Topic: “Warning: Did The Bear Market Already Start? Find Out Here”

    • Is the bear market already here? Why? 
    • The secret structure behind the market over the next 3 years. 
    • How to make a lot of money over the next few years. 
    • What should I do now?  

Did you enjoy this podcast? If so, please review it on iTunes and share it with your friends as we try to get traction. Gratitude!!!

Cycle Work Predicts A Bear Market. What Should You Do?

USA Today Writes: Aging bull faces fresh survival tests

 bull-vs-bear1

Sadly, no bull market lives forever on Wall Street. And the current bull, which was born on March 9, 2009, and has delivered a fat gain of 172%, is no exception.

The current bull is nearly 5 years old. That’s longer than the average bull, which tends to last closer to four years, according to data going back to 1932 compiled by InvesTech Research newsletter. “Not only is the current bull a full year longer than the norm, it is about to become the fourth-longest since 1932,” says editor James Stack. “If that doesn’t make you nervous, it should.”

Read The Rest Of The Article Here

I oftentimes talk about an important 5 years market cycle on this blog. If you go back and study the market in greater detail, you will see this 5 year cycle appearing constantly. 

For instance,  from 1932 to 37, from 1982 to 1987, from 1994 -2000, from 2002 to 2007. These are just the prominent and known cycles, but there are many others. In both bull and bear market legs.  In addition, we are not talking about 5 years +/- 6 months. In most cases, the cycles were exact as my earlier analysis on this blog showed. Now, we have a very clear 5 year pattern developing  within the existing bull market run. The cycle started with a V shape bottom in March of 2009 and will complete itself in March of 2014.

What does it all mean? The 5 year cycle simply confirms our overall hypothesis that the bear market is about to start. It indicates that the market is finishing up its 5 year growth spiral and should roll over shortly to start its 3 year bear leg. Get yourself ready.

Did you enjoy this article? If so, please share our blog with your friends as we try to get traction. Gratitude!!!