Stock Market Complacency Hits An All Time High

Gone are the days when the stock market actually oscillated. Thanks to the FED and their little liquidity party, we have been in a narrow upward slopping channel for over 6 years now. Is the party about to end?

Well, as the video above pertains, very few people think so. VIX/VXX are close to their respective all time lows, there is a lot of complacency, most believe that we are in a secular bull market that has at least 10 years left, etc….. At the same time Put Option Cost At An All Time High, Crash Coming?

But don’t despair just yet.

According to the same video, get this, the party is not even close to being over. Why? Because we haven’t seen the speculative blow off typically associated with market tops. That is to say, most money managers believe it still OK to speculate away. Preferably on margin. I wish them luck.

Z30

Stock Market Complacency Hits An All Time High  Google

Coming Soon: Trade Of The Decade?

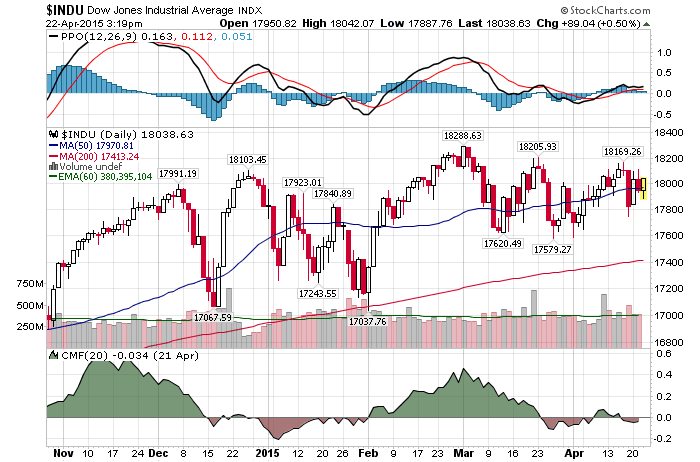
Daily Chart April 22 2015

4/22/2015 – A positive day with the Dow Jones up 88 points (+0.49%) and the Nasdaq up 21 points (+0.42%) 

In last night’s daily update I have suggested that today’s short setup is about as ideal as the long setup was at 2009 bottom. Hence, short sellers should be thankful for such high prices.

Bill Gross introduces the same idea, but in the bond market Bill Gross’s ‘Short of a Lifetime’ Would Mean Armageddon (watch the video, it’s worth your time).

“It’s Just A Matter Of Time”

While the conversation in the link above has to do with zero yielding German bonds, the same line of thinking should apply to the US Treasury market. At some point “follow the FED” trade will fail and the yields will surge. And while I don’t think we are there yet, it is just a matter of time. As a result, my forecast remains, 10-Year Treasury note will see a double bottom at 1.4-1.5% over the next two years before this 30 year bull run in yields is over.

When it comes to the stock market, “short equity” setup we are facing today is about as ideal as it was at 2000 and 2007 tops. Very limited upside or risk (if any) and massive downside. In other words, long-term investors should heed the lessons of two previous market tops. And instead of trying to figure out how many more years this secular bull market has left (hint: we are still in a secular bear market that started in 2000), they should seriously consider shifting their portfolios to the short side or cash.

This conclusion is further supported by my mathematical and timing work. It clearly shows a severe bear market between 2015-2017. In fact, when it starts it will very quickly retrace most of the gains accrued over the last few years.  If you would be interested in learning when the bear market of 2015-2017 will start (to the day) and its internal composition, please CLICK HERE.

(***Please Note: A bear market might have started already, I am simply not disclosing this information. Due to my obligations to my Subscribers I am unable to provide you with more exact forecasts. In fact, I am being “Wishy Washy” at best with my FREE daily updates here. If you would be interested in exact forecasts, dates, times and precise daily coverage, please Click Here). Daily Stock Market Update. April 22nd, 2015  InvestWithAlex.com

Did you enjoy this article? If so, please share our blog with your friends as we try to get traction. Gratitude!!!

Coming Soon: Trade Of The Decade  Google

How Broke Is The USA? This Will Shock You

broke

Boston University economist Laurence Kotlikoff did not hold back in his Senate Budget Committee testimony, “The first point I want to get across is that our nation is broke. Our nation is broke, and it’s not broke in 75 years or 50 years or 25 years or 10 years. It’s broke today.” He goes on to point out…

  • Indeed, it may well be in worse fiscal shape than any developed country, including Greece
  • This declaration of national insolvency will, no doubt, shock those of you who use the officially reported federal debt as the measuring stick for what our country owes
  • We have a $210 trillion fiscal gap at this point,” Kotlikoff told the senators, which amounts to 211 percent of the U.S.’ $18.2 trillion GDP, making it higher than Greece’s 175 percent debt-to-GDP ratio
  • 16 times larger than official U.S. debt, which indicates precisely how useless official debt is for understanding our nation’s true fiscal position
  • Stated differently, the overall federal government is 58 percent underfinanced.

And so on and so forth. You get the picture. The US will never be able to repay 25% of its obligations, let alone all of it. This leads to a few possible outcomes. An outright default, war and/or currency debasement/hyperinflation.  I wonder which option the fools in our government will choose.

Z31

How Broke Is The USA? This Will Shock You Google

Why Short Sellers Should Be Thanking GOD

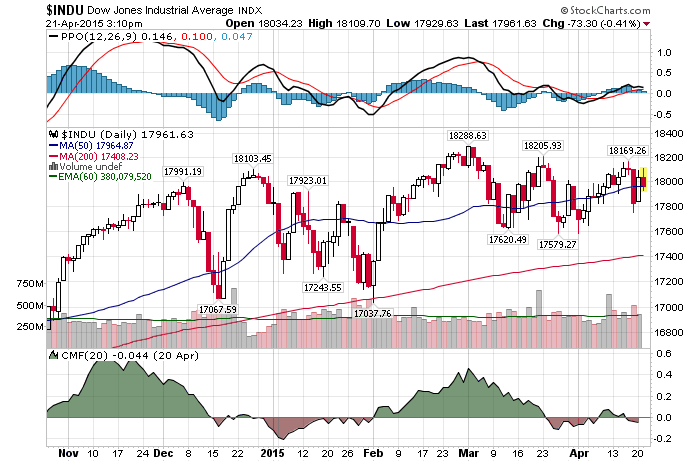
Daily Chart April 21A 2015

4/21/2015 – A mixed day with the Dow Jones down 85 points (-0.47%) and the Nasdaq up 19 points (+0.39%)

Short sellers, repeat after me….

  • An opportunity to short Netflix (NFLX) at $570? Thank you Jesus (or whoever you pray to).
  • An opportunity to short Biotech (IBB) at $364?  Praise the Lord.
  • The Nasdaq is at 5,000…… Hallelujah.

On a more serious note, once in the while the stock market does something so utterly stupid, it takes your breath away.  What am I talking about? Today’s divergence between fundamental/macro data and the market’s bubble valuation levels. I wrote about it earlier Why The FED Has No Clue. Yet, despite this apparent ideal short trade setup, it’s not as easy as it sounds.

For short-sellers in U.S. stocks, the agony just piles on

“How are you supposed to actively short stocks in this environment? It has been impossible,” Seattle-based Fleckenstein told Reuters.

His frustration is shared by others dedicated to betting on declines, if not for the broader market then for individual stocks that look overvalued. Outside of the hard-hit energy industry, most sectors have performed well over the last several months, and dedicated short funds have been stung.

The biggest take away from the article above is not that short sellers have been unable to make money, but rather, the fact even the best researched and most successful short sellers are afraid to enter this market on the short side.

Isn’t that bullish? 

On the contrary. That suggests three things. First, everyone is already in. Just as they were at 2000 and 2007 tops. Second, the market has been distributing for close to 9 months. Finally, any upcoming bear leg is likely to be fast/violent. In other words, today’s short sellers should be grateful for the many amazing money making opportunities the market offers.

This conclusion is further supported by my mathematical and timing work. It clearly shows a severe bear market between 2015-2017. In fact, when it starts it will very quickly retrace most of the gains accrued over the last few years.  If you would be interested in learning when the bear market of 2015-2017 will start (to the day) and its internal composition, please CLICK HERE.

(***Please Note: A bear market might have started already, I am simply not disclosing this information. Due to my obligations to my Subscribers I am unable to provide you with more exact forecasts. In fact, I am being “Wishy Washy” at best with my FREE daily updates here. If you would be interested in exact forecasts, dates, times and precise daily coverage, please Click Here). Daily Stock Market Update. April 21st, 2015  InvestWithAlex.com

Did you enjoy this article? If so, please share our blog with your friends as we try to get traction. Gratitude!!!

Why Short Sellers Should Be Thanking GOD Google

Why The US Stocks Are About To Surge Higher

I have to admit something. This blog has been overwhelmingly bearish over the last few months. If for no other reason than my mathematical and timing work. It clearly shows a severe bear market over the next few years. Click here to see when it starts. And while I would love to be a bull here, that would go against my entire body of work.

However, if you are a little girl and in need of a little “pick me up”, to feel all warm and fuzzy inside, I have just the thing for you.  Watch the video below. As you can clearly see, despite bubble level valuations and multitude of divergences (macro Vs stocks), the stock market is about to surge higher. And don’t forget to buy on margin.

z33

Why The US Stocks Are About To Surge Higher Google

Shoeshine Boys Are Long Biotech

Daily Chart April 21 2015

4/20/2015 – A positive day with the Dow Jones up 209 points (+1.17%) and the Nasdaq up 63 points (+1.27%)

I am starting to notice something curious. The overall US stock market has been, more or less, in a flat trading range since about July 17th, 2014. Or for 9 months. Yet, the speculative spirits are running as hot as ever. I am seeing the evidence of that everywhere as most people continue to “yap” about their highly speculative positions. And I am not the only one.

Market top conversations are back. 

“One of our producers was out with some hipsters in Brooklyn, and these people were all talking about biotech stocks,” he says. “When you get that kind of chatter at that kind of level, it just makes me nervous.”

This is incredibly important as we have now come a full circle. March 6th, 2009 bottom was incredibly easy to predict and identify. We had a number of cycles and mathematical structures arriving at the same time. Yet, not a single person or hedge fund I gave this information to, acted on it. Why? Simple psychology. After a 55-70% drop in most equities, they were too terrified.

Now, the situation is reversed. After a 6 year bull market, no one can imagine a substantial decline. Even though most of the stocks are incredibly expensive and have disconnected from any sort of a fundamental/economic reality.

Don’t forget, it’s buy low  – sell/short high, and NOT buy high – sell/short low.

This conclusion is further supported by my mathematical and timing work. It clearly shows a severe bear market between 2015-2017. In fact, when it starts it will very quickly retrace most of the gains accrued over the last few years.  If you would be interested in learning when the bear market of 2015-2017 will start (to the day) and its internal composition, please CLICK HERE.

(***Please Note: A bear market might have started already, I am simply not disclosing this information. Due to my obligations to my Subscribers I am unable to provide you with more exact forecasts. In fact, I am being “Wishy Washy” at best with my FREE daily updates here. If you would be interested in exact forecasts, dates, times and precise daily coverage, please Click Here). Daily Stock Market Update. April 20th, 2015  InvestWithAlex.com

Did you enjoy this article? If so, please share our blog with your friends as we try to get traction. Gratitude!!!

Shoeshine Boys Are Long Biotech Google

Why Most People Will Miss The Market Top….Again

John D Rockefeller

Because I highly doubt that you are smarter than John D. Rockeffeller. Let me tell you a cool story first.  

The Dow set a secondary bottom in early May of 1924 and then went on a rampage bull market that terminated on September 3rd, 1929 (exact top). Thereafter, the Dow distributed for 6 weeks before initiating its crash sequence on October 24, 1929. By November 13th, 1929 the Dow was down 49%. A devastating collapse.

Now, I know what you are thinking. “People were kind of dumb back then. The market was clearly in a speculative bubble and even a monkey with half a brain could have seen the 1929 crash coming from a mile away”.  WRONG. Human nature never changes. Case and point, I present to you probably the smartest and the wealthiest businessman who ever lived, Mr. John D. Rockeffeller (his net worth was over $200 Billion in today’s money).

October  30, 1929: The Dow Jones Industrial Average has one of its best days ever, rocketing up 29 points, or 12.3%, to 258 as John D. Rockefeller, Sr. announces: “There is nothing in the business situation to warrant the destruction of values that has taken place on the exchanges during the past week. My son and I have for some days been purchasing sound common stocks.” The Dow goes on to lose 84.1% more of its value before bottoming out on July 8, 1932.

I think his quote speaks for itself.  Just as in 1929, 99.99% of people today are not aware of where we are. Back to 2015.  I have already beaten the fundamental/economic/market horse and today’s stock market overvaluation/speculation levels to death. Both, in my daily blog and in my weekly updates. The only remaining question is, are you ready for a big market sell-off when it comes? If you would like to find out when that happens, please Click Here

z33

Why Most People Will Miss The Market Top….Again  Google

How It Was Possible To Predict Today’s Stock Market Bloodbath

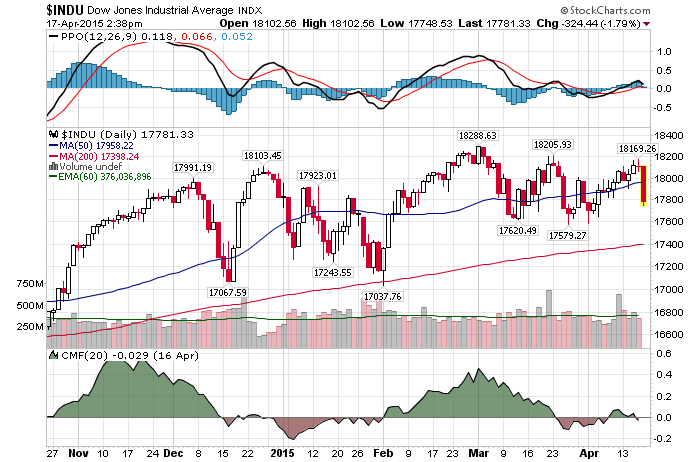
Daily Chart April 17 2015

4/17/2015 – A big down day with the Dow Jones down 280 points (-1.55%) and the Nasdaq down 76 points (-1.52%). 

The stock market continues to behave exactly as forecasted. If you would like to find out what happens next, please Click Here.

So, was it possible to predict today’s sell-off?

Sure, but you wouldn’t be able to forecast or anticipate it with the help of either fundamental or technical analysis.  You would need something more. You would need TIMING analysis.

Most investors measure the movements of their underlying financial instruments in PRICE only. That is a wrong approach. Don’t forget, all charts consist of two axis. Price and time. By concentrating only on the price portion of the equation, investors and analyst leave out 50% of necessary data. TIME data needed to make accurate stock market forecasts. In other words, we need to unify price and time.

To fully understand how to do that, get two free chapters of my book Timed Value. 

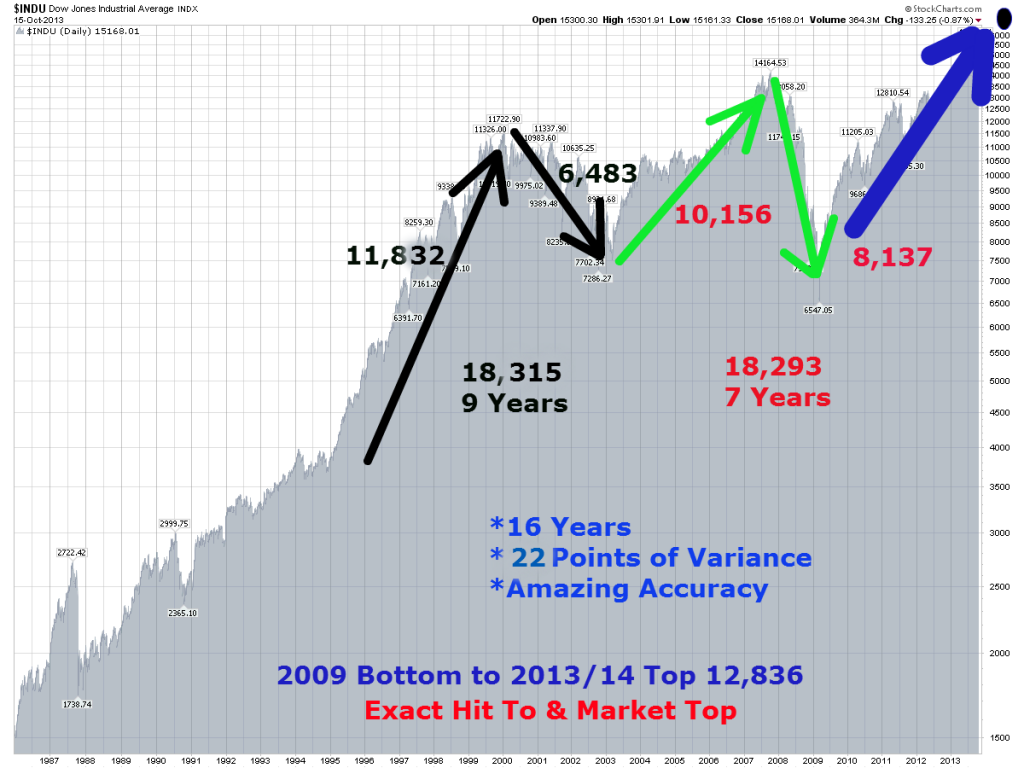
Let’s take a quick look at the real stock market example to see the amazing precision this particular technique can offer us.
Long Term Dow Structure35

I cannot overstate how amazing this chart is. Just a few points. (3-DV stands for 3-Dimensional Value)

  • As we have already discussed, the move between 1994 bottom and 2000 top was 11,832 3-DV UNITS. The Dow topped at exactly 11,866 in January of 2000. Amazing!!!
  • The up move between 1994 bottom and 2000 top was 11,832 3-DV UNITS. The down move between 2000 top and 2002 bottom was 6,483 3-DV UNITS. When you combine both values together you end up with a value of 18,315 3-DV UNITS. The move took 9 years.
  • The up move between 2002 bottom and 2007 top was 10,156 3-DV UNITS. The down move between 2007 top and 2009 bottom was 8,137 3-DV UNITS. When you combine both values together you end up with a value of 18,293 3-DV UNITS. The move took 7 years.

To summarize, the combined move took 16 years and there was only 22 3-DV UNITS of variance between two sections. This variance over the 16 year period of time can be attributed to as little as 2 trading days and a few hundred points on the Dow. This example alone should put to rest all claims that the stock market is random and unpredictable. Once again, when we identify the exact structure of the stock market through using our 3-Dimensional analysis we can time the market with great precision.

For example, if we understand the structure above we know that the move between 2002 bottom and 2009 bottom will be identical in 3-DV UNITS of the move between 1994 bottom and 2002 bottom. Just by having this information alone one should be able to figure out the stock market with great precision. Further, once we have hit the 2007 top on the DOW, any analyst using this technique knows that the upcoming down move will be exactly 8,127 3-DV UNITS. (18283-10156=8,127)

That would mean that once the 2007 top is confirmed you would know exactly where the market would bottom. So, while everyone is freaking out in the late 2008 and early 2009 you are either shorting the market and making a lot of money or you are setting yourself up for the upcoming bull market that you know will start in March of 2009. Same thing or calculations apply to the December 31st, 2013 top on the Dow Jones.

I hope this clearly illustrates how powerful this type of an analysis can be.  Again, once the market structure is fully understood you would know not only where but WHEN the market would turn.

So, what does the future hold…….will we get another bounce (buy the dip) or is this sell-off just getting started? 

Well, my mathematical and timing work clearly shows a severe bear market between 2015-2017. In fact, when it starts it will very quickly retrace most of the gains accrued over the last few years.  If you would be interested in learning when the bear market of 2015-2017 will start (to the day) and its internal composition, please CLICK HERE.

(***Please Note: A bear market might have started already, I am simply not disclosing this information. Due to my obligations to my Subscribers I am unable to provide you with more exact forecasts. In fact, I am being “Wishy Washy” at best with my FREE daily updates here. If you would be interested in exact forecasts, dates, times and precise daily coverage, please Click Here). Daily Stock Market Update. April 17th, 2015  InvestWithAlex.com

Did you enjoy this article? If so, please share our blog with your friends as we try to get traction. Gratitude!!!

How It Was Possible To Predict Today’s Stock Market Bloodbath Google